Introduction
The menstrual cycle (MC) is a sequence of physiological changes that prepare the uterus for a possible pregnancy, typically lasting between 21 and 35 days in individuals with a regular cycle (defined as eumenorrhoeic) [1, 2]. It is traditionally divided into the follicular and luteal phases [3, 4], though a more detailed classification includes early and late follicular, ovula-tory, and early, mid, and late luteal phases due to varying hormone levels [5]. The cycle starts with menstruation (which usually takes 4 to 6 days), followed by an increase in oestrogen during the follicular phase, leading to a luteinising hormone (LH) surge that triggers ovulation. After ovulation, the luteal phase begins, during which the corpus luteum produces progesterone and oestrogen to support potential implantation. If fertilisation does not happen, hormone levels drop, causing the uterine lining to shed and restart the cycle [4, 6, 8]. Due to these hormonal variations, many athletes believe their performance fluctuates throughout the menstrual cycle [7–9]. Overall, athletes tend to perceive poorer performance during the early follicular and late luteal phases, although considerable inter-individual variability exists. However, the timing of ovulation, and therefore the various MC phases, can be highly variable among women [10].
A significant proportion of elite female athletes experience natural hormonal fluctuations throughout the MC [1] as 67–91% are eumenorrhoeic [11, 12], and about half do not use hormonal contraception [13, 14]. Fluctuations in oestrogen, progesterone, and testosterone across the MC have been shown to influence several physiological systems relevant to sports performance, including metabolism, thermoregulation, neuromuscular function, and cognition [15–17]. Testosterone levels peak during the ovulatory phase, with increased post-exercise levels also observed in the ovulatory and mid-luteal phases [18]. Oestrogen, which rises toward the late follicular phase, has been linked to reduced cellular catabolism and potential muscle growth benefits [19, 20], as well as enhanced glycogen storage and greater reliance on lipid metabolism [15]. Progesterone, in contrast, primarily affects thermoregulation, ventilation, and cardiovascular strain [21]. Hormonal fluctuations may also influence neuromuscular fatigability and certain cognitive domains, with greater fatigability reported in the follicular phase [22] and phase-related changes observed in spatial and executive functions [23, 24].
Based on these physiological mechanisms, numerous studies have investigated whether physical performance varies across MC phases, although findings remain inconsistent across outcomes and study designs. Strength and power performance have been suggested to be greater during phases characterised by higher oestrogen and testosterone concentrations, particularly the late follicular and ovulatory phases, whereas lower strength levels have been reported during the luteal phase in some studies [25]. Rapid force production and neuromuscular activation have also been reported to vary across the MC, with phase-dependent differences in motor unit behaviour [26]. However, evidence regarding anaerobic performance is largely inconclusive, as most studies included in previous reviews found no clear effect of MC phase on anaerobic capacity [1], despite isolated findings of phase-related differences in sprint, jump, or peak power performance [26]. However, evidence regarding anaerobic performance is largely inconclusive, as most studies included in previous reviews found no clear effect of MC phase on anaerobic capacity [26], despite isolated findings of phase-related differences in sprint, jump, or peak power performance [26–28]. Agility performance appears to be largely unaffected by MC phase [29].
Regarding aerobic performance, oestrogen has been shown to enhance fat oxidation and cardiovascular efficiency, whereas progesterone may attenuate these effects by increasing ventilatory and cardiovascular strain [25].
Moreover, as oestrogens regulate the expression of trophic factors and favour the most essential processes of neuronal function, they sometimes do so through mechanisms that are concurrent to those of progesterone [30]. Although some changes during each menstrual phase may not be sufficient to influence specific factors affecting fitness components, fluctuations in oestrogen/progesterone ratios across the cycle may play a central role in physiological systems.
Body mass and total body water typically increase from the follicular to the luteal phase, likely due to hormonal influences on fluid retention and appetite regulation [31–33]. Nevertheless, most evidence suggests that endurance performance is minimally affected by MC phase, although intermittent endurance tasks may be more sensitive to hormonal fluctuations than continuous exercise [1].
When considering the overall body of literature examining the impact of the MC on sports performance, there is still no clear consensus, a conclusion reinforced by a recent systematic review and meta-analysis focusing on exercise test performance [34]. However, this review did not comprehensively differentiate between distinct physical capacities. Similarly, other systematic reviews and meta-analyses have focused specifically on strength outcomes [35] or resistance training adaptations [36], leaving uncertainty regarding the integrated effects of the MC phase across multiple performance domains.
Furthermore, the growing number of recent studies highlights the need for an updated and comprehensive synthesis. Therefore, the objective of the present study is to systematically compile and meta-analyse the available evidence on the influence of the MC across different physical capacities, including strength, aerobic and anaerobic performance, agility, and related outcomes, to better inform coaches and practitioners involved in training female athletes.
Material and methods
This systematic review and meta-analysis adhered to the guidelines established by the Cochrane Collaboration and the PRISMA (Preferred Reporting Items for Systematic Reviews and Meta-Analyses) framework [37]. The review focused on analysing the effect of different menstrual cycle phases in eumenorrhoeic women ( 18 years) on key athletic performance measures (e.g., power output, endurance, speed, strength). We included experimental (randomised and non-randomised controlled, crossover) and observational studies investigating physical performance outcomes across menstrual-cycle phases in eumenorrhoeic women. The protocol was registered in PROSPERO (CRD420250655 563) on 24 Feb 2025, after the initial database search (21 Feb 2025); thus, the registration is retrospective. We re-ran all searches from the registration date as a sensitivity analysis; the results were consistent with the main analyses.
Eligibility criteria
Table 1 details the criteria for inclusion and exclusion in this systematic review and meta-analysis using the PICOS methodology – Population, Intervention, Comparator, Outcomes, and Study Design.
Table 1
Inclusion and exclusion criteria
Information sources
Electronic databases (Web of Science, Scopus, PubMed, and SPORTDiscus) were searched for relevant publications on 24 February 2025, in line with the registered protocol. To identify further relevant studies, we manually reviewed the reference lists of the selected articles. We also used snowball citation tracking through the Web of Science database. Moreover, each included study was carefully examined for any potential errors or retractions.
Search strategy
The search was conducted using the Boolean operators ‘AND’ and ‘OR’ without applying any filters for date, language, or study design, to capture a broad spectrum of relevant studies. The search targeted the ‘title’, ‘abstract’, and ‘keywords’ fields. Table 2 presents the complete list of search results for each database.
Table 2
Full search strategy for each database
Selection process
In the initial stage of the research process, two independent reviewers (AFS and GG) screened the studies by reviewing their titles and abstracts. These abstracts were assessed using predefined inclusion criteria, and full-text articles were obtained when necessary. In the subsequent phase, the same two reviewers independently examined the full texts of the studies that passed the initial screening. Any disagreements were discussed between them, and if a consensus could not be reached, a third reviewer (CG) was brought in to assist in resolving the conflict. To efficiently manage the records and remove duplicates, both manual and automated approaches were applied, with the aid of the EndNote™ software (version 20.5, Clarivate Analytics, Philadelphia, PA).
Data collection process
One of the authors (GG) began the data extraction process, which was subsequently reviewed by two other authors (AFS and CG) to verify its accuracy and completeness. A customised Microsoft Excel spreadsheet (Microsoft®, USA) was created to systematically collect all relevant data. In cases where information was missing from the full-text articles, AFS reached out to the corresponding authors via email or ResearchGate to obtain the required details. Studies that did not receive a response within two weeks were excluded from both the review and the meta-analysis.
The key details extracted from each study included: (i) competitive level based on Participants Classification Framework [38]; (ii) sample size; (iii) age of the sample; iv) sport analysed; (v) number of weeks of observation; vi) sample size in each menstrual cycle (early follicular, late follicular, ovulatory, early luteal and mid luteal); (vii) instrument for classifying the menstrual phase; and (viii) outcomes measured.
Data items
To maintain consistency in data analysis and reporting, only outcomes reported in at least three studies were considered. For physical demands, the following variables were extracted: (i) oxygen consumption (VO2); (ii) anaerobic power; (iii) strength on knee extensors; (iv) strength on knee flexors; (v) sprint; and (vi) jumps. Therefore, studies that assessed participants at only one or two time points were excluded, as evaluations limited to a single phase of the menstrual cycle do not allow for meaningful comparisons between different cycle phases.
Risk of bias assessment
The risk of bias assessment was conducted using the Revised Cochrane Risk of Bias Tool for Randomized Trials (RoB 2.0), which allows evaluating potential biases across five domains: bias arising from the randomisation process, bias due to deviations from intended interventions, bias due to missing outcome data, bias in measurement of the outcome, and bias in selection of the reported result. While RoB 2.0 is primarily designed for parallel-group or cluster-randomised trials, its principles were adapted to suit the specific characteristics of crossover designs, particularly in our case involving repeated assessments within the same population across different phases of the menstrual cycle.
Given that crossover trials involve participants receiving all interventions in a sequence, the standard RoB2.0 domains required minor adjustments. Specifically, for studies repeatedly assessing the same individuals across different menstrual cycle phases, the focus shifted from between-group comparisons to within-subject comparisons. This necessitated an adjusted approach to domains like ‘bias due to deviations from intended interventions’ and ‘bias due to missing outcome data’, where the potential for carry-over effects, period effects, or differential dropout between menstrual phases became paramount. Adjustments were made to interpret the applicability of each domain’s signalling questions in the context of within-subject variability and the specific physical changes associated with the menstrual cycle, ensuring that any potential biases unique to this repeated-measures crossover design were adequately captured. The procedure was conducted by two authors (GA and AFS).
Effects, measures, and synthesis methods
Pairwise comparisons were performed to estimate the standardised mean differences (SMDs) in physiological and physical performance outcomes, namely VO2 peak, anaerobic power, knee extensor and flexor strength, sprint performance, and jump ability, between the early follicular phase (the reference phase) and each of the subsequent menstrual cycle (MC) phases (late follicular, ovulation, early luteal, mid-luteal, and late luteal). Where applicable, strength outcomes were further stratified by contraction mode (isometric vs. isokinetic) and, for isokinetic measures, by angular velocity. A random-effects model was employed to account for between-study heterogeneity and to assess whether the pattern of variation across menstrual phases differed according to the specific physiological outcome under analysis.
Standardised mean differences were estimated using Hedges’ g, calculated from the means and standard deviations reported in each study. The Hedges’ g estimator was selected to correct for small-sample bias and to enable comparability across studies using different measurement scales. Confidence intervals (95%) were computed for each effect size. All analyses employed the Knapp–Hartung [39] adjustment to enhance the robustness of variance estimation under random-effects modelling.
Heterogeneity was assessed using multiple indicators. The between-study variance (τ2) was estimated via Hedges’ estimator [40]. Cochran’s Q test [41] and the I2 statistic were used to quantify and test for the presence of heterogeneity. In cases where heterogeneity was detected (i.e., τ2 > 0, irrespective of the Q-test significance), 95% prediction intervals were computed to reflect the expected range of true effects across future studies.
Influence diagnostics were conducted to identify potential outliers and influential cases. Studentised residuals and Cook’s distances were calculated. A study was classified as a potential outlier if its studentised residual exceeded the 100 × (1 – 0.05 / [2 × k]) percentile of the standard Normal distribution, where k is the number of included studies. Studies with Cook’s distance values exceeding the median plus six times the interquartile range of all Cook’s distances were considered highly influential.
Forest plots were used to summarise the results of each pairwise comparison, displaying the effect sizes (Hedges’ g) and their corresponding 95% confidence intervals for each included study. Each plot also incorporated the model-based weights (i.e., the inverse-variance weights from the random-effects model), visually representing the relative contribution of each study to the pooled effect size estimate. A vertical reference line at zero indicated the null effect, allowing the identification of statistically significant results (those whose confidence intervals did not include zero).
Publication bias was assessed via funnel plot asymmetry, using both the rank correlation test [42] and the regression test [43], with the standard error of the effect size as the predictor in the latter.
Finally, a mixed-effects meta-regression model was fitted to explore whether the menstrual cycle phase moderated the observed effects. Menstrual phase was included as a categorical moderator to estimate the differences across all phases, even in the presence of incomplete phase coverage across studies. This approach allowed for a comprehensive and statistically robust examination of differential effects across the menstrual cycle [37, 44].
All statistical analyses were conducted using the MAJOR module in JAMOVI (version 2.3.21), which interfaces with the R statistical environment (R version 4.5.1) and implements random-effects meta-analytic models using the inverse-variance method with Hedges’ g as the effect size estimator, the Hedges estimator for τ2, and the Knapp–Hartung adjustment for inference [45]. A significant level of 5% ( = 0.05) was adopted for all hypothesis tests.
Certainty assessment
The GRADE framework [17] guided our evidence assessment, specifically its five criteria: risk of bias, indirectness, inconsistency, risk of publication bias [46], and imprecision. These elements, which can diminish the certainty of evidence, informed our classification of evidence quality for load and performance outcomes (high, moderate, low, or very low). Initially, all non-randomised studies received a low-quality designation. However, this could be upgraded in the presence of substantial effect sizes, robust control of confounders, or a clear dose–response relationship. Upgrades adhered strictly to GRADE guidelines [47–50], occurring only when no downgrading factors were identified.
Our confidence in the evidence was evaluated against a comprehensive set of established criteria. Initially, we assessed each study’s risk of bias. A one-level downgrade was applied for moderate risk of bias, and a two-level downgrade for high risk. We maintained a default assumption of low indirectness, given that all study populations, exposures, and outcomes directly met our eligibility criteria. Lastly, we assessed imprecision based on sample size and the clarity of the observed effect. A one-level downgrade occurred if the sample size was less than 800 participants (fewer than 400 per group) [51] or if the 95% confidence interval crossed zero, making the effect direction unclear [51]. When both these factors indicated imprecision, a two-level downgrade was implemented.
Results
Study identification and selection
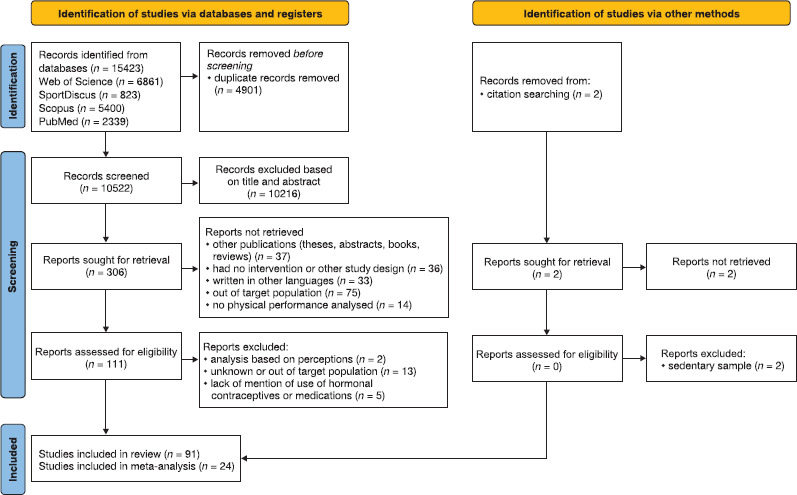
An initial search was conducted across four electronic databases, yielding a total of 15,423 records, of which 4,901 were eliminated as they were duplicates. 10,522 records were screened based on their titles and abstracts. From this screening process, 306 records were excluded, and the full texts of 111 manuscripts were analysed in detail. 20 papers were excluded based on specific criteria: (i) analysis based on perceptions (n = 2); (ii) unknown or out of the target population (n = 13); and (iii) lack of mention of use of hormonal contraceptives or medications (n = 5). As a result, this review includes a total of 91 studies, of which 24 were included in the meta-analysis, as illustrated in Figure 1.
Study characteristics
The analysis of menstrual cycle phases revealed that the late follicular (61 studies) and mid-luteal (66 studies) phases were the most frequently investigated among the 68 studies included. Fewer studies analysed the early follicular (50 studies) and ovulatory (42 studies) phases, with the early luteal (10 studies) and late luteal (4 studies) phases being the least commonly studied.
The participants in these studies exhibited a wide age range, approximately from 17 to 37 years. The most frequently observed sports and activities included running (9 studies), soccer (6 studies), resistance/strength training (5 studies), and rowing (4 studies). Other sports such as basketball, synchronised swimming, gymnastics, handball, futsal, cycling, and swimming were also represented.
Regarding the assessed outcomes, studies commonly focused on various aspects of physical performance, including strength and power (e.g., vertical jump, anaerobic power, isometric strength), endurance and aerobic capacity (e.g., VO2max, lactate responses, time trial performance), and flexibility and biomechanics (e.g., knee laxity, hamstring extensibility, dynamic balance). Physiological and metabolic responses, such as heart rate, oxygen consumption, and hormone levels, were also frequently analysed. The most common method for classifying menstrual phases was calendar-based tracking, often supplemented by ovulation prediction kits or direct hormone level measurements. Supplementary Material 1 presents a descriptive table summarising the characteristics of the 68 included studies, including the number of participants, age, type of sport, menstrual cycle phases, method of menstrual cycle monitoring, and physical outcomes analysed. It also provides details of the studies that were included in the meta-analysis.
Risk of bias assessment
The risk of bias was assessed for each outcome included in the meta-analysis, as pooling was feasible due to the consistent domains identified across the heterogeneous and diverse data from the included studies. Accordingly, and in alignment with the studies selected for the meta-analysis phase, an adapted version of the RoB 2 tool for crossover trials was employed to evaluate the risk of bias in these studies. Figure 2 presents the risk of bias in the VO2max and anaerobic power outcomes. Among the 6 studies assessing VO2max, 4 were rated as having a high overall risk of bias. Similarly, 4 out of 6 studies evaluating anaerobic power also showed a high overall risk of bias.
Figure 2
Adapted Risk of Bias Tool for Randomised Trials (RoB 2.0) applied to crossover studies, assessing the risk of bias for maximal oxygen uptake (VO2max) and anaerobic power. The assessment covers the following domains: D1 – randomisation process; D2 – bias arising from period and carryover effects, and deviations from intended interventions; D3 – missing outcome data; D4 – measurement of the outcome; D5 – selection of the reported result.
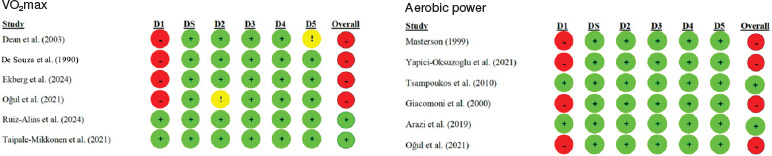
Figure 3 shows the risk of bias in knee extensor and flexor strength. Among the 7 studies assessing knee extensor strength, 7 were rated as having a high overall risk of bias. Similarly, 4 out of 4 studies evaluating knee flexor strength also showed a high overall risk of bias.
Figure 3
Adapted Risk of Bias Tool for Randomised Trials (RoB 2.0) applied to crossover studies, assessing the risk of bias for knee extensor and flexor strength. The assessment covers the following domains: D1 – randomisation process; D2 – bias arising from period and carryover effects, and deviations from intended interventions; D3 – missing outcome data; D4 – measurement of the outcome; D5 – selection of the reported result.
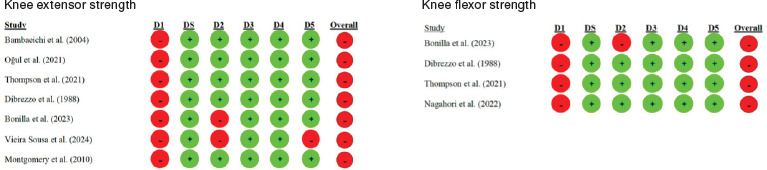
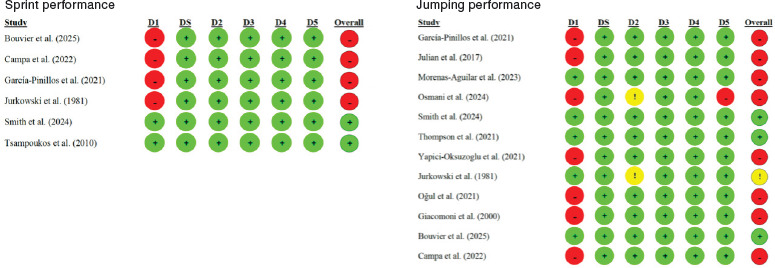
Figure 4 displays the risk of bias in sprint and jumping performance. Among the 6 studies assessing sprint performance, 4 were rated as having a high overall risk of bias. Similarly, 8 out of 12 studies evaluating jumping performance also showed a high overall risk of bias.
Figure 4
Adapted Risk of Bias Tool for Randomised Trials (RoB 2.0) applied to crossover studies, assessing the risk of bias for sprint and jumping performance. The assessment covers the following domains: D1 – randomisation process; D2 – bias arising from period and carryover effects, and deviations from intended interventions; D3 – missing outcome data; D4 – measurement of the outcome; D5 – selection of the reported result.
Meta-analysis
To ensure a consistent meta-analysis, we had to establish a standardised definition for the most commonly reported measures across the included studies. This standardisation ensured that only comparable data could be pooled, resulting in the exclusion of certain articles from the meta-analysis phase when their outcome measures did not align with the predefined domains and lacked sufficient similar outcomes to form a separate domain. Given the variety of outcomes reported, we identified and selected the following main domains for meta-analytic pooling, based on the availability of sufficient and consistent data: maximal oxygen uptake (VO2max), specifically including studies that explicitly measured this variable; anaerobic power, defined by measures of anaerobic peak power or maximal power output; knee extensor strength, encompassing measures like knee extension peak torque, maximal knee extension, or isometric quadriceps strength; knee flexor strength, including measures of the peak torque of the knee flexors or knee flexor strength; sprint performance, characterised by mean 20-metre and 30-metre sprint performance times, as well as sprint force-velocity profiles; and jumping performance, comprising measures of countermovement jump (CMJ) height, vertical jump height, squat jump (SJ) height, and SJ force-velocity.
Maximal oxygen uptake (VO2max)
The meta-analysis on VO2max included studies [52–57]. The pairwise comparisons analysis based on a random-effects model did not reveal any statistically significant differences in VO2max performance between the early follicular phase and the other menstrual cycle phases, as the 95% confidence intervals of the standardised mean difference (Cohen’s d) estimates included zero.
A total of k = 11 effect sizes (Figure 5) were included in the analysis. The observed standardised mean differences ranged from –0.46 to 0.23, with most estimates being negative (82%). The nine negative effects suggest a higher average VO2max performance in phases following the early follicular phase. Conversely, two positive effect estimates were observed for the comparisons between the early follicular phase and both the late follicular and late luteal phases, indicating better VO2max performance in the reference category. However, none of the observed effects reached statistical significance.
Figure 5
Forest plot of standardised mean differences (Cohen’s d) in maximal oxygen uptake (VO2max) performance, estimated under a random-effects model. Values represent point estimates (Cohen’s d) and their 95% confidence intervals for each effect. Effects are ordered by the magnitude of the observed effect sizes.
The random-effects (RE) model provides the overall weighted average estimate.
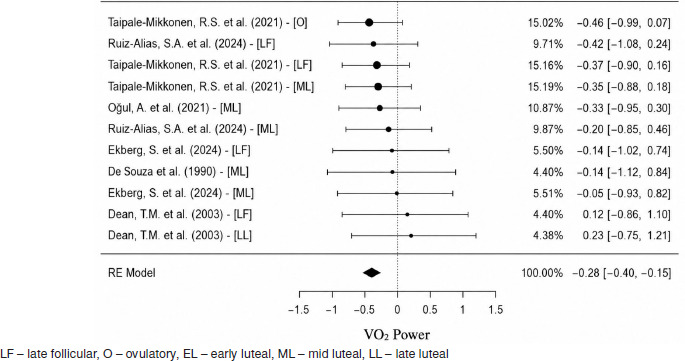
The overall estimated standardised mean difference was μ = –0.28, 95% CI [–0.40, –0.15], which was statistically significant, t(10) = –4.80, p = 0.000. This indicates a significantly lower average VO2max performance in the early follicular phase compared to the other phases of the menstrual cycle.
According to the Q-test, there was no significant heterogeneity in the true effects, Q(10) = 2.99, p = 0.982, τ2 = 0.00, I2 = 0.00%, suggesting consistency among the observed effects across studies. Diagnostic analysis of the studentised residuals revealed that none of the studies had residuals exceeding ± 2.84, indicating no outliers in the context of this model. Furthermore, Cook’s distances showed that none of the studies were overly influential. However, both the rank correlation and regression tests indicated potential funnel plot asymmetry, r = 0.60, p = 0.010, and = 5.55, p = 0.000, respectively.
The mixed-effects model did not identify menstrual cycle phase as a statistically significant moderator of effect size magnitude, = 0.04, SE = 0.04, Z = 1.06, p = 0.316, 95% CI [–0.05, 0.13]. In contrast, the overall average effect (intercept) was statistically significant, = –0.39, SE = 0.12, Z = –3.22, p = 0.011, 95% CI [–0.66, –0.12], indicating a negative standardised mean difference between groups.
Anaerobic power
The meta-analysis on anaerobic power included the studies of [56, 58–62]. A total of k = 9 effect sizes assessing anaerobic performance across different phases of the menstrual cycle were included in the analysis (Figure 6). The observed standardised mean differences (Cohen’s d) ranged from –0.82 to 1.17, with most estimates indicating a negative effect (56%), suggesting lower anaerobic performance during the early follicular phase. Statistically significant negative effects were identified in comparisons between the early follicular phase and (i) the ovulatory phase, d = –0.82, 95% CI [–1.56, –0.07] [59], and (ii) the early luteal phase, d = –0.38, 95% CI [–0.66, –0.10] [58], indicating significantly higher anaerobic performance in the ovulatory and early luteal compared to the early follicular phase. Conversely, statistically significant positive effects were found in comparisons between the early follicular phase and (i) the late follicular phase, d =1.17, 95% CI [0.37, 1.97] [60], and (ii) the mid-luteal phase, d = 0.95, 95% CI [0.30, 1.60] [56], indicating superior performance in the early follicular phase relative to the late follicular and mid-luteal phases. Although some phase comparisons showed statistically significant effects, the overall estimated standardised mean difference was μ = 0.09, 95% CI [–0.44, 0.62], which was not statistically different from zero, t(8) = 0.37, p = 0.718. Therefore, no consistent global trend in anaerobic performance across menstrual phases can be established.
Figure 6
Forest plot of standardised mean differences (Cohen’s d) in anaerobic power, estimated under a random-effects model. Values represent point estimates (Cohen’s d) and their 95% confidence intervals for each effect.
Effects are ordered by the magnitude of the observed effect sizes.
The random-effects (RE) model provides the overall weighted average estimate.
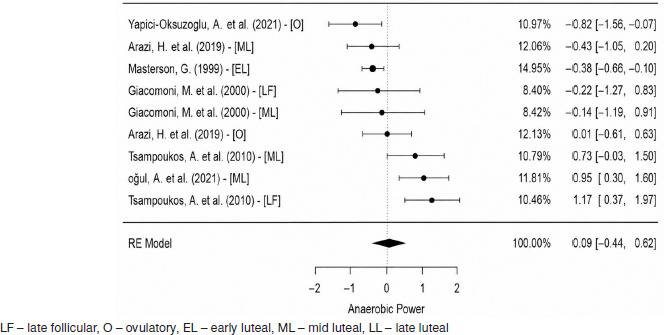
Heterogeneity analysis revealed a significant amount of variability among the true effects, Q(8) = 32.85, p < 0.001, τ2 = 0.32, I2 = 75.64%. The 95% prediction interval for the true effects ranged from –1.33 to 1.50, indicating that while the average effect is estimated to be positive, true effects may vary considerably, including potentially negative effects in some studies.
The analysis of studentised residuals identified one potential outlier, with a residual of ± 2.77 [60 – LF]; however, its removal did not improve the model fit or reduce the heterogeneity, and the study was therefore retained in the meta-analysis. According to Cook’s distances, none of the studies were found to be overly influential.
Neither the rank correlation test nor the regression test indicated funnel plot asymmetry, r = 0.17, p = 0.610, and = 0.45, p = 0.670, respectively. In the mixed-effects model, the menstrual cycle phase did not emerge as a statistically significant moderator of anaerobic performance, = 0.02, SE = 0.21, Z = 0.08, p = 0.937, 95% CI [–0.47, 0.51].
Knee extensor strength
The meta-analysis on knee extensor strength included the studies of [56, 63–67]. A total of k = 15 effect sizes were included in the analysis (Figure 7). The observed standardised mean differences ranged from –4.39 to 0.74. The estimated average standardised mean difference based on the random-effects model was μ = –0.45, 95% CI [–1.14, 0.24], which did not differ significantly from zero, z = –1.29, p = 0.198. According to the Q-test, the true outcomes were significantly heterogeneous, Q(14) = 114.61, p < 0.001, τ2 = 1.67, I2 = 92.53%. A 95% prediction interval for the true outcomes is given by –3.08 to 2.18. Hence, although the average outcome is estimated to be negative, the true outcome may in fact be positive in some studies. An examination of the studentised residuals revealed that one study [68 – ML] had a value exceeding ± 2.94, suggesting it may be a potential outlier in the context of this model. According to Cook’s distances, two analyses [68 – ML; 68 – O] could be considered overly influential.
Figure 7
Forest plot of standardised mean differences (Cohen’s d) in knee extensors, estimated under a random-effects model. Values represent point estimates (Cohen’s d) and their 95% confidence intervals for each effect.
Effects are ordered by the magnitude of the observed effect sizes.
The random-effects (RE) model provides the overall weighted average estimate.
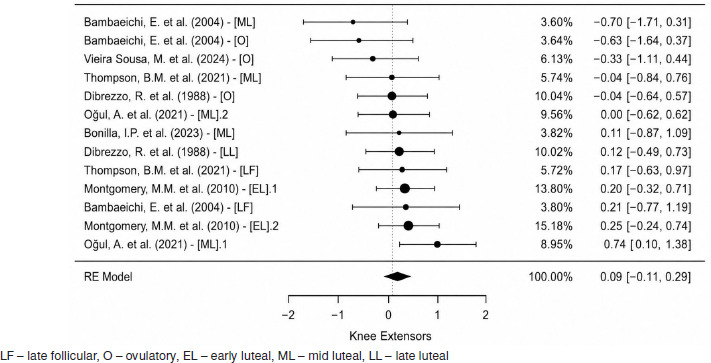
Removal of influential studies [68]: The removal of the two influential analyses [68 – ML; 68 – O] eliminated both the heterogeneity and evidence of publication bias among the remaining k = 13 studies.
The observed standardised mean differences then ranged from –0.70 to 0.74, with most estimates being positive (54%). The estimated average standardised mean difference under the updated random-effects model was μ = 0.09, 95% CI [–0.11, 0.29], which did not significantly differ from zero, t(12) = 0.99, p = 0.344. A statistically significant positive effect was observed between the early follicular and the mid-luteal phase, d = 0.74, 95% CI [0.10, 1.38] [56], indicating superior performance in the first one.
The Q-test indicated no significant heterogeneity among the true outcomes, Q(12) = 10.45, p = 0.576, τ2 = 0.00, I2 = 0.00%. An analysis of studentised residuals revealed no values exceeding ± 2.89, indicating no potential outliers. Similarly, Cook’s distances suggested that none of the studies were overly influential. Neither the rank correlation test nor the regression test detected any funnel plot asymmetry, r = –0.36, p = 0.100, and = –2.00, p = 0.070, respectively. In the mixed-effects model, menstrual cycle phase did not emerge as a statistically significant moderator of the effect sizes, = 0.04, SE = 0.04, Z = 1.06, p = 0.316, 95% CI [–0.05, 0.13]. In contrast, the overall average effect (intercept) was statistically significant, = –0.39, SE = 0.12, Z = –3.22, p = 0.011, 95% CI [–0.66, –0.12], indicating a negative standardised mean difference between groups.
Knee flexor strength
The meta-analysis on knee flexor strength included the studies of [64, 65, 69, 70]. A total of k = 8 effect sizes were included in the analysis (Figure 8). The observed standardised mean differences ranged from –2.37 to 0.25, with most estimates being negative (75%). The estimated average standardised mean difference based on the random-effects model was μ = –0.44, 95% CI [–1.16, 0.29], which was not significantly different from zero, t(7) = –1.41, p = 0.201. According to the Q-test, the true outcomes were significantly heterogeneous, Q(7) = 38.49, p < 0.001, τ2 = 0.61, I2 = 81.98%. A 95% prediction interval for the true outcomes is given by –2.4245 to 1.5539. Hence, although the average outcome is estimated to be negative, the true outcome may in fact be positive in some studies.
Figure 8
Forest plot of standardised mean differences (Cohen’s d) in knee flexors, estimated under a random-effects model. Values represent point estimates (Cohen’s d) and their 95% confidence intervals for each effect.
Effects are ordered by the magnitude of the observed effect sizes.
The random-effects (RE) model provides the overall weighted average estimate.
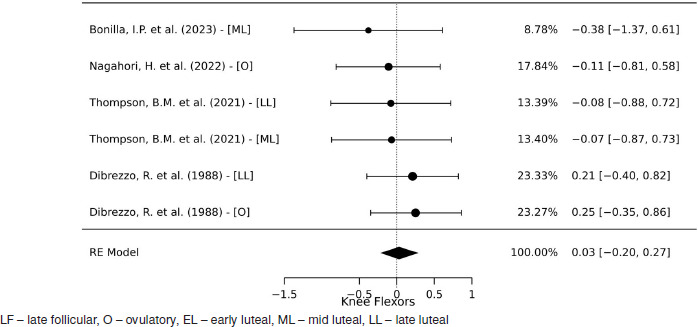
An examination of the studentised residuals identified two potential outliers: [68], with a residual exceeding ± 2.73, and [56], with a residual exceeding ± 2.69. Removal of influential studies [56, 68]: After the removal of these two influential studies, a total of k = 6 studies remained in the analysis. The observed standardised mean differences ranged from –0.38 to 0.25, with most estimates being negative (67%). The updated estimated average standardised mean difference under the random-effects model was μ = 0.03, 95% CI [–0.20, 0.27], which did not significantly differ from zero, t(5) = 0.37, p = 0.725.
According to the Q-test, there was no significant heterogeneity among the true outcomes, Q(5) = 1.83, p = 0.870, τ2 = 0.00, I2 = 0.00%. An analysis of studentised residuals showed no indication of outliers within the context of this model. Similarly, Cook’s distances suggested that none of the studies were overly influential. The regression test indicated potential funnel plot asymmetry, = –4.58, p = 0.010, whereas the rank correlation test did not, r = –0.60, p = 0.136. In the mixed-effects model, menstrual cycle phase did not emerge as a statistically significant moderator of effect size magnitude, = –0.01, SE = 0.07, Z = –0.18, p = 0.871, 95% CI [–0.22, 0.19].
Sprint performance
The meta-analysis on sprint performance included the studies of [60, 71–75]. A total of k = 12 effect sizes were included in the analysis (Figure 9). The observed standardised mean differences ranged from –0.28 to 1.17, with most estimates being positive (83%). The estimated average standardised mean difference based on the random-effects model was μ = 0.25, 95% CI [0.02, 0.48], which was statistically different from zero, t(11) = 2.38, p = 0.037. A statistically significant positive effect was observed between the early follicular phase and: (i) the ovulatory phase, d = 0.77, 95% CI [0.13, 1.41] [72], and (ii) the late follicular phase, d = 1.17, 95% CI [0.37, 1.97] [60]. These results indicate significantly higher values (worse performance) during the early follicular phase compared to both the ovulatory and late follicular phases.
Figure 9
Forest plot of standardised mean differences (Cohen’s d) in sprint, estimated under a random-effects model. Values represent point estimates (Cohen’s d) and their 95% confidence intervals for each effect.
Effects are ordered by the magnitude of the observed effect sizes.
The random-effects (RE) model provides the overall weighted average estimate.
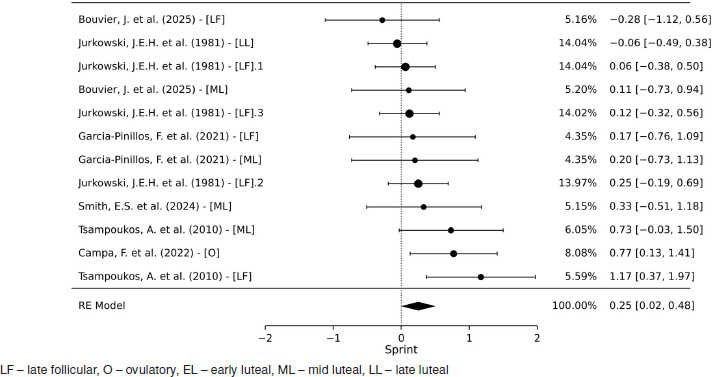
According to the Q-test, there was no significant heterogeneity among the true effects, Q(11) = 13.74, p = 0.248, τ2 = 0.03, I2 = 22.02%. The 95% prediction interval for the true effects ranged from –0.18 to 0.68, suggesting that although the average effect is positive, some true effects may still be negative.
An examination of the studentised residuals revealed no values exceeding ± 2.87, indicating no potential outliers within the context of this model. According to Cook’s distances, none of the studies were overly influential. Neither the rank correlation test nor the regression test detected funnel plot asymmetry, r = 0.24, p = 0.311, and = 1.08, p = 0.307, respectively. The moderation effect of menstrual cycle phase on the outcome was not statistically significant, = –0.02, SE = 0.07, Z = –0.30, p = 0.771.
Jumping performance
The meta-analysis on jumping performance included the studies of [56, 59, 61, 64, 71, 73–78]. A total of k = 23 studies were included in the analysis (Figure 10). The observed standardised mean differences ranged from –0.31 to 0.37, with most estimates being negative (57%). The estimated average standardised mean difference based on the random-effects model was μ = –0.06, 95% CI [–0.13, 0.02], which was not significantly different from zero, t(22) = –1.60, p = 0.124.
Figure 10
Forest plot of standardised mean differences (Cohen’s d) in jumps, estimated under a random-effects model. Values represent point estimates (Cohen’s d) and their 95% confidence intervals for each effect.
Effects are ordered by the magnitude of the observed effect sizes.
The random-effects (RE) model provides the overall weighted average estimate.
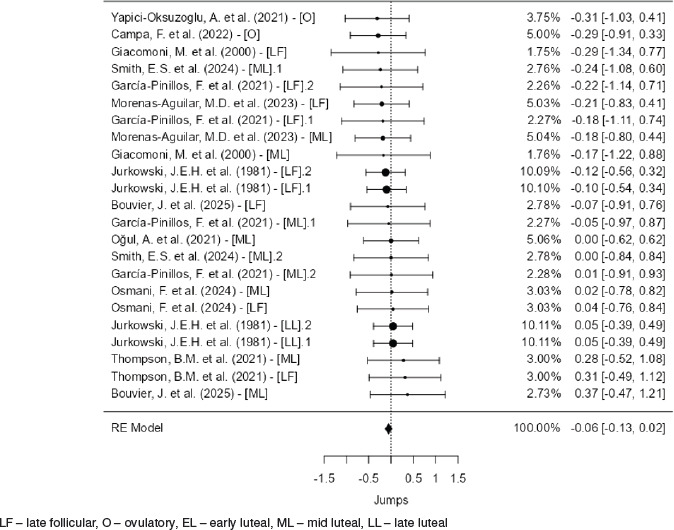
According to the Q-test, there was no significant heterogeneity among the true effects, Q(22) = 5.20, p = 1.000, τ2 = 0.00, I2 = 0.00%. An examination of studentised residuals revealed that none of the studies had values exceeding ± 3.07, indicating no potential outliers within the context of this model. Similarly, Cook’s distances suggested that none of the studies were overly influential. Neither the rank correlation test nor the regression test indicated funnel plot asymmetry (r = –0.11, p = 0.497 and = –0.05, p = 0.957, respectively). The mixed-effects model did not provide a significant fit, indicating that menstrual cycle phase was not a statistically significant moderator of the outcome, = 0.03, SE = 0.03, Z = 1.28, p = 0.216.
Certainty of evidence
The certainty of evidence for all outcomes was assessed using the GRADE methodology, as detailed in Table 3. A primary factor contributing to the reduced certainty was the pervasive high risk of bias (RoB2) observed across most of the studies, resulting in a downgrade of two levels for every outcome (VO2max, anaerobic power, knee extensor strength, knee flexor strength, sprint performance, and jumping performance). Indirectness was not a concern, with no downgrading applied for any outcome. Risk of publication bias was not a factor in the presented assessments.
Table 3
GRADE assessments for maximal oxygen uptake, anaerobic power, knee extensor strength, knee flexor strength, sprint and jumping performance.
[i] Rules for judgement: (i) Following GRADE guidelines (see section 2.9 of the manuscript), they could be upgraded based on the presence of substantial effect sizes, effective control of potential confounders and evidence of a dose–response relationship, if and only if, there were no reasons for downgrading (the five dimensions presented in this table). (ii) Rob2: risk of bias in studies: downgrading by one level in the presence of moderate RoB and by two levels in the presence of a high risk of bias. (iii) Indirectness: low by default (see section 2.9). (iv) Risk of publication: Only valid when 10 studies are included in the meta-analysis. (v) Inconsistency: downgraded by one level if I2 = 25–75% and by two levels if I2 > 75%. (vi) Imprecision: downgraded by one level if n < 800 (< 400 per group) [49] or effect direction unclear (95% CIs crossing zero), or by two levels if both occurred. – very low certainty of evidence, – low certainty of evidence
The inconsistency of the results significantly impacted several outcomes. Anaerobic power, knee extensor strength, and knee flexor strength were all downgraded by two levels due to high statistical heterogeneity (I2 values exceeding 75%, specifically 75.64% for anaerobic power, 92.53% for knee extensor strength, and 81.98% for knee flexor strength). Conversely, VO2max, sprint performance, and jumping performance did not exhibit significant inconsistency (I2 values of 0.0%, 22.02%, and 0.0%, respectively), thus incurring no downgrades in this domain.
Imprecision was another consistent downgrading factor. VO2max and sprint performance were downgraded by one level due to having fewer than 800 participants. More severe downgrades of two levels for imprecision were applied to knee extensor strength, knee flexor strength, and jumping performance, as these outcomes not only had fewer than 800 participants but also lacked a clear direction of effects (implying 95% confidence intervals crossing zero). Anaerobic power also received a one-level downgrade for imprecision due to the sample size.
Discussion
The present meta-analysis aimed to compile existing information and comprehensively evaluate the potential influence of the MC on various physical capacities, ultimately seeking to better inform coaches and managers involved in training women. Our findings reveal a nuanced picture regarding MC-related performance fluctuations. Specifically, the meta-analysis identified a significantly lower VO2 Power during the early follicular phase, suggesting a potential decrement in aerobic capacity during this period. Conversely, sprint performance appeared to be significantly higher in the early follicular phase when compared to the ovulatory and late follicular phases. For other capacities such as anaerobic power, knee extensors, knee flexors, and jumps, the overall evidence did not demonstrate a consistent or significant influence of the MC, often complicated by notable heterogeneity among studies or the impact of influential outliers. This highlights that while some aspects of female athletic performance may be influenced by the MC, the effects are highly specific and not universally observed across all physical capacities.
The most striking finding regarding aerobic capacity was the significantly lower VO2 Power observed during the early follicular phase compared to other MC phases. This suggests a potential decline in an athlete’s maximal oxygen uptake capacity around the onset of menstruation. Several physiological mechanisms might underlie this phenomenon. During the early follicular phase, both oestrogen and progesterone levels are at their lowest [1, 6]. Lower oestrogen levels could potentially impact cardiovascular function, as oestrogen is known to have vasodilatory effects and influence endothelial function, which might affect oxygen delivery [79, 80]. Furthermore, hormonal fluctuations could influence substrate utilisation, potentially shifting towards less efficient fuel sources for aerobic metabolism or impacting mitochondrial function [81, 82]. While individual studies exploring this specific decrement often show varied results – such as findings indicating enhanced VO2max during the late follicular phase and stable strength levels throughout the cycle [53], or others showing no significant changes in aerobic capacity across phases [55] – our meta-analysis, with its robust overall effect size, provides stronger evidence for this trend. From a practical standpoint, coaches should be aware of this potential dip in aerobic performance. This does not necessarily mean high-intensity aerobic training should be avoided, but rather that athletes might perceive these sessions as more challenging, or their performance metrics might be slightly reduced during this specific phase. Adjustments in training load or expectations might be beneficial to optimise recovery and prevent excessive fatigue.
Our analysis revealed significantly higher sprint performance during both the ovulatory and late follicular phases when compared to the early follicular phase. This finding suggests that high-intensity, short-duration power output may be optimised during midto-late cycle phases. One possible explanation involves the elevated oestrogen concentrations present during the ovulatory and late follicular phases, which have been associated with enhanced neuromuscular efficiency, improved muscle contractility, and increased glycolytic capacity [83]. In contrast, the early follicular phase is characterised by low levels of both oestrogen and progesterone, which may contribute to diminished central drive or suboptimal muscle function for explosive efforts. While progesterone has been linked to central nervous system depression and fatigue [71, 84], its lower concentration in the early follicular phase suggests that other factors – such as low oestrogen or hormonal instability – might be more influential in explaining the reduced performance observed. Subtle hormonal shifts affecting fluid balance, joint stability, or muscle stiffness may also play a role. Although some studies report no significant changes in sprint or force– velocity performance across menstrual phases [74, 75], our findings support those that suggest slight improvements in power-based outputs around ovulation [71]. For practitioners, this could have practical implications: scheduling key sprint or power-based training sessions during the ovulatory or late follicular phase may help athletes take advantage of this natural physiological state, potentially enhancing performance adaptations and competitive outcomes.
While VO2 Power and sprint performance showed clear patterns, our meta-analysis did not find a consistent overall influence of the menstrual cycle on anaerobic power, knee extensors, knee flexors, or jumps. This lack of a clear, overarching effect warrants a deeper discussion, particularly concerning the significant heterogeneity observed in the initial analyses for anaerobic power, knee extensors, and knee flexors. High heterogeneity (I2 values ranging from 75.64% to 92.53%) indicated considerable variability in the true effects across the included studies for these capacities, meaning that while some individual studies might have reported effects, these were not consistent enough to form a significant general trend. Several factors likely contribute to this heterogeneity, including methodological inconsistencies across primary studies – such as variations in test protocols, the timing of assessments, control for confounding variables, and the methods used for menstrual cycle phase confirmation. For instance, some studies found no significant differences in strength, muscular endurance, or anaerobic power across menstrual cycle phases [62], while others noted minimal overall impact on performance with only slight changes in specific measures [56]. Additionally, the characteristics of the study populations, like Bambaeichi [63] training level and hormonal contraceptive use, could also explain the disparate findings. It is noteworthy that some research, like [63], indicated that menstrual cycle phase could have a greater influence on certain strength measures than time of day, yet without clear interaction effects, and other studies like Bonilla [70] observed no significant menstrual cycle effects on muscle strength.
A critical aspect of our analysis for knee extensors and knee flexors was the identification and subsequent removal of influential outlier studies. This systematic approach significantly eliminated both heterogeneity (I2 = 0.00% for both after removal) and evidence of publication bias in the remaining analyses for these muscle groups. This suggests that the initial observed variability and a potential negative overall effect were largely driven by these specific studies. Once removed, the remaining evidence indicated no significant general difference in knee extensor or knee flexor strength across the menstrual cycle. Nagahori’s study [69], for example, found no significant differences in overall muscle flexibility and strength characteristics between menstrual and ovulatory phases. For jumps, the analysis consistently showed no significant overall effect (μ = –0.06, p = 0.124) and, importantly, no significant heterogeneity (I2 = 0.00%), even in the initial model. This suggests that, across a larger body of evidence and with consistent findings, vertical jump performance is remarkably stable irrespective of the menstrual cycle phase, despite some individual studies suggesting better jump performance in the follicular phase compared to the menstrual phase [59]. In summary, for anaerobic power, knee extensors, knee flexors, and jumps, the lack of a consistent overall effect, often compounded by initial high heterogeneity or the influence of specific studies, suggests that the menstrual cycle’s impact on these capacities is either minimal, highly individualised, or currently undetectable due to methodological variations in the existing literature.
While our meta-analysis offers valuable insights into the influence of the menstrual cycle on various physical capacities, it is crucial to acknowledge its inherent limitations. A primary concern is the potential for publication bias, particularly evidenced by the funnel plot asymmetry observed for VO2 Power and, to a lesser extent, for knee flexors. This asymmetry suggests that studies reporting statistically significant or favourable outcomes might be more likely to be published than those with non-significant results, potentially skewing the overall effect size. Furthermore, the quality and methodological consistency of the included primary studies posed a challenge. Variations in how menstrual cycle phases were confirmed (e.g., self-report versus hormonal assays), the specific test protocols employed, and the control of confounding variables across studies likely contributed to the considerable heterogeneity noted for some physical capacities, especially before outlier removal. Although our rigorous diagnostic analyses addressed the impact of influential studies for knee extensors and knee flexors, the initial variability underscores the need for more stand-ardised and robust research designs in this field. Lastly, while this meta-analysis aimed to provide a broad overview, it could not delve into more nuanced factors such as the specific type of hormonal contraception used by participants, the individual subjective experience of menstrual symptoms, or the potential long-term adaptations to training across different cycle phases, all of which could further modulate performance outcomes. These limitations highlight areas for future research to refine our understanding of this complex interplay.
Our findings have crucial implications for coaches of female athletes: the potential reduction in VO2 Power during the early follicular phase and, conversely, an increase in sprint performance during the same period. This suggests that while aerobic capacity might slightly decrease at the onset of menstruation, this phase could be ideal for optimising sprint and power training. For capacities like anaerobic power, knee extensors and flexors, and jumps, our meta-analysis found no consistent influence of the menstrual cycle, indicating that there is no strong scientific basis to alter training in these areas. However, individual monitoring of each athlete is essential, encouraging open communication about symptoms and energy levels to allow for person-alised adjustments in training, recovery, and nutrition. In summary, a science-informed approach, combined with individualised athlete care, will optimise training strategies.
To advance our understanding of the menstrual cycle’s influence on physical performance, future research should prioritise more rigorous primary studies. It is crucial to adopt standardised methodologies, with greater control over menstrual cycle phase confirmation (e.g., via precise hormonal assays) and more robust participant samples. We recommend further investigating the underlying physiological mechanisms behind observed effects (or their absence), especially for VO2 Power and sprint performance, and exploring the impact of different types of hormonal contraceptives. Additionally, integrating symptom assessment related to the cycle with performance metrics could provide a more holistic and clinically relevant understanding.
Conclusions
Our results suggest that VO2max may be significantly lower during the early follicular phase, with sprint performance also potentially impaired during this period. However, definitive conclusions cannot be drawn due to the low certainty of the evidence. For other performance measures – such as anaerobic power, knee extensor and flexor strength, and jump performance – the analysis found no consistent or significant influence of the menstrual cycle, often due to methodological inconsistencies across studies. While general recommendations can be made, individual monitoring and open communication with athletes remain essential, given the highly individual nature of the menstrual cycle. Future research should prioritise standardised methodologies to enhance our understanding and support more effective training strategies for female athletes.