Introduction
Soccer, like many team sports, requires a diverse range of physical activities, including sprints, rapid directional changes, jumps, and kicks, which demand the continual development of players’ physical capacities throughout their careers [1–4]. The cyclical nature of the soccer season, characterized by off-seasons with reduced training, can adversely affect body composition and fitness levels. Studies report significant increases in body fat percentage (BF%) during a six-week off-season due to increased fat mass and decreased fat-free mass, which negatively impact speed, power, and high-intensity running [5–7].
Monitoring body composition and physical abilities is critical for optimizing performance and preventing injuries. Regular assessments enable coaches to adjust training plans, ensuring effective decision-making and readiness for competition [8–10]. In elite soccer, body composition and fitness levels fluctuate throughout the season due to variations in training load and competition demands [11–14]. Interval training, particularly high-intensity interval training (HIIT), is essential for enhancing endurance, allowing players to perform technical-tactical elements at peak levels throughout the game. Specific endurance, particularly during high-intensity activities in the final stages of matches, is a key determinant of professional performance [15, 16].
Achieving and maintaining peak performance during the competition phase remains one of the greatest challenges for soccer players. While performance often improves during the preparatory phase, sustaining this level throughout the season is difficult due to limited opportunities for conditioning, mid-season rest phases, and the physical demands of matches. These fluctuations are often accompanied by adverse changes in body composition, which directly impact physical performance. In Kosovo’s super League, the mid-season rest phase is imposed on the clubs because of the weather conditions during wintertime. A second preparatory phase is then necessary and presents unique challenges that require special analysis to manage physical performance effectively. While some neighboring countries with more wealth have found solutions to keep the players as engaged as they can in international away games, less rich countries face financial and infrastructure challenges to keep their players active.
In light of the above, this study aims to analyze variations in specific endurance, measured using the Yo-Yo recovery-Level 1 test, across the preparatory, competition, and mid-season phases. It addresses the challenge of maintaining and improving performance during the competitive season by designing a new training program that links specific endurance to body composition features. To reinforce these findings, the study also examines the relationship between body composition and endurance performance throughout the season.
Material and methods
Experimental design
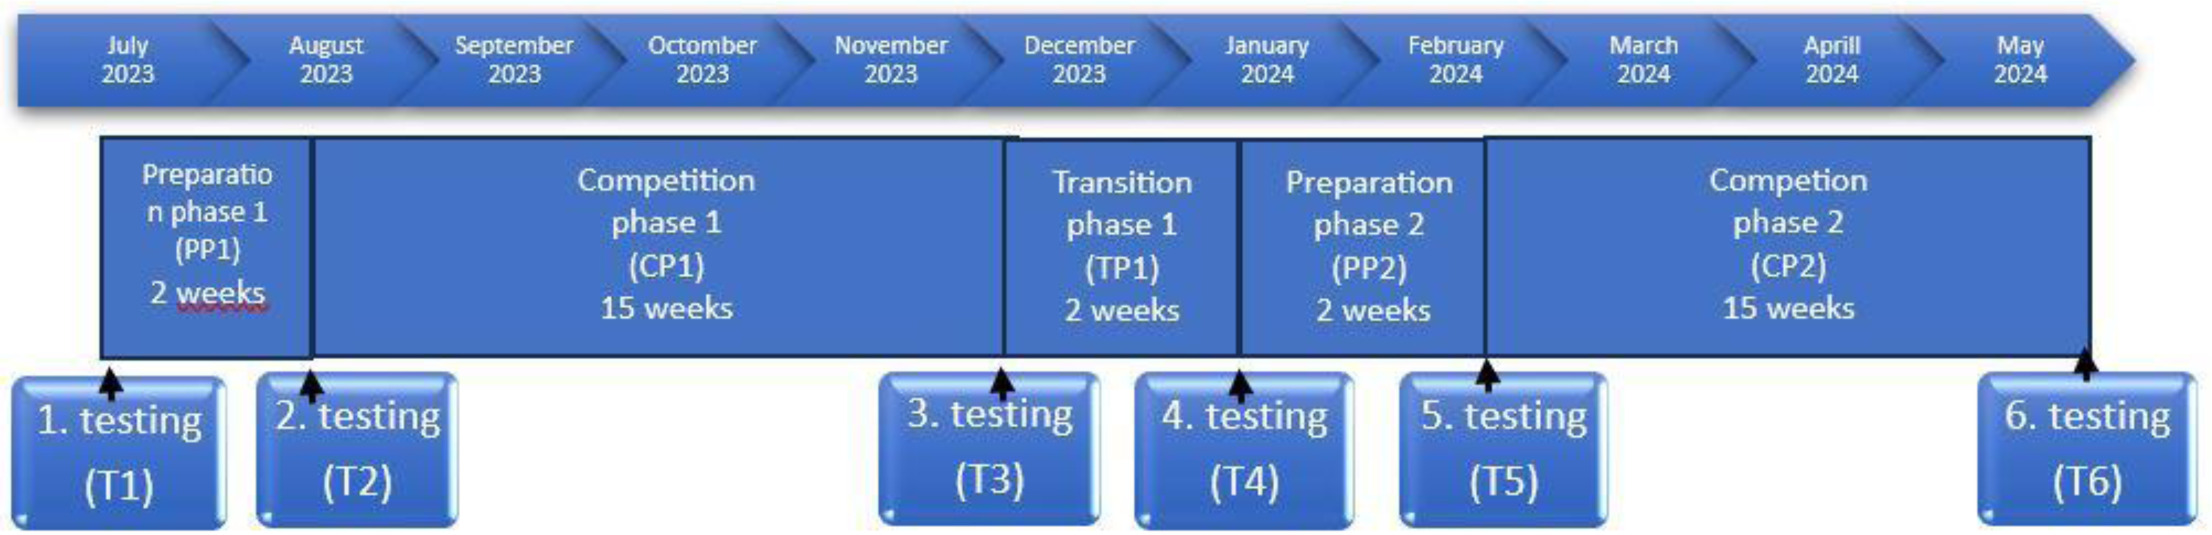
This study was designed to investigate the physical performance of professional soccer players throughout a competitive season. The experiment involved assessing body composition and endurance fluctuations at six distinct time points across both preparatory and competitive phases of the season as shown in Figure 1. During the transition phase between competitive seasons, there was a lack of structured planning. Athletes were recommended to engage in a general training model focused on high-intensity interval training (HIIT) and overall fitness maintenance. However, this phase was not supported by any formal monitoring or evaluation process, making it difficult to track training adherence, intensity, or effectiveness. The Albi Mall Superliga begins in mid-August and concludes at the end of May, with the season timeline, as shown in Figure 1, covering a total of 36 weeks [17]. The 36 weeks include a series of games, meaning that the 36 matches could be completed in less than 36 weeks. However, considering the earlier start of the preparatory phase, it is evident that the entire duration of 36 weeks is utilized.
Participants
The sample consisted of 20 soccer players out of total of 30 players from F.C. Malisheva, competing in the 2023–2024 Kosovo super League, where they placed fourth and participated in the UEFA Conference League. Players had an average height of 180.9 cm and weights ranging from 74.3 to 76.0 kg. Players who did not participate in any of the testing procedures were excluded from the study. Those who missed two training sessions during the preparatory phase and five during the competition phase, due to injury or other reasons, were excluded from the analysis, resulting in a final sample of 20 participants. Prior to the study, all players were briefed on the experimental protocol and potential risks, and no adverse events were reported. Written informed consent was obtained from all participants in accordance with the latest version of the Helsinki declaration. The study protocol was approved by the local ethics committee [UBT College: submission no. (2015/45)].
Anthropometry and body composition
Body height, weight, and BMI were measured at the beginning of each testing session (T1–T6) using standardized protocols. Body composition was analyzed using the Tanita BC 545 N Innerscan segmental Body Analysis scale, which measures parameters such as body fat percentage, total body water, muscle mass, bone mineral mass, basal metabolic rate, visceral fat, and segmental fat/muscle distribution [18]. The testing was conducted in the morning at 10:00 AM for each repetition of the test. Prior to the testing, athletes were thoroughly informed about the procedures and expectations. To ensure accurate and reliable results, the athletes were given specific pre-test instructions. They were advised to refrain from eating, drinking, or engaging in any physical activity for at least 12 h before the test. This precaution aligns with Tanita’s preconditions for testing, which emphasize the importance of a controlled environment to minimize factors that could influence the measurements, such as food intake, hydration status, or physical exertion. These steps were implemented to standardize the conditions across all testing sessions and ensure the integrity of the results.
Yo-Yo recovery-Level 1 test
The Yo-Yo recovery-Level 1 test was conducted on a soccer pitch following a standardized 15-minute warm-up protocol [19]. Players performed progressive 20-meter shuttle runs, guided by an audio beep, followed by a 10-second recovery phase in a marked 5-meter area behind the finish line. The test concluded when participants failed twice to complete a shuttle run within the allotted time. Total running distance (Yo-Yo recovery-Level 1 test distance in meters) was recorded as per Bangsbo et al. [20].
VO2max estimation
VO2max was estimated from Yo-Yo recovery-Level 1 test results using the equation:
Significant correlations with measured VO2max values have been established (r = 0.70 for Yo-Yo IR1).
Training logs
The training plan is structured based on the results of initial testing. The primary program is based on the first test, and it is continuously updated through a systematic testing protocol (see subtitles 3, 4, and 5 of the methods section), which includes six official tests (1. Before the preparatory phase – 12.07.2023; 2. After the preparatory phase – 05.08.2023; 3. Last test of the first phase of season 20.11.2023; 4. Start of the second phase of the season, before the mid-phase – second preparatory phase – 05.01.2024; 5. After the second preparatory phase – 23.01.2024; 6. End of the season – 25.06. 2024) throughout the season. In addition to these six tests, we also conduct control assessments between the scheduled tests to monitor the players’ current performance levels. This approach allows us to adjust the training program as needed, ensuring it remains tailored to the athletes’ progress and needs.
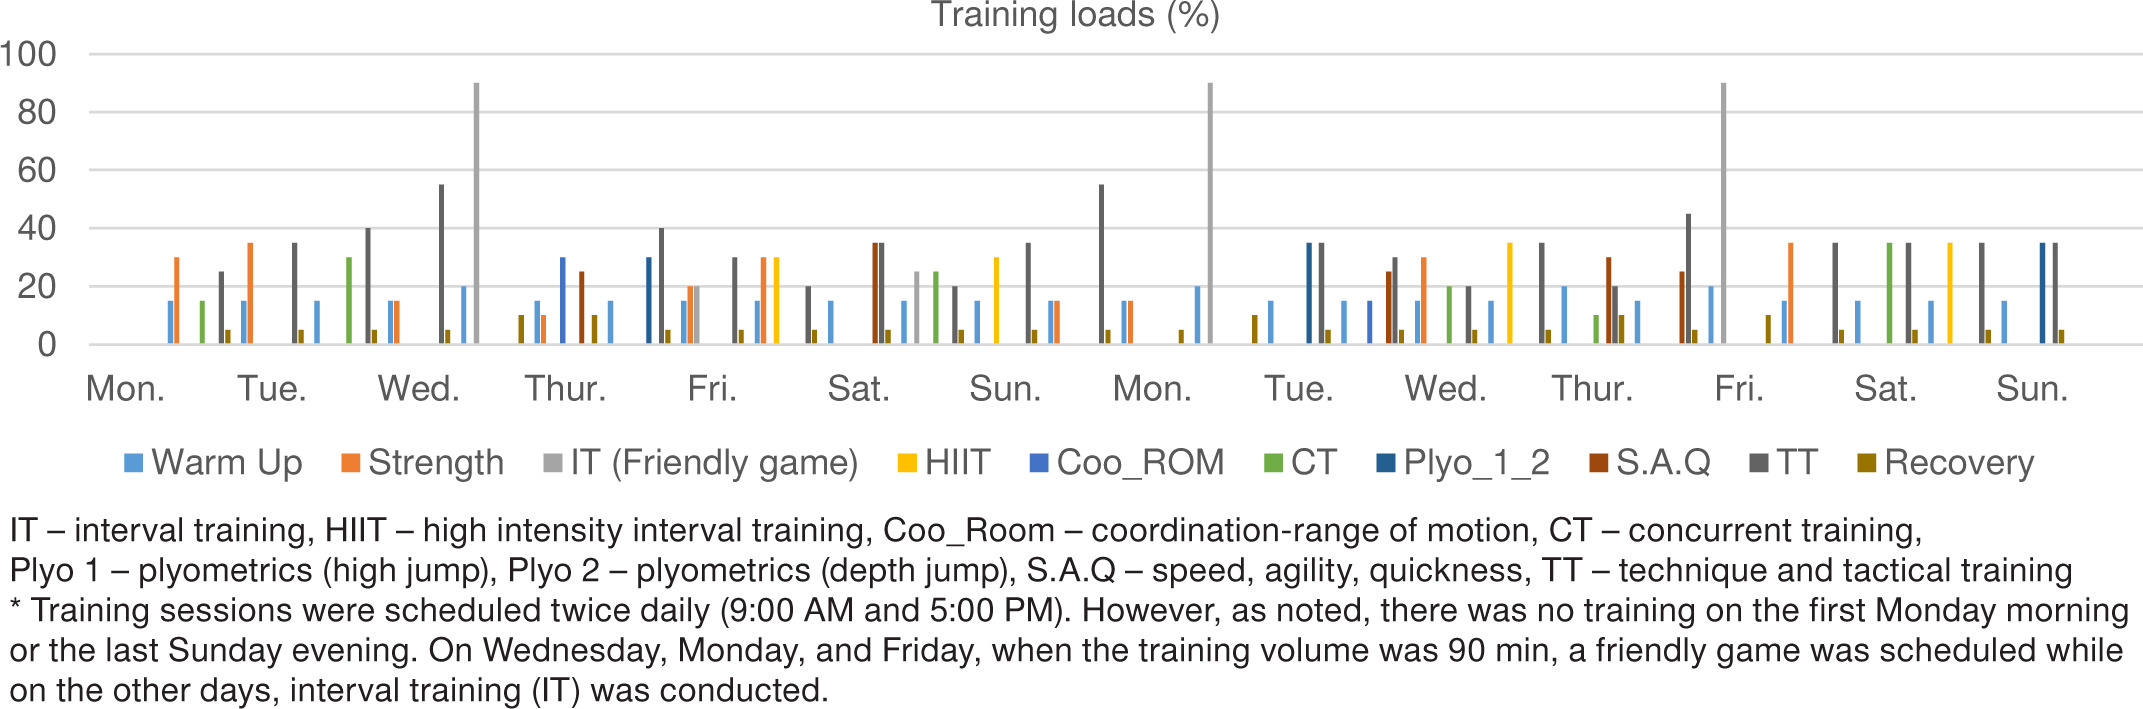
Preparatory phase (Figure 2): Training loads were distributed across various motor abilities and conducted twice daily. High-intensity interval training (HIIT) and heavy strength training sessions included a 72-hour rest phase, while interval training (IT), range of motion (ROM), concurrent training (CT), and speed, agility, and quickness (S.A.Q) training were performed with 28–42 h of rest. Plyometric training involved 120–140 contacts per session, with 48–72 h of recovery [21–23].
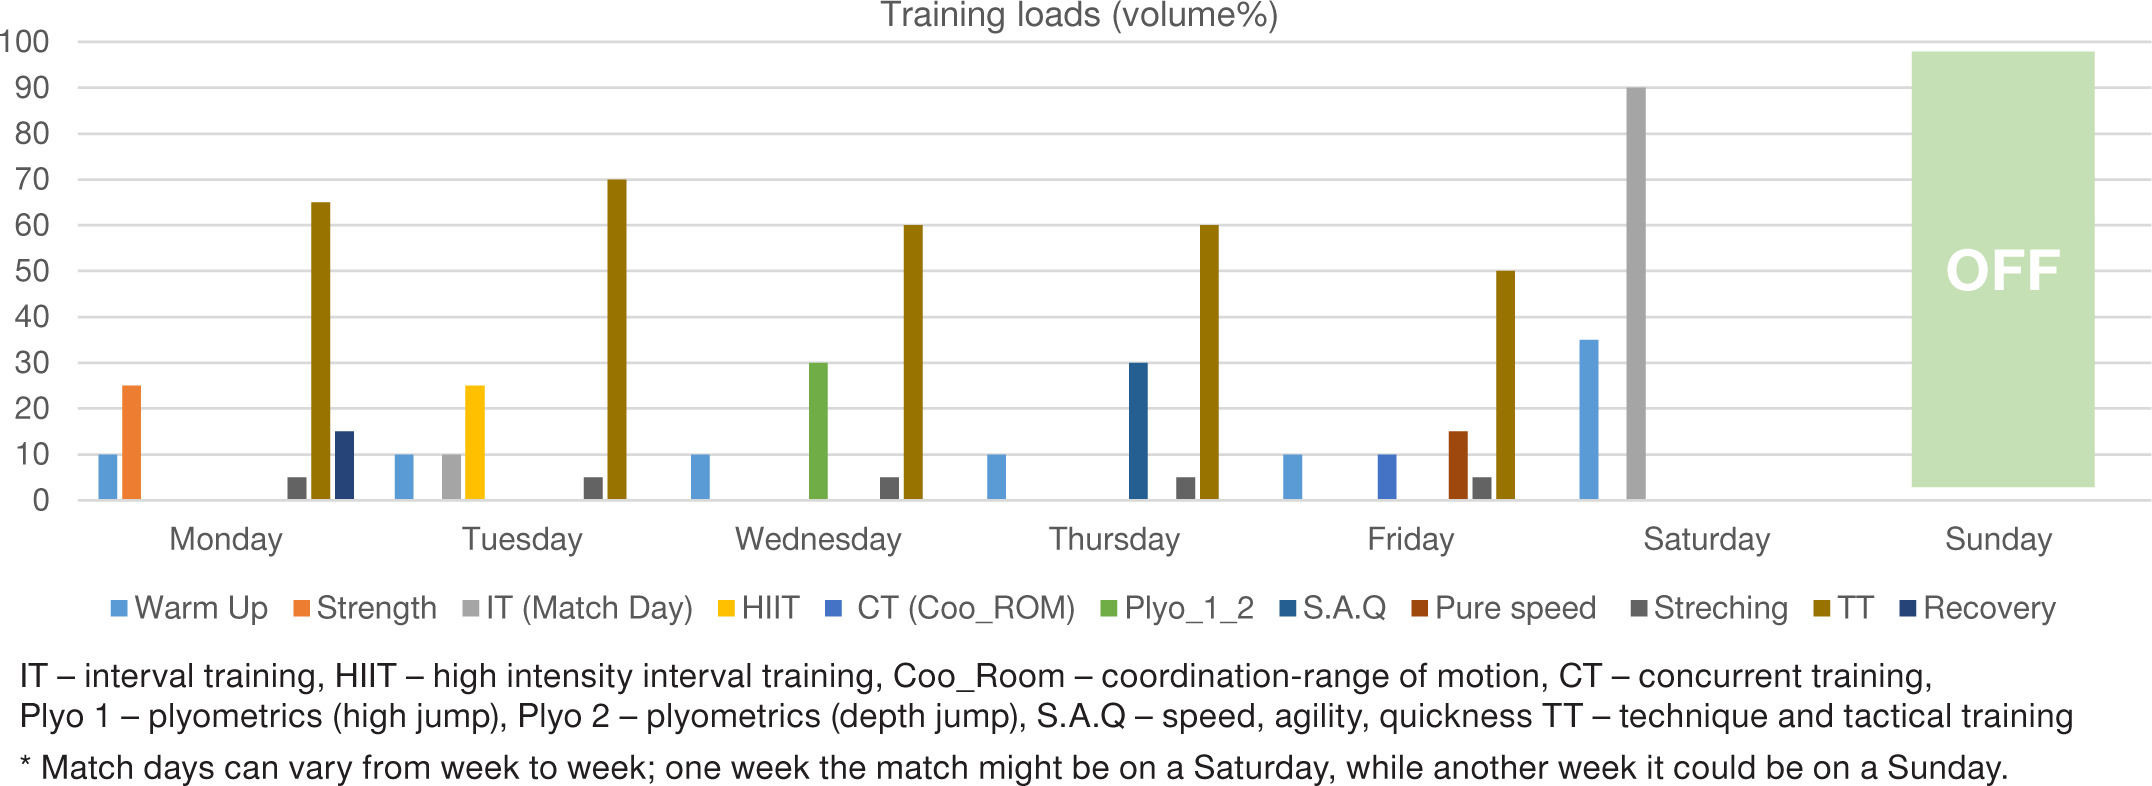
Competition phase (Figure 3): Training sessions were held once daily, with strength training scheduled after matches and during recovery days. HIIT was performed at least 72 h before matches, while plyometric training took place 2–3 days before. S.A.Q and pure speed training were scheduled 1–2 days before matches, with power-based activity (15–20 jumps and runs of < 10 m) on the day before the match. This weekly cycle was repeated throughout all competition phases, except for the weeks in which two matches were scheduled. During those weeks, the training plan focused on recovery from the previous match and preparation for the upcoming one, which led to the cancellation of the usual weekly routine.
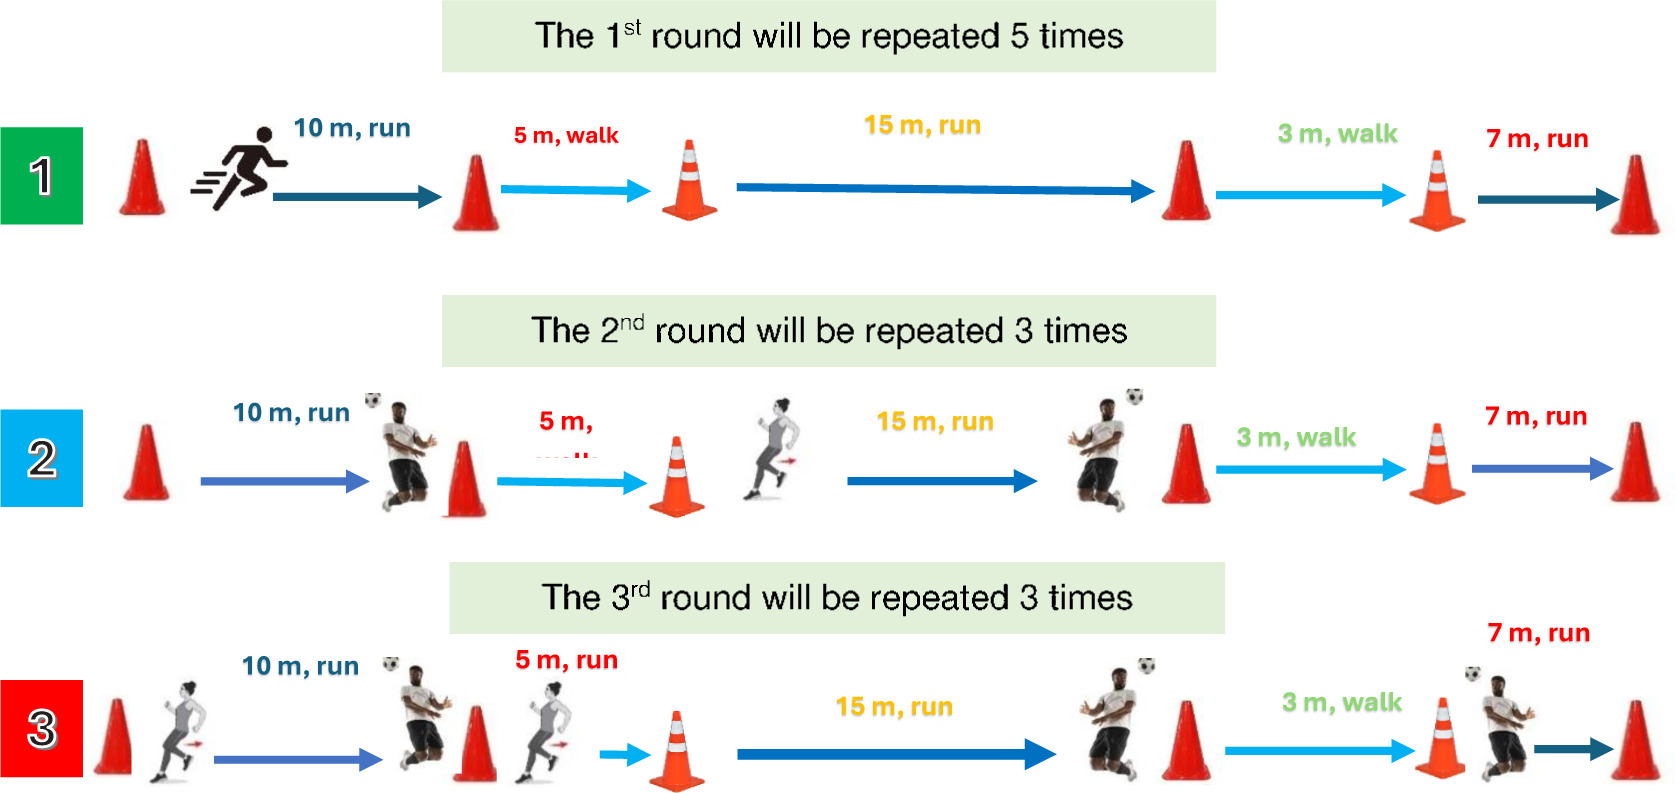
Mid-season active rest phase
The training plan shown in Figure 4 was provided to the players for implementation during the transition phase, which was intended to be an active rest period. However, no specific monitoring took place, and the plan was applied on a voluntary basis.
Data analysis
Data analysis was conducted using SPSS version 26. Normality was assessed using the Shapiro–Wilk test (p > 0.05), allowing for parametric analyses. A OneWay repeated Measures ANOVA was used to evaluate the effects of preparatory and competitive phases on specific endurance. Effect size was calculated using the formula: ES = (x_posttest – x_pretest) / SD_pretest [20].
VO2max was estimated using the Yo-Yo recovery-Level 1 test equation which is explained in “VO2max estimation” explanation [19].
The relationship between Yo-Yo recovery-Level 1, VO2max, and body composition was assessed using Pearson correlation. Seasonal test data were aggregated for each variable before correlation analysis, providing a comprehensive view of the relationships across the season.
Results
Figure 5 depicts the changes in endurance levels from the beginning to the end of the season. The performance measurements are illustrated based in time-line of season which is determined by Kosovo football Federation [17].
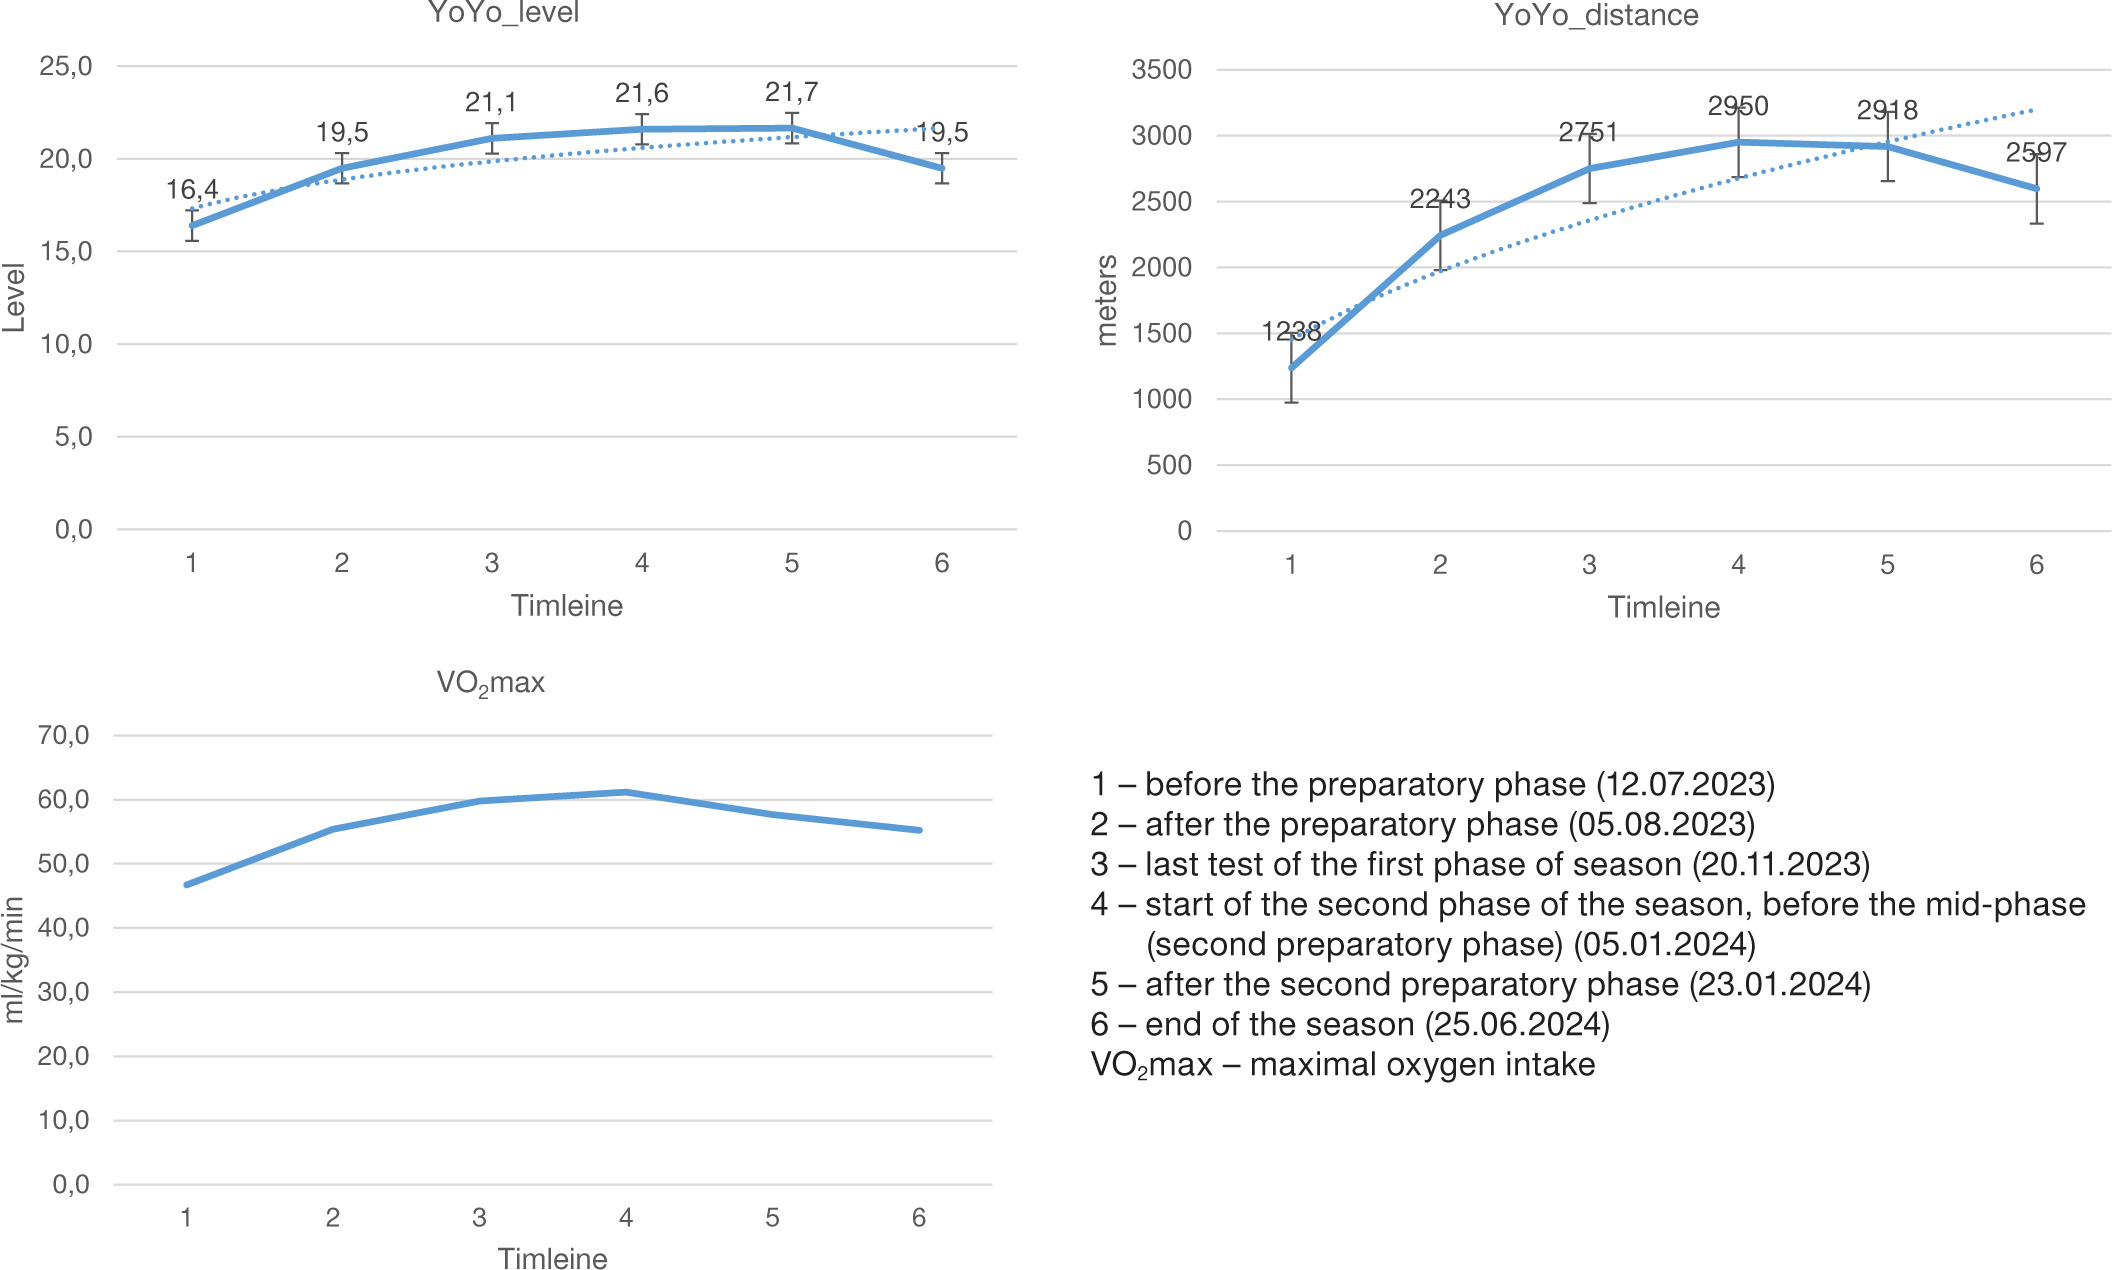
Table 1
Differences between Yo-Yo recovery-Level 1 tests during the first preparatory phase
| Variable | Phase | Mean ± SD | Phases (mean diff.) | η2 | Sig.b* | ES |
| Yo-Yo | 1 2 | 16.38 ± 0.45 19.48 ± 1.20 | –3.10 | 0.898 | 0.000 | 1.6 |
| VO2max | 1 2 | 46.53 ± 0.27 55.60 ± 0.88 | –8.44 | 0.899 | 0.001 | 5.5 |
Table 2
Differences between Yo-Yo recovery-Level 1 tests during the first competition phase
| Variable | Phase | Mean ± SD | Phases (mean diff.) | η2 | Sig.b* | ES |
| Yo-Yo | 2 3 | 19.48 ± 1.20 21.10 ± 1.17 | –4.26 | 0.687 | 0.000 | 0.9 |
| VO2max | 2 3 | 55.60 ± 0.88 59.25 ± 0.88 | –4.26 | 0.669 | 0.001 | –0.02 |
[ii] 2 – after the preparatory phase (05.08.2023), 3 – last test of the first phase of season (20.11.2023)
Endurance performance
The first preparatory phase (Table 1) had a significant impact on endurance, with the Yo-Yo recovery-Level 1 tests showing a highly significant increase (p < 0.05, effect size = 1.6). VO2max also demonstrated a significant improvement during this phase (p < 0.05, effect size = 5.5). Table 1 shows the differences between Yo-Yo recovery-Level 1 tests during the first preparatory phase, whereas Table 2 shows the same data during the first competition phase.
During the first competition phase (Table 2), the Yo-Yo recovery-Level 1 tests level further increased significantly (p < 0.05, effect size = 0.9). However, VO2max showed negligible changes, which were not statistically significant (p > 0.05, effect size = –0.2).
Table 3
The effect of the mid-season rest phase on the specific endurance measured by Yo-Yo recovery-Level 1 test
| Variable | Phase | Mean ± SD | Phases (mean diff.) | η2 | Sigb* | ES |
| Yo-Yo | 3 4 | 21.10 ± 1.17 21.60 ± 1.13 | –0.49 | 0.204 | 0.596 | 1.1 |
| VO2max | 3 4 | 59.25 ± 0.88 60.05 ± 0.73 | –0.80 | 0.254 | 1.000 | 1.3 |
Table 4
Differences between Yo-Yo recovery-Level 1 tests during the second preparatory phase
| Variable | Phase | Mean ± SD | Phases (mean diff.) | η2 | Sig.b* | ES |
| Yo-Yo | 4 5 | 21.60 ± 1.13 21.65 ± 1.93 | –0.05 | 0.898 | 1.000 | 0.2 |
| VO2max | 4 5 | 60.05 ± 0.73 57.09 ± 1.54 | 3.67 | 0.298 | 0.158 | 0.4 |
Table 5
Differences between Yo-Yo recovery-Level 1 tests during the second competition phase
| Variable | Phase | Mean ± SD | Phases (mean diff.) | η2 | Sig.b* | ES |
| Yo-Yo | 5 6 | 21.65 ± 1.93 19.48 ± 1.37 | 2.17 | 0.563 | 0.001 | –0.8 |
| VO2max | 5 6 | 57.09 ± 1.54 54.29 ± 1.08 | 2.80 | 0.291 | 0.466 | –0.6 |
The mid-season rest phase did not result (Table 3) in statistically significant changes for either the Yo-Yo recovery-Level 1 test (p > 0.05, effect size = 1.1) or VO2max (p > 0.05, effect size = 1.3). While moderate effect sizes were observed, no substantial improvements were detected (Table 3).
The second preparatory phase showed (Table 4) no statistically significant effects on the Yo-Yo recovery-Level 1 test (p > 0.05, effect size = –0.2) or VO2max (p > 0.05, effect size = –0.4). Minor performance declines were observed, but the changes were not significant.
The second competition phase showed (Table 5) no statistically significant effects on the Yo-Yo recovery-Level 1 test (p > 0.05, effect size = –0.8) or VO2max (p > 0.05, effect size = –0.6). Minor performance declines were observed, but the changes were not significant.
Body composition
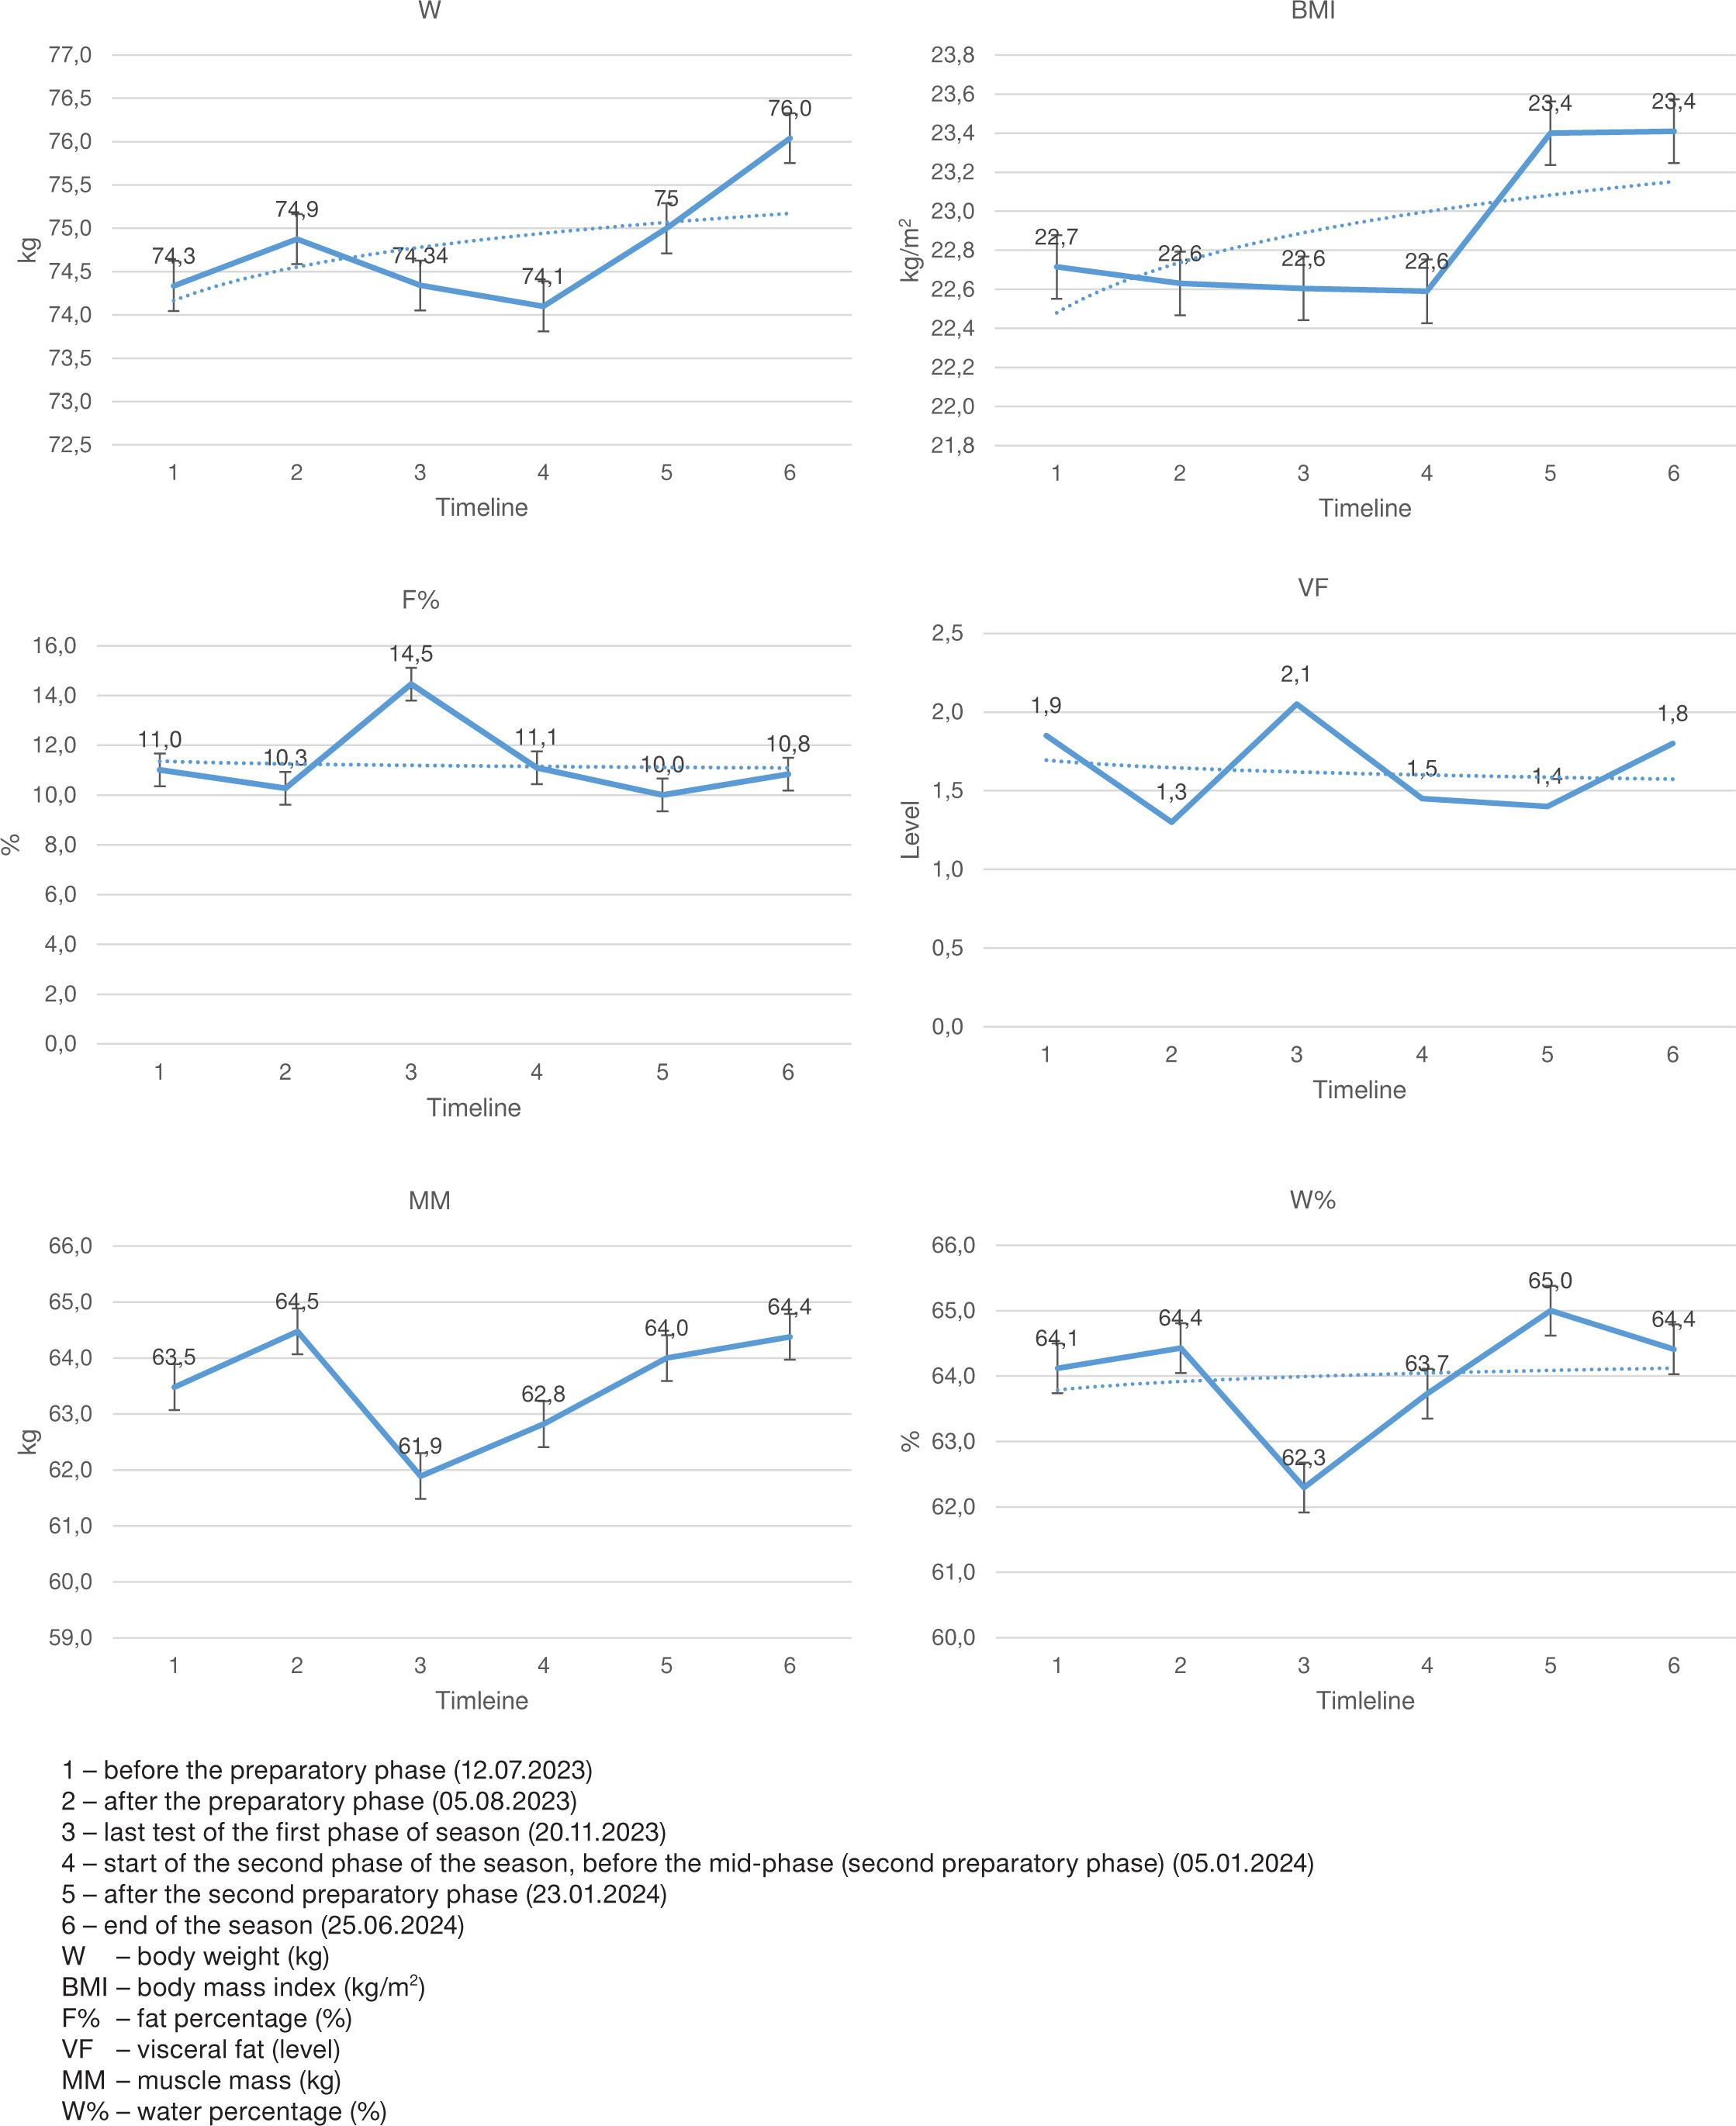
Changes in body composition were tracked at the same time points as endurance measurements (Figure 6). Significant negative correlations were found between endurance metrics (Yo-Yo test, VO2max) and weight, BMI, fat percentage, and muscle mass (p < 0.05). In contrast, total body water exhibited significant positive correlations with both the Yo-Yo recovery-Level 1 test and VO2max (p < 0.05). Visceral fat showed a non-significant negative correlation with these metrics (p > 0.05).
Table 6
Correlations between specific endurance and VO2max measured through Yo-Yo recovery-Level 1 test and body composition features
Table 6 shows that higher fat, weight, and BMI are linked to lower Yo-Yo test and VO2max scores, while higher body water is associated with better performance; visceral fat showed no significant effect.
Discussion
This study highlights the significant impact of the first preparatory phase on both general and specific endurance, as demonstrated by substantial improvements in the Yo-Yo recovery-Level 1 test and estimated VO2max, with high effect sizes. These findings align with prior research by Lesinski et al. [24], who reported that training volume peaks during the preparatory phase compared to the competition phases, contributing to greater performance gains during this phase.
The pronounced improvements during the first preparatory phase can be attributed to appropriate training loads and the players’ relatively low baseline performance levels, which created greater potential for improvement. The athletes with lower initial performance metrics exhibit more significant progress due to a larger margin for improvement. Conversely, the second preparatory phase showed smaller effect sizes, likely because players had already reached higher performance levels approaching elite standards, limiting further gains. Similarly, Fransson et al. [25], demonstrated that high-intensity interval training (HIIT) is particularly beneficial for athletes with lower baseline fitness levels, enabling greater performance improvements.
The mid-season rest phase did not negatively impact physical performance, likely due to individualized active recovery programs implemented during this time. These programs, including short HIIT sessions with multidirectional running and jumps, maintained conditioning and facilitated super-compensation. These findings align with studies by Lesinski et al. [24], Dellal et al. [26], and Buchheit and Laursen [27], who reported that structured rest phases with active recovery can sustain or even enhance performance. Issurin [28], also emphasized that short, high-intensity recovery exercises optimize super-compensation and maintain performance during extended breaks.
Performance during the competitive phases was marked by marginal improvements or maintenance of endurance levels, as observed in the first competition phase. However, further gains during the second competition phase were limited, reflecting the challenge of achieving significant improvements at higher performance levels. Bompa and Haff [29], noted that elite athletes often experience diminishing returns in performance gains during competitive phases, which are also influenced by psychological factors, such as chronic fatigue. In the literature has shown a significant performance improvements across various tests, supporting the idea that while initial phases may see marginal gains, elite athletes like the study group can continue to improve even during competitive phases, despite challenges such as fatigue [30–32]. The high temperatures starting from T5 to T6, following T4, negatively impacted performance. Additionally, the increased number of games (twice per week) due to the Cup competition, along with postponed matches because of the Nations League, contributed to higher levels of fatigue. The shorter recovery times between matches, coupled with limited time for strength and conditioning training, further exacerbated these challenges.
From a body composition perspective, improvements in the Yo-Yo recovery-Level 1 test were associated with gains in body water percentage, while reductions in performance correlated with increases in body fat. These findings are supported by Kahraman and Arslan [33], and Castagna et al. [34], who observed that enhanced intermittent endurance performance is linked to beneficial body composition changes, such as increased muscle mass and reduced fat mass. However, the negative correlation between muscle mass and endurance performance in this study suggests that increased muscle mass without concurrent cardiovascular conditioning may inhibit endurance capabilities. According to existing literature, characteristics of body composition; such as body fat percentage, muscle mass, and overall body mass index; are strongly associated with the performance of various motor skills [35–38].
Interestingly, while VO2max and Yo-Yo recovery-Level 1 tests performance both improved significantly during the initial preparatory phase, the trends diverged in subsequent phases. This discrepancy aligns with findings from Bangsbo et al. [20], who noted that Yo-Yo recovery-Level 1 test performance is a more sensitive indicator of improvements in repeated intense exercise than VO2max. Although VO2max tests are valuable, the Yo-Yo recovery-Level 1 tests provides a cost-effective and time-efficient alternative for assessing performance, as evidenced by its strong correlation with VO2max in prior research [39–41].
Overall, this study reinforces the importance of well-structured training programs during the preparatory phase, active recovery during rest phases, and ongoing monitoring of body composition and endurance metrics. The Yo-Yo recovery-Level 1 test test emerges as a practical and sensitive tool for tracking performance changes, particularly in contexts where laboratory-based VO2max testing is unavailable.
Limitations
In the absence of direct measurements, such as VO2max determined through gas analysis, we utilized estimated VO2max values derived from the Yo-Yo recovery-Level 1 test.
In the absence of GPs and heart rate monitoring, training loads were determined using volume as the primary training variable, rather than intensity.
Conclusions
The findings demonstrate that the first preparatory phase had the most significant impact on performance, with substantial improvements in both the Yo-Yo recovery-Level 1 tests and VO2max. These gains can be attributed to the players’ initially low baseline performance levels, which allowed for more pronounced progress. In contrast, the second preparatory phase exhibited a smaller effect, likely due to the elevated performance levels achieved by mid-season, resulting in a plateau. The first competitive phase was marked by modest improvements and performance maintenance, while the second competitive phase primarily involved performance stabilization, with occasional declines.
Body composition analysis revealed that increases in body fat negatively impacted endurance, emphasizing the detrimental effects of higher fat levels on performance. Conversely, increased body water content, often associated with improved hydration and muscle function, was positively correlated with endurance. Interestingly, the negative correlation between muscle mass and endurance suggests that, without concurrent improvements in cardiovascular conditioning, greater muscle mass may hinder endurance capabilities. While visceral fat showed a weak negative relationship with endurance performance, this association did not reach statistical significance.
The study also highlighted some misalignment between Yo-Yo recovery-Level 1 tests performance and VO2max, despite VO2max being derived from Yo-Yo recovery-Level 1 tests distances. While VO2max showed significant early improvements, these gains were not consistently reflected in later Yo-Yo recovery-Level 1 tests results. Nevertheless, the Yo-Yo recovery-Level 1 test remains a valuable tool for estimating VO2max, offering a practical, cost-effective, and efficient alternative to laboratory-based VO2max testing. Additionally, the sensitivity of the Yo-Yo recovery-Level 1 tests to track changes in repeated intense exercise performance makes it an essential tool for monitoring athletic progress throughout a season.
In summary, this study emphasizes the importance of structured training during the preparatory phase, active recovery to sustain performance during rest phases, and the careful management of body composition to optimize endurance. The results also reinforce the practicality of the Yo-Yo recovery-Level 1 tests as a reliable method for performance monitoring, particularly in applied settings where laboratory testing is not feasible.