Introduction
Adolescence is marked by wide inter-individual variability in the tempo and timing of biological maturation, which can confound the interpretation of growth, fitness, and sport performance when only chronological age is considered [1]. Peak height velocity (PHV) is a central somatic landmark of pubertal growth and serves as a practical anchor for indexing biological age in youth populations [2]. In girls, menarche typically occurs in the latter part of puberty, approximately one year after PHV, linking menstrual timing closely to the maturation of the growth spurt [3]. Over recent decades, multiple populations have shown secular shifts toward earlier pubertal onset, underscoring the need to contextualise maturational status when evaluating youth health and performance [4]. Evidence from Portugal likewise indicates a continued decline in age at menarche, reinforcing the relevance of regional data when benchmarking maturational timing [5].
Field-friendly estimation of maturity status often relies on anthropometric prediction of ‘maturity offset’ (years from PHV), most prominently via the equation proposed by Mirwald et al. [6]. Subsequent work has refined these approaches, including simplified or enhanced models intended to improve accuracy and usability across settings [7]. Nonetheless, validation studies highlight systematic biases – such as dependency on body size and chronological age – and reduced variability relative to observed measures, cautioning against uncritical application at the individual level [8]. Longitudinal analyses in Portuguese youth soccer further demonstrate that predicted ages at PHV can diverge from observed values in ways that vary by maturity timing, with early and late maturers especially prone to misclassification [9]. Contemporary reviews therefore recommend triangulating maturity estimates and reporting uncertainty when predictions inform research or practice in youth sport [10].
Against this backdrop, muscular strength is a key outcome in youth, and common field or laboratory measures – such as the isometric mid-thigh pull (IMTP) and handgrip strength – show good reliability in adolescent samples, including female athletes [11]. Biological maturation is positively associated with strength and power characteristics in adolescents, emphasising the importance of accounting for maturity when interpreting performance [12]. Moreover, maturity status often explains more variance in speed and power than relative age per se, illustrating the need for biologically anchored comparisons [13]. Because absolute strength scales with body size, normalising strength to body mass can yield distinct inferences into functional capacity and health risk, making relative metrics an informative complement to absolute values [14]. In applied talent pathways, maturity-informed strategies (e.g., bio-banding or maturity-based corrections) are increasingly advocated to mitigate selection bias and support equitable development [15].
Aerobic capacity represents another key component of youth fitness, underpinning both health and sport performance [16]. Field-based protocols, such as the 3-minute step test, offer a practical and low-cost means of estimating cardiorespiratory fitness in adolescents and have shown acceptable validity and reproducibility in school and athletic settings [17]. Biological maturation is known to influence aerobic performance, with earlier maturing youth often displaying higher absolute values, partly due to body size and haemoglobin concentration [18]. Accordingly, evaluating aerobic capacity alongside strength measures, while accounting for maturity status, provides a more comprehensive profile of functional development in adolescent girls.
Accordingly, this study aimed to: (i) characterise the distribution of age at menarche in a cohort of Portuguese girls and examine intergenerational patterns by comparing daughters and their mothers, given evidence that maternal–daughter menarcheal timing is correlated yet shifting across generations [19]; (ii) compare physical fitness between pre- and post-PHV groups using both absolute and body-mass-standardised strength measures, leveraging established, reliable assessments relevant to youth athletes [20]; and (iii) quantify the associations between maturity offset and anthropometric and fitness variables, and explore sport-specific differences to clarify how maturation relates to performance profiles in real-world youth settings [21].
Material and methods
Study design
This study followed a cross-sectional design. Data were collected in a single session, during which physical fitness, anthropometric characteristics, and self-reported menarcheal age were assessed. Additionally, maternal age at menarche was obtained through a questionnaire completed by the participants with their mothers.
Participants
Seventy-one girls participated in this study. The inclusion criteria were: (i) being female, (ii) aged between 10 and 13 years, (iii) having already experienced menarche, and (iv) not presenting any injury that could prevent the completion of the physical tests. Exclusion criteria were: (i) being male, (ii) not having yet experienced menarche, and (iii) being younger than 10 or older than 13 years. It should be noted that not all data were collected for the entire sample, particularly the questionnaires completed by the participants’ mothers.
Prior to the start of the study, participants were informed about the study’s objectives, design, potential risks, and benefits. Subsequently, they provided written informed consent, which included details regarding data protection and their right to withdraw from the study at any time.
Procedures
Girls who had already experienced menarche were invited to participate in the study. Data collection began with the administration of a questionnaire to obtain information regarding the participants’ and their mothers’ age at menarche. Subsequently, the physical assessment was conducted in the following order: (i) demographic information (e.g., sex, birth date, type of sport participation, level of physical activity, age of menarche, if applicable); (ii) anthropometric measurements (standing height, body mass, sitting height); and (iii) physical fitness assessment (handgrip strength, isometric mid-thigh pull strength, and aerobic capacity as measured by a step test). Prior to the physical fitness assessment, all participants completed a stand-ardised warm-up protocol consisting of 5 min of jogging followed by 5 min of dynamic stretching for the upper and lower limbs.
Anthropometric measurements
Measurements were taken in a suitable room, with participants dressed in light clothing and barefoot. Standing height and sitting height were measured to the nearest 0.1 cm using a portable stadiometer (Seca 213, Hamburg, Germany). To measure standing height with a stadiometer, participants stood upright with their heels together, back straight, and head level in the Frankfurt Plane. To measure sitting height, participants sat on a flat, hard surface with their back straight, feet flat on the floor, and knees at a 90-degree angle. The stadiometer’s headpiece was positioned to touch the top of the head, ensuring it remained level, and then the height measurement was read from the scale at eye level. Leg length was then calculated as the difference between standing height and sitting height (Leg length = Stature – Sitting height), following the procedure described by Mirwald et al. [6]. Body mass was recorded to the nearest 0.1 kg using a bioimpedance scale (model BC-545N, TANITA). Waist circumference was measured using a flexible tape measure at the midpoint between the lower margin of the last palpable rib and the top of the iliac crest. The average of two measurements was used for all variables.
Predicted age of peak high velocity
The following variables were included in the equation to estimate age at peak height velocity (PHV): chronological age (age in years until the date of assessment), weight (body mass), height, sitting height, and leg length. The equation used was: –9.236 + (0.0002708 × leg length and sitting height interaction) – (0.001663 × age and leg length interaction) + (0.007216 × age and sitting height interaction) + (0.02292 × weight by height ratio). This formula, as validated by Mirwald et al. [6], showed a Pearson correlation coefficient of 0.94 (an R2 of 0.89) and a standard error of 0.57. The real years since menarche were calculated by subtracting the age at menarche from the chronological age, while the predicted years since menarche were estimated as the maturity offset minus one year.
Handgrip strength test
To measure handgrip strength, participants were seated comfortably with their elbow flexed at a 90-degree angle and their forearm in a neutral position. Using a calibrated hydraulic handgrip dynamometer (Jamar), with the grip span adjusted to fit the participant’s hand size, they were instructed to squeeze the dynamometer with maximum effort for 3 s while keeping their wrist straight and avoiding any arm movement. After a warm-up and an uncounted trial, participants completed two consecutive trials, with a 3-minute rest between each attempt to prevent fatigue. This procedure was repeated for each hand. The highest value from these trials (measured in kg) was recorded for further data analysis.
Isometric mid-thigh pull (IMTP) test
During IMTP testing, participants were positioned in a standardised power-pulling stance based on previous recommendations (130–140° for the knee angle and 145° for the hip angle) [22]. The grip height was adjusted to half the length between the greater trochanter and the lateral epicondyle of the knee, with a goniometer used to ensure precise alignment within acceptable ranges [23]. Participants were instructed to exert maximal force on the grip for three seconds, with an emphasis on explosive upward movement. The tests were conducted using a Back-leg-chest dynamometer (BLC Dynamometer). Participants were allowed two trials, with a 3-minute rest between them. An initial trial, which was not included in the final analysis, was used for familiarisation and to ensure proper technique. The maximal force (kg) was calculated from the two trials performed and served as the basis for subsequent data analysis.
Aerobic capacity
Cardiorespiratory fitness was analysed using the 3-min Kasch Pulse Recovery Test (KPR Test) [17]. This test involved stepping up and down on a 0.305-metre step at a pace of 24 steps per minute. A metronome was used to keep the stepping rate consistent at 96 beats per minute, and a heart rate sensor continuously monitored the heart rate (HR) during the 3 min of the test, as well as for 1 min and 5 s of recovery (while seated). Only the HR values recorded 1 min after the test (within 5 s) were included in the subsequent analysis. All HR measurements were taken while the participant was seated, instructed to sit still, breathe normally, and refrain from talking. The arithmetic mean of these results (HRmean post-ex) was the main variable used in further analyses.
Statistical analysis
Data were analysed using Python (version 3.10). Descriptive statistics are presented as means ± standard deviations (SD) and ranges where appropriate. The normality of distributions was assessed with the Shapiro–Wilk test, and homogeneity of variances with the Levene test. Differences in age at menarche between daughters and mothers were examined using a paired-samples t-test, with results expressed as mean difference and 95% confidence intervals (CI). Independent comparisons between maturational groups (pre- vs. post-PHV) were conducted using independent-samples t-tests for normally distributed data or Mann–Whitney U-tests where assumptions were not met. Effect sizes were calculated as Cohen’s d with 95% CI. Both absolute and relative values (standardised to body mass) of the strength measures (handgrip and isometric mid-thigh pull) were analysed. Associations between maturity offset and anthropometric or physical fitness variables were examined using Pearson’s product–moment correlation coefficients, with 95% CI computed via Fish-er’s z transformation. Both absolute and relative strength variables were included. Statistical significance was set at p < 0.05. To assess the validity of predicted menarcheal timing derived from the Mirwald equation, additional analyses were performed. The real years since menarche (chronological age minus age at menarche) were compared with predicted years since menarche (maturity offset – 1 year). Agreement was evaluated using a Bland–Altman analysis (mean bias and 95% limits of agreement) and Lin’s concordance correlation coefficient (CCC). The strength of the association between the predicted and real values was also examined with a Pearson’s correlation coefficient.
Results
Maturity offset and chronological age
Based on the Mirwald equation, girls classified as pre-PHV had negative maturity offset values (mean = –0.58 ± 0.62 years, range: –1.97 to –0.02), indicating that they were on average slightly more than half a year before their predicted PHV. In contrast, post-PHV girls displayed positive values (mean = 1.28 ± 0.91 years, range: 0.08 to 3.33), showing that they were approximately one year beyond PHV. As expected, chronological age was also higher in the post-PHV group (11.82 ± 0.81 years) compared with the pre-PHV group (10.69 ± 0.63 years). Comparisons are presented in Table 1.
Age at menarche
The mean age at menarche among the girls in our sample (n = 68) was 10.87 ± 0.93 years, with values ranging from 7 to 13 years and a median of 11 years. In comparison, the mothers (n = 34) reported a significantly later age at menarche, with a mean of 12.00 ± 1.44 years (range: 9–15 years; median: 12 years). These results suggest a generational decline in the age at menarche, with daughters reaching this maturational milestone approximately one year earlier than their mothers, as observed in Figure 1.
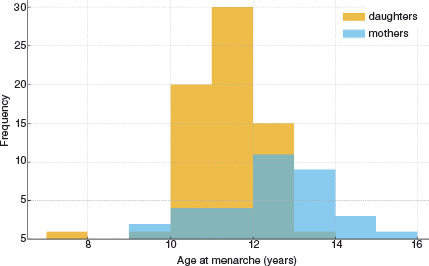
Intergenerational comparison of age at menarche
Among pairs where both daughter and mother reported age at menarche (n = 34), the daughters experienced menarche significantly earlier than their mothers. The mean difference was –1.09 years (95% CI: –1.54 to –0.64; t(33) = –4.93, p < 0.001).
Physical fitness by maturational status
Marked differences in strength-related outcomes were observed between maturational groups. Post-PHV girls displayed substantially higher handgrip strength in both the left (18.18 ± 3.12 vs. 11.83 ± 2.92 kg; Cohen’s d = 2.06, 95% CI: 1.33–2.80) and right (18.86 ± 3.68 vs. 12.74 ± 3.10 kg; Cohen’s d = 1.72, 95% CI: 1.02–2.41) hands. Similarly, the isometric mid-thigh pull was considerably greater in the post-PHV group (63.46 ± 12.54 vs. 45.58 ± 11.93 kg; Cohen’s d = 1.44, 95% CI: 0.77–2.11). In contrast, endurance assessed via the step test did not differ meaningfully between groups (116.80 ± 21.70 vs. 109.70 ± 22.64 beats • min–1;Cohen’s d = 0.32, 95% CI: –0.37–1.02).
When strength outcomes were standardised to body mass, the differences between the pre- and post-PHV groups were attenuated. Relative handgrip remained moderately higher in the post-PHV girls (0.35 ± 0.08 vs. 0.30 ± 0.09 kg/kg; Cohen’s d = 0.67, 95% CI: 0.05– 1.30), whereas relative IMTP showed only a small-to-moderate, non-significant difference (1.20 ± 0.28 vs. 1.07 ± 0.30 kg/kg; Cohen’s d = 0.45, 95% CI: –0.17– 1.07). These findings indicate that biological maturation strongly influences absolute muscle strength, but much of this advantage is explained by increased body size. In contrast, relative strength capacities appear more comparable across maturational groups, while cardio-respiratory endurance remains largely unaffected by maturity status at this stage of development. These comparisons could be observed in Table 2.
Table 2
Physical fitness by maturational status with effect sizes
Correlations between maturity offset and anthropometric/fitness measures
Maturity offset was strongly associated with chronological age (r = 0.85, 95% CI: 0.76–0.91, p < 0.001), height (r = 0.75, 95% CI: 0.62–0.85, p < 0.001), and sitting height (r = 0.72, 95% CI: 0.56–0.82, p < 0.001). Moderate associations were observed with weight (r = 0.59, 95% CI: 0.39–0.74, p < 0.001), leg length (r = 0.41, 95% CI: 0.17–0.60, p = 0.001), and waist circumference (r = 0.38, 95% CI: 0.13–0.58, p = 0.004).
Regarding physical fitness, strong correlations were observed between maturity offset and handgrip strength (left: r = 0.82, 95% CI: 0.70–0.89; right: r = 0.73, 95% CI: 0.58–0.83; both p < 0.001). Isometric mid-thigh pull also showed a moderate correlation (r = 0.61, 95% CI: 0.42–0.75, p < 0.001). In contrast, neither body fat percentage (r = 0.13, 95% CI: –0.13–0.38, p = 0.33) nor step test performance (r = 0.13, 95% CI: –0.15–0.39, p = 0.38) were significantly related to maturity offset (Table 3).
Table 3
Correlations between maturity offset (Mirwald) and anthropometry/physical fitness
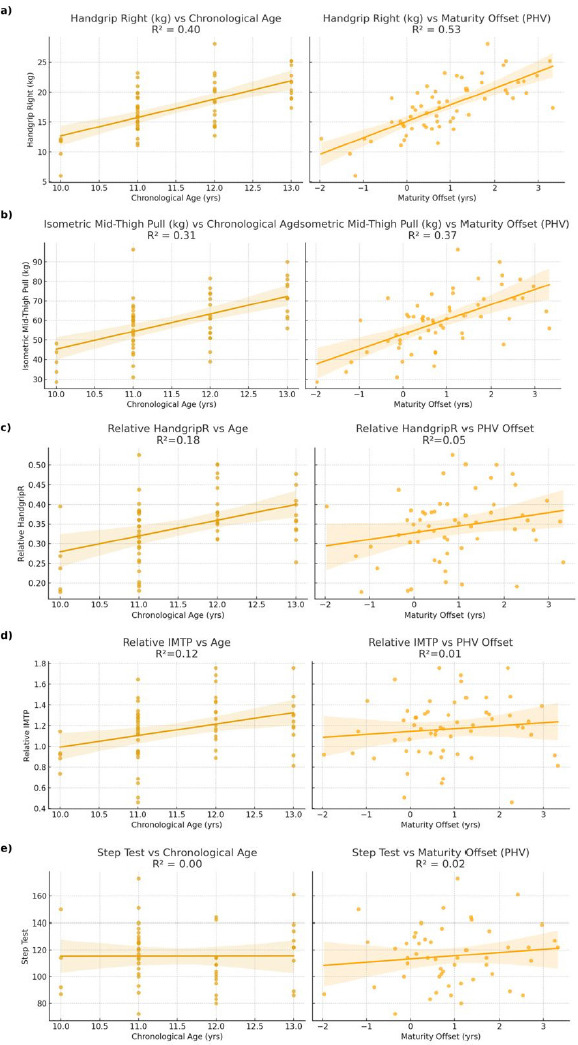
When strength values were standardised to body mass, associations with maturity offset were no longer significant. Relative handgrip strength showed only a weak correlation (r = 0.23, 95% CI: –0.03–0.47, p = 0.08), while relative IMTP was essentially unrelated (r = 0.11, 95% CI: –0.15–0.35, p = 0.39). These findings highlight that the strong influence of biological maturity on absolute muscle strength is largely mediated by increases in body size. In contrast, relative strength capacities and endurance performance appear less dependent on maturational status at this age (Figure 2).
Figure 2
Comparison between chronological age (left side) and maturity offset (right side) in:
(a) handgrip right (kg)
(b) isometric mid-tight pull (kg)
(c) relative strength in handgrip right
(d) relative strength in isometric mid-tight pull
(e) step test
IMTP – isometric mid-thigh pull PHV – peak high velocity
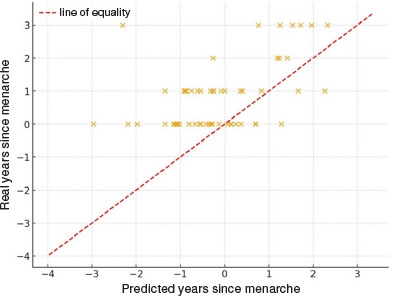
Comparison between predicted and real years since menarche
To further examine the validity of the maturity offset prediction, we compared the real time elapsed since menarche (chronological age – age at menarche) with the predicted value obtained from the Mirwald equation, assuming that menarche occurs approximately one year after PHV. In the subsample with available data (n = 55), the real values were on average 0.94 ± 1.10 years greater than the predicted ones (range: –1.28 to 5.31 years). As illustrated in Figure 3, most points lay above the line of equality, indicating that the Mirwald-based prediction tends to underestimate the interval since menarche by approximately one year. These discrepancies highlight limitations of applying the maturity offset equation to estimating pubertal timing in this population.
Agreement analysis between predicted and real years since menarche
A Bland–Altman analysis was performed to assess the agreement between real years since menarche and those predicted by the Mirwald equation (menarche assumed to occur 1 year after PHV). The mean bias was +0.94 years, indicating that predicted values systematically underestimated the interval since menarche. The 95% limits of agreement ranged from –1.21 to 3.09 years, showing considerable individual variability. Figure 4 shows that most values lie above the line of equality, reinforcing that the Mirwald equation tends to underestimate the timing of menarche in this sample.
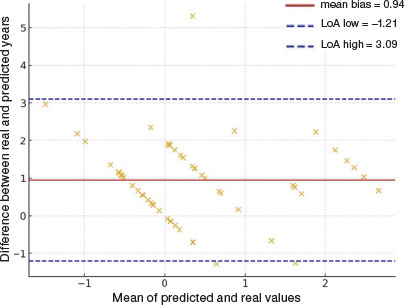
Association and agreement analysis
The predicted and real years since menarche were moderately correlated (r = 0.50, p < 0.001). However, the agreement was weak, as indicated by a Lin’s concordance correlation coefficient of 0.37. This reinforces the Bland–Altman findings, demonstrating that although the predicted values track the general trend of real data, they substantially underestimate the actual interval since menarche and show wide individual variability.
Discussion
This study aimed to assess the age at menarche in Portuguese girls and compare it with their mothers, examine its association with somatic maturity estimated by the Mirwald equation, and characterise physical fitness in pre- and post-pubertal girls. In our sample of pre- and post-PHV Portuguese girls, we found large differences in absolute strength between maturational groups: post-PHV girls markedly outperformed prePHV girls in handgrip and isometric mid-thigh pull. These results align with a growing body of literature demonstrating that biological maturation is a strong determinant of strength and power in adolescent girls. For example, Fonseca et al. [24] reported that Portuguese young basketball players classified by biological age (pre-/mid- vs. post-PHV) show significantly higher performance in strength and power measures in the post-PHV group. Moreover, Retzepis et al. [25] confirm that strength gains are steep during and after PHV, especially in girls. However, when strength was normalised to body mass, the group differences were attenuated: relative handgrip showed only moderate differences, and relative IMTP did not differ significantly. This suggests that much of the absolute strength advantage conferred by post-PHV is mediated by increased body mass. These findings are consistent with previous studies showing that larger body size accounts for a portion of the strength increases in adolescence (e.g., height and weight correlate strongly with strength in maturity offset studies). Such adjustments (relative strength) have been less frequently reported but are vital for understanding functional capacity beyond simple size effects.
Regarding associations, maturity offset correlated very strongly with chronological age, height, and sitting height; moderately with weight, leg length, and waist circumference; but weakly or not at all with percent body fat. Fitness measures, especially absolute hand-grip and IMTP, were strongly correlated with maturity offset, whereas endurance (step test) showed no significant correlation. These findings echo those in Malina et al. [26], who showed that predicted maturity offset increased linearly with chronological age and height, and that its ability to predict performance is greater for strength and power tasks than for endurance or adiposity measures in female athletes. Also, validation work in the Fels Longitudinal Study has shown strong relations of maturity offset with growth and strength variables but also cautions about its limitations in accurately predicting timing and amount of power or strength gain [27].
A novel aspect of our study is the comparison between predicted vs real years since menarche under the assumption that menarche occurs ~1 year after PHV. We found that the Mirwald prediction systematically underestimates the time since menarche by about 0.94 years on average, with wide limits of agreement and a relatively low concordance (Lin’s CCC ~ 0.37). These results indicate that while maturity offset is useful for population trends, it may be less precise for estimating individual maturational landmarks like menarche. Similar discrepancies have been reported in Malina et al. [9], where early and late maturing youth showed larger prediction errors. Furthermore, studies have shown that the timing of PHV and menarche can vary across ethnicities due to genetic, nutritional, and environmental influences, potentially introducing bias when the same equation is used universally. In particular, the assumption that menarche occurs exactly one year after PHV may not apply uniformly to all populations or even to all individuals within the same group. In Portuguese girls, cultural and nutritional factors may also influence the onset and duration of puberty, suggesting that the maturity offset may not fully capture the variability in maturational timing.
It is also important to acknowledge that the small sample size of the pre-PHV group (n = 13), compared with the post-PHV group (n = 45), may have limited the statistical power to detect differences or associations, particularly for variables with greater interindividual variability. This imbalance likely reflects the natural distribution of maturational stages within the studied age range, where most participants had already passed PHV. Nevertheless, the observed large effect sizes in strength-related measures (e.g., Cohen’s d = 1.44–2.06 for IMTP and handgrip) suggest that the maturity-related differences reported are meaningful despite the reduced subgroup size. Future studies with larger and more balanced samples are needed to confirm these findings and refine the interpretation of pre- versus post-PHV comparisons.
From a practical standpoint, these findings carry several implications. First, coaches, health professionals, and researchers should be cautious when using maturity offset to estimate timing of menarche or other puberty markers, particularly at the individual level. Second, reporting both absolute and relative strength measures provides a more nuanced understanding of functional performance, especially to separate size-driven effects from neuromuscular or maturational development. Third, normative data or selection procedures in youth sport might benefit from maturity-adjusted benchmarks, or at least awareness of maturational stage, to avoid disadvantaging late maturers and prematurely favouring early ones. In the context of sports talent identification, integrating maturity assessment alongside performance metrics could help coaches recognise potential in later-maturing girls who may otherwise be overlooked due to transient physical disadvantages. Similarly, in school and health settings, monitoring maturity status can inform tailored interventions to support healthy growth, injury prevention, and equitable participation across maturational stages. These applications highlight the importance of using maturational data not only for research but also for practical decision-making in youth development.
There are limitations to consider. Our cross-sectional design prevents firm conclusions about individual maturational trajectories; longitudinal data would allow more accurate determination of PHV timing as well as the true interval to menarche. The assumption that menarche occurs one year after PHV, while supported in many populations, may not hold uniformly, especially where nutritional, environmental, or genetic factors differ. Also, sample sizes in the subgroup of pre-PHV (for certain tests) were small, reducing the statistical power and precision of estimates. Measurement error in the self-reported age of menarche may also contribute to discrepancies. Finally, the maturity offset equation has known limitations, including ‘regression toward the mean’ and reduced accuracy in early and late maturers. Validation studies like those by Malina et al. [27] and Myburgh et al. [28] show that error increases at the extremes of maturity. Given these constraints, the present results should be interpreted with caution, acknowledging that the Mirwald equation provides a practical but imperfect proxy for biological age, particularly in girls and in ethnically specific contexts.
Conclusions
In conclusion, this study confirms that biological maturation significantly influences absolute strength measures in adolescent girls, though size accounts for much of that advantage. Relative strength and estimates of years since menarche derived from maturity offset show weaker and more variable agreement. Future research should include longitudinal measurements, possibly skeletal age or hormonal markers, to validate prediction models in Portuguese populations, and refine or calibrate maturity offset equations for better individual-level prediction.