
Introduction
Early methods of assessing athlete fitness relied on simple observations by coaches during training. In the early 20th century, Finnish Olympians Hannes Kolehmainen and Paavo Nurmi introduced stopwatch-based tracking to record training times and performance trends [1], marking a pivotal step toward systematic performance measurement. The launch of the first wireless heart rate monitor by Polar Inc. in 1977 further transformed exercise intensity assessment [2], enabling real-time heart rate tracking and deeper physiological insights. Today, wearable devices monitor diverse parameters such as heart rate variability (HRV), blood oxygen saturation, and sleep quality [1, 3], allowing athletes and coaches to fine-tune training and recovery strategies using accurate, real-time data.
Current fitness monitoring integrates advanced sensors and data analytics to evaluate internal and external training loads [1]. These tools enhance performance optimisation, injury prevention, and fatigue management by providing detailed physiological and psychological insights. While the primary advantage lies in delivering actionable feedback that boosts motivation and outcomes, challenges persist in handling complex datasets and ensuring smooth integration into daily routines [1]. In elite sports, structured performance monitoring is essential for achieving peak results. It enables coaches and medical teams to identify strengths and weaknesses, supporting targeted training interventions [4]. Additionally, early detection of fatigue or overtraining helps prevent injuries [5, 6]. Beyond safety, performance data fosters motivation through measurable progress indicators, benefiting both individual athletes and team success [5].
Performance indicators are broadly classified into physiological and non-physiological domains. Physiological metrics include muscle strength, power, endurance, flexibility, speed, agility [7], and body composition [8], all strongly linked to athletic outcomes [9–11]. Fat mass negatively affects speed and agility, whereas muscle mass enhances performance [12, 13]. Non-physical factors, such as technical skills, tactical awareness, and psychological attributes, also play a critical role [14]. Research highlights strong associations between technical–tactical proficiency and performance in sports like tennis and soccer [15, 16], while psychological traits such as self-efficacy and mental resilience significantly influence results [17–19]. Consequently, an integrated approach combining physical, technical, tactical, and psychological elements is widely recommended [20–23], with evidence suggesting that physical fitness underpins improvements in technical and tactical execution [15, 24, 25].
For professional sports organisations, performance metrics are central to contract decisions and strategic planning. In practice, accurate monitoring informs individualised training, nutrition, and recovery programs. Many clubs maintain dedicated fitness laboratories for athlete evaluations, requiring specialised tools and medical expertise. However, wearable devices and fitness apps remain underutilised, and advanced non-invasive, real-time monitoring systems are costly and limited in availability across sports [26]. Prior systematic and scoping reviews typically treat wearable sensors or individual physiological mechanisms in isolation, thereby leaving little integrated synthesis that links these technologies to specific athlete fitness metrics and their physiological indicators. Specifically, this review addresses that gap by schematically mapping the interplay among technologies, fitness parameters, and physiology. It further moves beyond a general overview of wearables to critically evaluate NIRS, while identifying wavelength discrepancies that hinder reliable non-invasive fitness monitoring.
Material and methods
To ensure transparency, the review process is illustrated using a PRISMA 2020 flow diagram (Figure 1). Literature was collected from databases such as ScienceDirect, PubMed, and Google Scholar, focusing on Scopus-indexed articles and reviews published from 2014 onward. Given this review’s specific focus on emerging non-invasive monitoring technologies and wearable sensors, Scopus was prioritised as the primary indexing filter due to its extensive coverage of interdisciplinary research, particularly at the intersection of sports science and biomedical engineering. Keyword selection was based on athlete fitness parameters, which include seven main components: (1) body composition [27]; (2) cardiovascular endurance [28–32]; (3) flexibility [29, 33–37]; (4) speed and agility [36, 38, 39]; (5) reaction time [40]; (6) balance [41]; and (7) strength and power [42]. The search emphasised physiological indicators measurable non-invasively and in real time, such as glucose, lactic acid, VO2max, fat and muscle composition, blood pressure, and heart rate [43]. Among these, glucose, lactic acid, VO2max, and blood pressure showed the strongest association with fitness parameters [44].
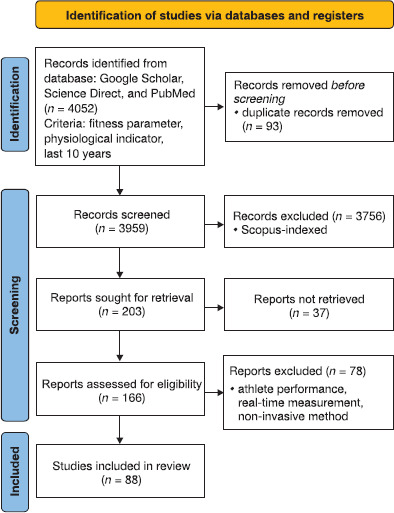
To ensure reproducibility, the search strategy utilised specific Boolean operators combining keywords from three primary clusters. The standardised search string employed was: (“Athlete Fitness” OR “Body Composition” OR “Cardiovascular Endurance” OR “Flexibility” OR “Speed and Agility” OR “Reaction Time” OR “Balance” OR “Strength”) AND (“Physiological Indicator” OR “Glucose” OR “Lactate” OR “VO2max” OR “Heart Rate” OR “Blood Pressure” OR “Muscle Mass”) AND (“Non-invasive” OR “NIRS” OR “Real-time monitoring” OR “Wearable Sensors”). Strictly applied inclusion and exclusion criteria were established to screen the retrieved records. Inclusion criteria were: (1) peer-reviewed articles and reviews indexed in Scopus; (2) published between 2014 and 2024; (3) studies involving human subjects (athletes or healthy active individuals); and (4) research focusing on portable, real-time, non-invasive monitoring methods. Exclusion criteria included: (1) invasive measurement techniques; (2) animal studies; (3) stationary clinical equipment; and (4) articles not available in English. After removing duplicates, abstracts were reviewed for relevance, and full-text articles were retrieved for detailed analysis of monitoring techniques, particularly NIRS. Ultimately, 88 papers covering all seven parameters were included (Table 1). This review does not perform a meta-analysis because it focuses on three interrelated aspects: fitness parameters, physiological indicators, and monitoring techniques.
Table 1
Schematic literature review database
Fitness parameters
The findings are organised into two sections: fitness parameters and monitoring techniques. The first section explains the mechanisms and physiological indicators influencing each parameter, while the second describes non-invasive monitoring methods, whether continuous or discrete. This structure provides a clear link between fitness components and the technologies used to assess them. This review aims to guide developers of non-invasive fitness monitoring systems and inform stakeholders about consumer safety. It highlights physiological indicators most relevant to athlete fitness and identifies measurable, comparable metrics. The insights presented can serve as a foundation for designing monitoring devices and as an analytical reference for evaluating athlete performance.
Body composition
Body composition is a key determinant of athletic fitness, reflecting the proportions of fat, muscle, bone, and body fluids. In sports, maintaining an optimal body composition – characterised by higher muscle mass and lower fat levels – enhances physical performance [45, 46]. Athletes with greater muscle mass and minimal fat typically exhibit superior strength, endurance, and movement efficiency [8, 47–49]. However, it is more generally accepted that lean body mass (LBM), which includes muscle, bone, and other non-fat tissues, is a strong predictor of athletic performance. This is because excess fat can impair performance, while muscle development supports power and stamina, particularly in sports like soccer and running [50, 53]. For soccer players, performance improvements during the preparation phase often coincide with increased muscle mass and reduced fat mass [54, 55].
Muscle mass and fat mass are commonly assessed using metrics such as LBM, fat-free mass (FFM), fat-free mass index (FFMI), and appendicular lean soft tissue index (ALSTI). LBM typically accounts for 70– 90% of body weight, while FFM ranges from 1.8–5.2 kg/m2 in men and 3.9–8.2 kg/m2 in women [8,56]. FFMI benchmarks are 16.7–19.8 kg/m2 for men and 14.6–16.8 kg/m2 for women, whereas ALSTI averages (8.84 ± 0.78) kg/m2 in adult men. The muscle-to-bone ratio (MBR) ranges 12.5–15.5 and 16.5–17.8 in men, and 11.2–15.2 and 16.5–18.2 in women [48, 57, 58]. These indices provide detailed insights into body composition and its impact on performance.
In general, higher muscle mass correlates with improved strength and endurance, while lower fat mass supports agility and energy efficiency. Studies confirm that athletes with favourable body composition outperform those with higher fat percentages across various sports [50–53]. Professional bodybuilders, for instance, demonstrate superior performance compared to amateurs due to optimised LBM and FFM [8, 56]. Unlike other physiological indicators, body composition does not require continuous, real-time monitoring. Periodic assessments, such as pre-season evaluations or post-break measurements, are sufficient for tracking changes. However, regular monitoring throughout the season can reveal significant shifts in muscle and fat mass, which directly influence athletic performance [52].
Cardiovascular endurance
Endurance is a critical determinant of athletic performance, particularly during competitions. It encompasses both physical and mental components, with physical endurance involving cardiovascular, muscular, and aerobic capacities. Physiological indicators strongly influence endurance, especially in long-duration events [59, 60]. Key performance determinants in endurance running include maximal oxygen uptake (VO2max), lactate threshold (LT), and running economy (RE) [61, 62]. VO2max defines the ceiling for aerobic adenosine triphosphate (ATP) production; LT reflects the highest sustainable fraction of that capacity before rapid lactate accumulation; and RE captures the oxygen/energy cost of running at a given submaximal speed. Therefore, durability – the ability to maintain economy, sustain a high fraction of VO2max, and resist threshold deterioration as duration and load accumulate – is a critical performance consideration [63]. While VO2max remains a primary measure of training effectiveness, other markers such as LT and resting heart rate are also valuable [64]. For master athletes (aged 35+), maintaining high-intensity training is essential for preserving endurance performance [65].
VO2max reflects the body’s maximum ability to absorb and utilise oxygen during exercise, serving as a key indicator of aerobic capacity and endurance [66, 67]. Operationally, VO2max is obtained via graded cardiopulmonary exercise testing and verified by a VO2 plateau or supramaximal bout; it is reported in l • min–1 and ml • kg–1 • min–1. Higher VO2max values enhance oxygen transport and utilisation, allowing athletes to sustain high-intensity efforts longer before fatigue sets in. Training status significantly affects VO2max, with elite athletes achieving higher values than untrained individuals [68, 69]. For example, Olympic-level cross-country skiers exhibit averages of 84 ml • min–1 • kg–1 for men and 72 ml • min–1 • kg–1 for women [67]. Competitive cyclists typically record lower averages – 53.81 ml • min–1 • kg–1 for men and 51.74 ml • min–1 • kg–1 for women – though world-class cyclists can reach up to 96.7 ml • min–1 • kg–1 with specialised training [66, 70].
LT marks the intensity at which lactate accumulation exceeds clearance, signalling a shift from aerobic to anaerobic metabolism. This accumulation lowers blood pH due to hydrogen ion release, creating an acidic environment that contributes to muscle fatigue and reduced enzyme activity [71]. LT is widely used to assess aerobic capacity because it correlates with fatigue resistance. A threshold of 4 mmol/l is commonly applied to estimate maximal lactate steady state (MLSS) [72–74], which is often measured after running at 12 km/h [72]. However, its accuracy varies across sports [74,75]. Lactate levels fluctuate with exercise intensity and training status. At rest or during low-intensity activity, levels typically remain below 2 mmol/l [72], while elite sprinters can reach 20–22 mmol/l during high-intensity efforts [76]. These physiological markers – VO2max and LT – are therefore essential for evaluating endurance and guiding training strategies.
Flexibility
Flexibility refers to the ability of muscles and joints to move through their full range of motion without pain or stiffness. For athletes, flexibility enhances movement efficiency, reduces injury risk, and improves overall control during dynamic activities. Poor flexibility can lead to muscle tension and higher susceptibility to injury. Factors influencing flexibility include lactic acid accumulation, which causes stiffness; increased VO2max, which may reduce flexibility; excessive muscle or fat mass limiting mobility; and glucose intake, which supports cognitive flexibility and motor control during intense activity.
Lactic acid plays a significant role in flexibility. Its buildup leads to muscle fatigue and stiffness, reducing range of motion and slowing recovery [77]. When lactic acid exceeds 4 mmol/l, recovery interventions are recommended to prevent performance decline and injury [78]. Similarly, muscle mass affects flexibility. While hypertrophy improves strength, excessive muscle without adequate stretching can restrict motion and elevate injury risk [79]. Increased muscle bulk can alter joint mechanics by limiting the range of motion, which underscores the need for balanced strength and flexibility training. Muscle thickness and passive stiffness are key determinants, with optimal anterior thigh thickness around 39 mm in healthy young males [80, 81]. The effect of muscle mass on flexibility varies by sport – volleyball players showed the highest mobility scores, whereas rugby players exhibited more asymmetrical and dysfunctional movements than volleyball and soccer players – emphasising the need for balanced body composition [82].
Fat mass also influences flexibility. Studies suggest an optimal body mass index (BMI) range of 27– 30 kg/m2 for good mobility [80, 82], while a higher BMI correlates negatively with hamstring flexibility [32]. Federation soccer players generally show better flexibility than non-federation peers, especially in younger athletes [32]. Additionally, glucose intake (~60 g/l) enhances cognitive flexibility and motor responses during high-intensity exercise, supporting focus and decision-making [32, 83]. Post-exercise glucose also aids muscle recovery, helping athletes maintain peak performance.
Speed and agility
Speed refers to the ability to move rapidly over a short duration, while agility is the capacity to change direction and body position quickly and efficiently. Both are critical for professional athletes as they significantly influence performance in sports ranging from sprinting to team-based games. Research identifies four main factors affecting speed and agility: VO2max, muscle mass, glucose–carbohydrate levels, and lactic acid, with lactic acid exerting the most substantial impact.
Studies on VO2max, muscle mass, and glucose levels show mixed results depending on the sport and performance metrics used. Some research reports a positive correlation between VO2max and agility in soccer players [84–87], while others find no significant relationship [88, 89]. Similarly, muscle strength has been linked to sprint performance in some studies [12, 90], but other findings suggest that reducing body fat may influence sprint times more than increasing muscle mass [47]. Lower-body explosive strength, which depends on muscle development, is considered a strong predictor of speed and agility in young soccer players [12].
Lactic acid accumulation during high-intensity activity significantly impairs speed and agility [91]. Blood lactate levels rising from 3 to 5 mmol/l can reduce running speed by up to 5.5% and negatively affect movement efficiency [92]. In handball players, elevated lactate levels also decrease shot speed and disrupt kinematics [84]. These findings underscore the detrimental effect of lactic acid buildup on performance, particularly in sports requiring sprints and rapid directional changes. Overall, while VO2max, muscle mass, and glucose availability contribute to speed and agility, lactic acid remains the most influential factor. Effective training and recovery strategies aimed at managing lactate accumulation are essential for maintaining optimal performance in high-intensity and multidirectional sports.
Reaction time
Reaction time is the period required for an individual to respond to a stimulus after its detection. It acts as a key measure of how quickly and effectively information is processed. Several factors, including physical fitness and age, influence reaction time [93]. For healthy adults, the average reaction time in completing simple tasks is approximately 0.5 s for males and 0.53 s for females [94]. Athletes generally exhibit faster reaction times compared to non-athletes, attributed to their intensive physical and mental training [95].
Blood glucose levels indirectly influence athletes’ reaction times. Optimal glucose levels (100–168 mg/dl) can improve reaction time and athletic performance [96]. Various types of carbohydrates, particularly glucose, can improve cognitive performance during exercise [32]. This is because higher glucose availability increases the speed of information processing. The study by Dupuy and Tremblay [83] indicates that reaction time is significantly affected by carbohydrate consumption, with reaction times improving compared to baseline across all groups consuming carbohydrates, from the initial session through the recovery phase.
Balance and coordination
Balance coordination is the ability to maintain body stability and control movements through the integrated function of the central nervous, musculoskeletal, and vestibular systems. Among the physical indicators, muscle mass is strongly correlated with balance, as it provides structural support and enhances isokinetic strength [56, 97]. Greater muscle mass improves an athlete’s ability to maintain equilibrium, with studies showing that judo athletes possessing higher muscle mass and anaerobic capacity demonstrate superior balance compared to untrained individuals, even under fatigue [98, 99]. Therefore, increasing muscle mass through targeted training, including resistance (strength) training alongside balance/proprioceptive, core stability, and plyometric components, constitutes an effective strategy for improving balance coordination, and overall athletic performance [100].
Trained muscles enhance the body’s ability to perform precise and coordinated movements, contributing significantly to maintaining balance and effectively controlling movements [101]. Strong lowerlimb and trunk muscles help maintain proper posture and balance, especially during challenging tasks (e.g., singleleg stance or rapid directional changes). Muscular conditioning also improves neuromuscular responsiveness to positional changes or external disturbances, thereby enhancing balance and reducing the risk of falls.
Strength and power
Strength is the ability of muscles to generate maximum force in a single effort, such as lifting a heavy weight in one repetition [102]. In contrast, power is the ability of muscles to rapidly generate force, combining strength and speed, as seen in explosive movements like jumping or sprinting [90]. These two elements complement each other and are influential in physical activities and sports. The greater the muscle strength, the higher the potential to enhance power. With appropriate training, individuals can develop both strength and power to achieve optimal performance.
Research consistently shows a strong link between muscle mass and athletic performance, particularly in strength- and power-oriented sports [36, 100, 103]. Athletes with greater muscle mass typically demonstrate superior strength and endurance, which are critical for success across various disciplines [104]. Professional athletes generally exhibit higher muscle mass and greater upper- and lower-body strength compared to amateurs [105]. Hypertrophy-focused training that increases muscle mass or reduces body fat significantly enhances strength and power [105, 106]. In sports like handball, well-developed lower-limb muscles are essential for explosive actions such as jumping and rapid acceleration [107]. However, this relationship can vary by gender, age, and genetic factors, including androgen receptor polymorphisms that influence muscle development [103, 108]. While increased muscle mass generally correlates with improved performance, the optimal level depends on the specific physical demands of each sport [104, 109].
Monitoring techniques
Recent advancements have led to significant growth in non-invasive techniques for monitoring physiological indicators in athletes, showing strong potential for improving training and performance [110]. These methods include wearable sensors that track vital signs, physiological parameters, and biomarkers [111–114], as well as imaging-based approaches like magnetic resonance spectroscopy (MR) and ultrasound (US) for assessing muscle glycogen levels [115]. Non-invasive monitoring techniques can be broadly categorised into four groups: infrared-based, bioelectrical-based, plethysmography-based, and imaging-based, each with diverse developments aimed at achieving accurate and reliable measurements. A detailed comparison of these techniques is presented in Table 2, while schematic representations of each category are shown in Figures 2–6.
Table 2
Comparison of some non-invasive methods for fitness monitoring
Figure 2
Schematic representation of the infrared-based portable device, i.e. NIRS [117], LEDs emit infrared (IR) light into muscle tissues continuously. An infrared light detector then measures how much of this light is scattered by the tissue. The rest of the light is either reflected or absorbed by the surrounding tissues. Adapted from: Papagiouvanni I, Sarafidis P, Theodorakopoulou MP, Sinakos E, Goulis I. Endothelial and microvascular function in liver cirrhosis: an old concept that needs re-evaluation? Ann Gastroenterol. 2022;35(5):471–82; doi: 10.20524/aog.2022.0734. Licensed CC BY-NC-SA 4.0 (see license). Changes: colours modified.
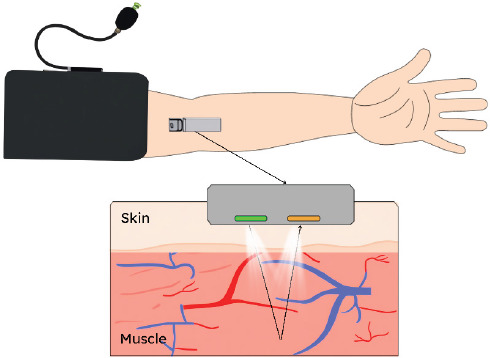
Figure 3
Schematic representation of the bioelectrical-based portable device, i.e. BIA [118], shows a sinusoidal constant current (~800 μA at 50 kHz) flowing between the outer electrodes, while the inner electrodes measure the biological resistance and reactance. Adapted from: Abdel-Mageed SM, Mohamed EI. Total body capacitance for estimating human basal metabolic rate in an Egyptian population. Int J Biomed Sci. 2016;12(1):42–7; doi: 10.59566/IJBS.2016.12042. Licensed CC BY 2.5 (see license). Changes: colours adjusted.
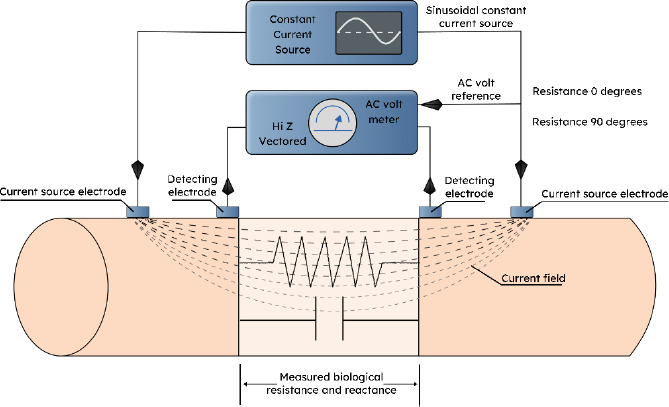
Figure 4
Schematic representation of the bioelectrical-based portable device, i.e. ECG [119], a pair of electrodes installed on the chest, secured with an elastic strap, and using signal recording instruments. Source: Ali B, Cheraghi Bidsorkhi H, D’Aloia AG, Laracca M, Sarto MS. Wearable graphene-based fabric electrodes for enhanced and long-term biosignal detection. Sensors Actuators Rep. 2023;5:100161; doi: 10.1016/j.snr.2023.100161. Licensed CC BY-NC-ND 4.0 (see license). Reproduced unchanged.
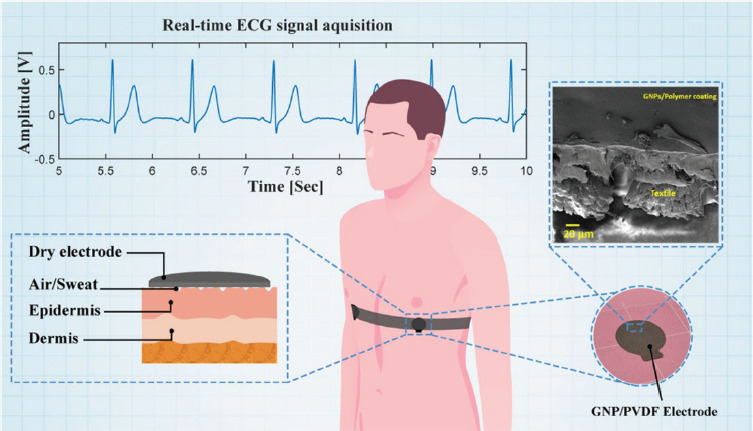
Figure 5
Schematic representation of the plethysmography-based portable device, i.e. PPG, an LED emits light that penetrates the skin and blood vessels, which then reflects back to the photodetector to generate a PPG signal.
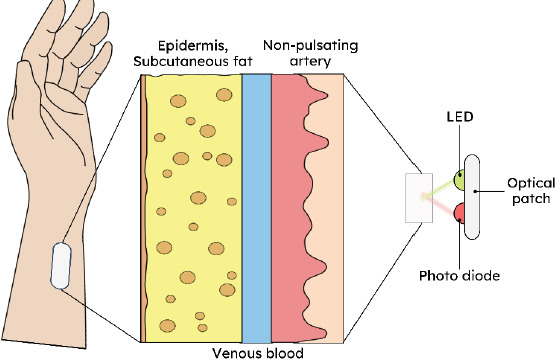
Figure 6
Schematic representation of the imaging-based method, i.e. DEXA/DXA. Two X-ray beams with varying energy levels are aimed at the patient’s bones. The bones’ absorption of each beam is measured, and the difference in absorption between the two beams is used to calculate body composition.
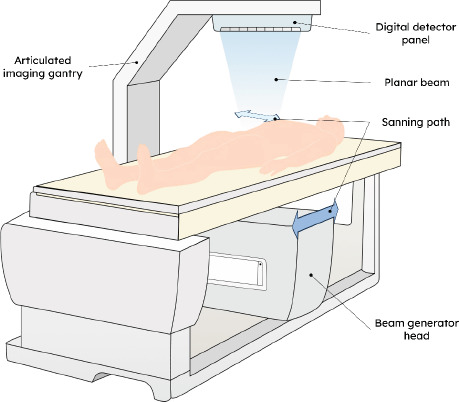
Table 2 and the related figures highlight the potential of NIRS as a non-invasive fitness monitoring method due to its portability and ability to provide continuous, real-time measurements without restricting movement. NIRS can assess aerobic capacity and monitor key indicators such as lactate and glucose levels [71, 119–121]. While this section emphasises NIRS, other non-invasive techniques remain valuable as complementary tools. Ongoing advancements in these technologies offer significant opportunities to optimise training, enhance performance, and support athlete health management [122].
Muscle and fat mass
Non-invasive methods for assessing body composition are increasingly favoured for their practicality and safety. Common techniques include DXA, ADP, USG, and TI [123, 124], while the D3-creatine dilution method offers accurate measurement of total muscle mass [125]. USG has shown comparable accuracy to DXA for predicting lean tissue and skinfold thickness [126, 127], though consistency in using a single method is recommended for longitudinal studies due to accuracy concerns [128]. Advanced approaches such as CT, MRI, US, and bioimpedance analysis now evaluate not only muscle mass but also its quality, with BIA and bio-electrical impedance vector analysis (BIVA) emerging as valuable tools in sports science [129, 130].
VO2max
Several non-invasive methods have been developed to estimate VO2max, a key indicator of cardiovascular fitness. These include seismograph devices that detect chest vibrations from heartbeats [131], wearable systems combining heart rate and accelerometer data [132], and submaximal exercise tests using open-circuit spirometry [133]. NIRS is also widely applied, as it tracks muscle oxygenation in real time and correlates strongly with VO2max and ventilatory threshold [134–137], though its accuracy can be influenced by adipose tissue thickness [138].
NIRS measures oxygen utilisation during exercise by detecting changes in oxygenated and deoxygenated haemoglobin within the 700–1100 nm wavelength range [121, 137, 139]. Specific bands serve different purposes: 700–850 nm for haemoglobin oxygenation, 800–850 nm for tissue oxygenation during high-intensity exercise, and 900–1000 nm for myoglobin oxygenation [121]. These capabilities make NIRS a valuable tool for assessing aerobic capacity and monitoring physiological responses during strenuous activity.
Lactate threshold
LT is a key marker of endurance performance. Recent non-invasive methods for lactate measurement include textile-based colorimetric sweat sensors [140], electromagnetic sensors for interstitial fluid [141] short-wave infrared (SWIR) sensors [142], near-infrared (NIR) with genetic algorithm-based wavelength selection [143], and NIRS. While these techniques show promise, further validation is needed to ensure accuracy and reliability across different athlete populations and exercise intensities [115, 144]. NIRS has demonstrated strong potential for estimating LT, showing a high correlation with traditional blood sampling methods [145, 146]. Wearable NIRS devices enable continuous, real-time monitoring of muscle oxygenation and lactate levels during exercise [141, 147], with studies reporting strong agreement with conventional LT measurements in runners [148]. However, some research, using a sample of 14 recreationally active adults with no formal cycling experience who completed a maximal incremental cycling test, indicates inconsistencies in threshold detection [149].
Specific NIRS wavelength ranges have been identified for lactate monitoring. Baishya et al. [71] reported wavelengths at 1233, 1710, 1750, 2205, 2319, and 2341 nm as indicators of lactic acidosis. The 1700– 1760 nm range is highly sensitive to lactate concentration changes, while 2200–2400 nm detects pH shifts caused by increased H+ ions during lactate accumulation. These spectral changes reflect reduced muscle oxygenation and elevated lactate production [71].
Glucose level
Non-invasive techniques for blood glucose monitoring have attracted attention for reducing the discomfort associated with traditional invasive methods [150]. These include radio frequency and microwave technologies [151], ultrasonic and photoacoustic spectroscopy [152], and optical approaches such as NIRS [153, 154]. Machine learning and chemometric models have also been integrated to improve accuracy [153]. NIRS offers advantages like higher tissue transmittance and faster response times compared to other methods [155], though challenges remain regarding accuracy, reliability, and individual variability [156].
NIRS-based glucose monitoring has shown promising results in athletes, with key wavelength ranges identified: 900–1450 nm (short-wave band), 1450– 1700 nm (first overtone), and 2050–2300 nm (combination band) [157, 158]. Specific wavelengths include 850 nm, 950 nm, 1300 nm [159], 940 nm [160], and 1550–1749 nm [161]. Davison et al. [120] emphasised 900–1700 nm for detecting glucose changes, 1650 nm for C–H bond overtone detection, and 1400–1450 nm for water absorption correction. Combining NIRS with other techniques, such as impedance spectroscopy, has improved accuracy [159], but further optimisation is needed for clinically acceptable performance in health and sports applications [162, 163].
Blood pressure
Recent years have seen major progress in non-invasive blood pressure monitoring for athletes. Wearable devices, such as wrist-based monitors, now enable continuous measurement [164]. Other techniques include ultrasound-based methods, which offer accurate estimates without calibration [165], as well as oscillometry, volume clamp methods, and arterial applanation tonometry [166]. Advances in sensor technology – such as ECG electrodes, PPG sensors, and fibre optics – have further expanded the possibilities for non-invasive monitoring [167]. Among these, NIRS stands out for real-time, continuous blood pressure assessment.
NIRS applications include evaluating skeletal muscle oxygenation and microvascular function [168, 169], estimating blood pressure and detecting iliac artery flow limitations [169, 170], monitoring skin blood flow and mean arterial pressure [171], and analysing postural blood pressure dynamics [172]. Wearable NIRS devices correlate well with complex systems [146], but accuracy can be affected by tissue depth and autoregulation in deeper tissues [173]. NIRS typically operates within 434–731 nm, with 590–630 nm showing abrupt absorption changes [174]. When combined with facial imaging, wideband LEDs (760–1100 nm) enhance tissue penetration and detect facial features linked to blood pressure variations [170]. The 850 nm and 940 nm wavelengths are particularly useful for capturing changes in the nose and lips [170]. The near-infrared region, starting at 780 nm, provides optimal photon penetration, supporting its role in non-invasive physiological monitoring.
Heart rate variability
Recent research has advanced non-invasive methods for measuring HRV, an important indicator of autonomic function and overall health. Techniques include wearable devices using PPG and ECG [175], non-contact video systems like PhysioCam [176], ultra-wideband radar [177], laser Doppler vibrometry [178], facial signal decomposition [179], and ballistocardiography [180]. These approaches have shown promising results for HRV assessment. In sports, elite athletes often display unique HRV patterns, requiring multiple indices for precise monitoring [181]. HRV-guided training and biofeedback using NIRS have demonstrated benefits for performance enhancement [182, 183].
For HRV measurement, wavelengths between 750 and 900 nm provide optimal signals on the forehead [184]. Dual-band NIR, particularly the combination of 799 nm and 861 nm, significantly improves accuracy and reduces motion artifacts by calculating the quotient of the two wavelengths [184]. These advancements position NIRS as a promising non-invasive solution for continuous HRV monitoring in athletic settings.
Discussion
This review elucidates the relationship between physiological indicators and athlete fitness parameters, with a particular emphasis on the non-invasive monitoring methodologies that may potentially be implemented. In fact, there are quite a lot of physiological indicators, but not all of them are directly related to the athlete’s fitness parameters. The relationship between fitness parameters and physiological indicators is quite complicated, as shown through the Venn diagram in Figure 7. There are some physiological indicators that affect several fitness parameters, while some only affect one fitness parameter, as has been described at length in Section 3. For example, HRV and blood pressure only affect cardiovascular endurance, while muscle mass directly affects five fitness parameters, i.e. flexibility, speed and agility, strength and power, body composition, and balance coordination. Meanwhile, there are physiological indicators that directly affect three fitness parameters, namely (1) VO2max which affects cardiovascular endurance and speed/agility; (2) Fat mass which affects body composition and flexibility; and (3) blood glucose/carbohydrate availability which affects reaction time and flexibility. In addition, there is one physiological indicator that has an effect on three fitness parameters, namely lactic acid, which affects cardiovascular endurance, speed–agility, and flexibility.
Figure 7
Correlation between fitness parameters and physiological indicators. The solid border indicates the fitness parameters, and the dashed border indicates the physiological indicators. The darker the physiological indicator, the stronger the influence on the fitness parameter.
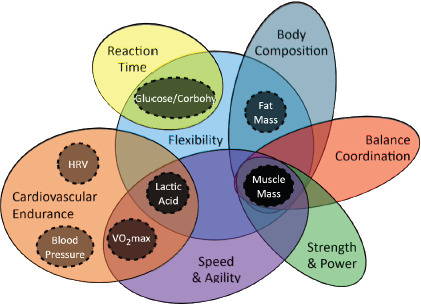
Beyond a simple inventory of links, these intersections reveal a critical hierarchy of physiological influence that informs the design of multi-parametric monitoring systems. Indicators located at the dense intersections of the Venn diagram, specifically muscle mass and lactic acid, emerge as foundational variables. Because these indicators simultaneously underpin multiple fitness domains (e.g., muscle mass influences strength, speed, balance, and flexibility), they are statistically the most suitable candidates for multi-parametric modelling. In contrast, indicators with fewer intersections, such as HRV and blood pressure, serve as specific diagnostics for targeted cardiovascular assessment. Consequently, for the design of future holistic monitoring devices, priority should be given to sensors capable of tracking these foundational variables (high-intersection nodes), as they offer the highest predictive value for overall athletic performance estimation from a minimal number of data points.
Furthermore, the schematic mapping presented in this study offers a blueprint for next-generation device development. By identifying physiological hubs such as muscle mass and lactate that intersect across multiple fitness domains (as shown in Figure 7), this review suggests that future hardware should prioritise these high-impact indicators. Rather than relying on disparate sensors for each parameter, future development should focus on integrating multi-wavelength NIRS arrays capable of simultaneously distinguishing these overlapping biomarkers. This shift from single-parameter tracking to multi-variable sensing integration would make it possible to create comprehensive, real-time fitness profiles that are currently unavailable in consumer-grade devices.
In the discussion about monitoring techniques, NIRS represents a promising technique for real-time monitoring of muscle oxygenation due to its several significant advantages. One of its primary strengths lies in its ability to deliver continuous, real-time data on tissue oxygen saturation without the need for invasive procedures, making it highly applicable in both laboratory and field environments [185]. NIRS devices are typically portable, user-friendly, and capable of capturing dynamic physiological changes during exercise or rehabilitation, thereby providing valuable insights into an athlete’s aerobic capacity, muscular endurance, and fatigue levels [186]. Furthermore, NIRS has proven effective in supporting the development of personalised training programs and recovery strategies, ultimately contributing to improved performance outcomes and injury prevention [187]. Currently, reliable real-time measurements have been proven for haemoglobin/oxyhaemoglobin, while real-time applications for parameters such as glucose and lactate show potential but still require further validation.
However, the accuracy of NIRS measurements can be influenced by several external factors, such as tissue depth, inter-subject variability, and motion-induced artifacts during dynamic activity. Deeper tissues, especially those with strong self-regulatory mechanisms, may lead to less accurate readings [188]. Motion artifacts, in particular, are a well-documented issue that can significantly distort signal fidelity during movement [189]. Skin tone and adipose layer thickness have been shown to absorb near-infrared light (especially around 690 nm), reducing the amount of light reaching deeper tissues [190]. In addition, environmental factors such as temperature and humidity can interfere with the absorption of infrared light, potentially affecting the measurement accuracy. Therefore, while NIRS offers benefits in continuous monitoring, it is important to consider these factors and calibrate appropriately to achieve more accurate results. As mentioned in previous research on monitoring techniques [71, 121, 137, 139, 161, 174, 184], the use of various wavelengths in NIRS has been studied to improve measurement accuracy. Several studies have compared NIRS with other non-invasive methods [111–115]. This study highlights the need for better wavelength stand-ardisation and improved calibration systems to enhance the reliability of NIRS in the context of athlete fitness monitoring.
Conclusions
Nowadays, athlete fitness monitoring encompasses the use of advanced sensors and complex data analysis. Modern technology facilitates the comprehensive collection of data regarding athletes’ fitness conditions. However, the challenge lies in ensuring that the technology employed possesses the accuracy and reliability necessary for widespread application in sports. This review highlights the relationship between physical indicators and athlete fitness parameters derived from non-invasive observations, particularly NIR/NIRS methods. The review findings indicate that not all physiological indicators can be measured and monitored accurately and reliably, and the monitoring results may not necessarily correlate directly with an individual’s fitness.
To date, there are no specific international standards for non-invasive fitness monitoring devices for athletes. However, wearable devices for athlete fitness monitoring typically adhere to general standards for medical and consumer electronic devices, such as ISO and IEC standards [111, 191], which are widely recognised in the sports industry. Several organisations and studies have proposed parameters and methods to evaluate the effectiveness and reliability of fitness monitoring devices [111, 192]. Nonetheless, more specific and integrated standards may still be under development as technology advances and the use of these devices in sports increases. This review demonstrates the variability in wavelengths that can be utilised in NIR/NIRS techniques. Through this review, the authors recommend the standardisation of wavelengths for marketed wearable devices, along with practical thresholds or formulations for analysis purposes. Absent these measures, athletes and non-athlete users may be misled by biased information generated by fitness-monitoring devices.
This review provides new insights into integrating multiple physiological indicators for next-generation wearable devices. We propose shifting from single-parameter tracking towards multi-variable sensing through multi-wavelength NIRS arrays and hybrid optical-electrical systems, enabling the simultaneous measurement of overlapping biomarkers such as lac-tate, muscle mass, and haemoglobin dynamics. This approach supports the creation of comprehensive, real-time fitness profiles that are currently unavailable in consumer-grade devices. Rather than adopting an oversimplified ‘wavelength standardisation’, we advocate for a broader, systematic strategy that accounts for variability in tissue characteristics, environmental interference, and device architecture, ensuring reliability and reproducibility across platforms.
To operationalise this vision, we introduce a multi-tier standardisation framework comprising: (1) robust calibration protocols to mitigate signal drift and anatomical variability; (2) unified validation procedures benchmarked against clinical gold standards across diverse populations; and (3) transparent data interpretation algorithms for accurate and comparable physiological metrics. Furthermore, we emphasise the role of AI-assisted sensor fusion, integrating NIRS, HRV sensors, inertial units, and machine-learning estimators to deliver context-aware, real-time fitness profiles and predictive analytics. By combining multi-modal sensing, comprehensive standardisation, and AI-driven integration, this review outlines a blueprint for systematic, reliable, and athlete-centred physiological monitoring.