Introduction
Volleyball is one of the world’s most popular team sports, and with its continuous evolution, there is a growing need for effective methods to enhance the physical and technical qualities of athletes [1, 2]. The training process aims to develop an athlete’s physical fitness, which requires a careful balance between training load and recovery to achieve peak performance [3, 4]. The principle of supercompensation dictates that an athlete must be exposed to an optimal training load to temporarily reduce their physical capacity, followed by a period of adequate recovery [5]. This process leads to improved conditioning and a performance level that surpasses initial capabilities [6, 7]. Conversely, insufficient or poor recovery can lead to maladaptation, resulting in decreased performance and an increased risk of injury and illness [6, 7]. Therefore, effective training load monitoring can be crucial for long-term athletic development.
The monitoring cycle involves assessing the external load (the physical work performed by the athlete) and the internal load (the athlete’s physiological and psychological response to that work) [8]. Measuring external load, particularly the volume of jumps, is a key aspect in volleyball [2, 9]. While traditional video analysis is methodologically demanding, the use of accelerometers and Inertial Measurement Units (IMUs), such as the VERT and G-VERT systems, provides a practical and validated approach for real-time monitoring of jump performance [10]. A recent systematic review by Villarejo-García et al. [11] highlighted that IMUs – particularly the VERT and G-VERT models – are among the most frequently validated tools for volleyball monitoring, showing high reliability for jump count and consistent accuracy for jump height across both laboratory and ecological settings. Supporting this evidence, Skazalski et al. [12] demonstrated excellent validity for jump count ( 99%) and strong inter-device reliability for jump height during professional training and competition, with only a slight overestimation of height ( 5 cm) linked to sensor placement. In contrast, Damji et al. [13] reported that landing impact and kinetic energy metrics present questionable accuracy, whereas jump count and height remain reliable and valid indicators of external load. For internal load, the session-RPE method proposed by Foster et al. [14], which uses the Borg CR-10 scale, provides a validated tool to quantify the perceived effort of a training session [15, 16]. Horta et al. [9] demonstrated that the number of vertical jumps performed during training sessions was positively correlated with perceived exertion, indicating that jumping demands influence internal load responses in volleyball players. When analysed by position, session-RPE showed a significant positive correlation with jump count, varying from weak to moderate strength depending on the athlete’s playing position. In addition, Andrade et al. [17] observed that session-RPE effectively captured variations in internal load across different phases of the season and was inversely related to athletes’ recovery status. Together, these findings reinforce the sensitivity and ecological validity of the session-RPE method as a practical tool for monitoring internal load throughout a competitive volleyball season.
Research has shown moderate to strong positive relationships between match and training loads across parameters such as high metabolic load distance, jumps, and accelerations/decelerations [18], with jump counts typically peaking during the preseason and performance improving as the season progresses [19]. Injury incidence has been reported at 5.49 injuries per 1,000 athletic exposures, with injured players showing lower jump counts and greater variation in training load compared to uninjured players [19]. Position-specific demands have been identified, with setters experiencing the highest player load and jump counts in a 51 system [20], although this particular important contextual factor requires further research.
Despite the growing body of research on training load in women’s volleyball, little to no attention has been given to the role of playing position – unlike the more established findings available for men’s volleyball. For instance, outside and opposite hitters demonstrate higher jump heights compared to setters and middle blockers [21], while setters show the greatest jump frequency but at lower heights and intensities, and middle blockers accumulate the lowest overall loads [22, 23]. Moreover, male players generally present higher jump counts, mean intensities, and training loads per session than females, with notable within-week variations in training intensity according to match proximity [22, 23]. Although there has been an increase in dedicated research, few studies have analysed a full women’s volleyball season or comprehensively examined how training loads vary across different player positions and phases of the season. Moreover, a significant challenge remains in quantifying external load for líberos, whose role excludes jumping, rendering traditional metrics used for other positions less applicable. Addressing these specific gaps is crucial for developing tailored, position-specific training programs.
Therefore, the purpose of this study was to investigate the behaviour of training loads in an elite professional women’s volleyball team throughout the preparatory and competitive periods of a season, to determine the influence of player positions on internal and external training load responses, and to understand how external load variables affect internal load responses. Based on this rationale, we hypothesise that (a) the mean weekly training load will differ between the preparatory and competitive periods; (b) training sessions with higher jump volumes will result in greater internal load values for athletes, but these values will be lower than those observed during games; (c) player positions will significantly influence both external and internal training loads; and (d) jumps will be the metric most strongly correlated with internal load within a training session.
Material and methods
Study design
This descriptive longitudinal study was conducted with a convenience sample of participants from an elite women’s volleyball team. Data were collected in Rio de Janeiro, Brazil, from 2019 to 2020. The study period encompassed 40 weeks, divided into a 20-week preparatory period and a 20-week competitive period, which was interrupted by the COVID-19 pandemic. Data were collected by the team’s technical staff and a researcher who attended and monitored the training sessions.
Participants
The study included 14 female (age: 27.93 ± 5.73 years old; experience: 11.6 ± 5.8 years) athletes from an elite Brazilian volleyball team, classified as tier 3 (Highly Trained/National Level) in accordance to the Participants Classification Framework [24]. The team was composed of two setters, four middle blockers, two líberos, four outside hitters, and two opposites. Eligibility criteria included being a professional athlete on the team and having a minimum training frequency of 75%. For game load evaluation, all athletes who participated in at least one set were included. Athletes who played less than one set or only warmed up were not included in the statistical analysis for the games.
A post hoc power analysis was performed using the G*Power 3.1 software [25] to determine the achieved statistical power for the repeated-measures ANOVA with a within–between interaction. The parameters adopted were a moderate-to-large effect size (f = 0.35), an alpha error probability ( ) of 0.05, a correlation among repeated measures of 0.80, and a nonsphericity correction ( ) set at 1.00. Considering the total sample size of 14 participants, the achieved statistical power (1 – ) was 0.93, indicating that the study had sufficient power to detect interaction effects of this magnitude.
Procedures
Data collection
All athletes began each session with a routine of mobility and myofascial release. They were then given their respective G-VERT IMUs (G-VERT Technology, Florida, United States). Before each training session or game, all devices were checked for battery level, firmware updates, and signal connectivity. A few test jumps were performed to ensure that each unit was properly detecting and recording jump events. These metrics were generated and stored in real time by the IMUs and organised into spreadsheets at the end of each session. Raw jump data were subsequently cleaned to minimise noise and artifacts. Jumps registering below 17.5 cm were excluded, as this cutoff closely aligns with the lower detection range reported by Skazalski [12] and accounts for the approximately 12% overestimation of mean jump height described in the same study. These lower values are likely to reflect partial or non-explosive movements (e.g., small displacements, defensive reactions, or foot repositioning) rather than intentional jump actions, and therefore were not considered in the analysis. Similarly, jumps exceeding 15% of each athlete’s individual maximum height were removed to prevent the inclusion of spurious peaks caused by sensor vibration, belt displacement, or algorithmic overshoot artifacts, which may occur during rapid body rotations or collisions. Following the sessions, athletes completed a questionnaire using the Borg CR-10 scale via Google Forms, between 10 and 30 min after the session ended.
For analysis, training sessions were classified into two types: training without jumps (TWoJ) and training with jumps (TWJ). TWoJ sessions focused on movement and foundational skills (e.g., defence, reception, setting, and serving), resulting in a low number of jumps. TWJ sessions were focused on tactical complexities and technical skills (e.g., attacking and blocking), which generated higher volumes of jumps. For games, data were collected continuously from the warm-up until the end of the match, pausing only during intervals between sets.
Anthropometry
Body mass was measured using an OMRON HBF-214 bioelectrical impedance analysis (BIA) scale (Krell Precision (Yangzhou), Yangzhou, China). Athletes were instructed to stand barefoot on the scale with minimal clothing for an accurate reading. Body composition was assessed using skinfold measurements taken with a LANGE calliper (NutriActiva LLC, Minneapolis, USA). A total of five sites were measured on the right side of the body according to the Pollock 5-site formula: pectoral, abdominal, thigh, triceps, and suprailiac. Two measurements were taken at each site, and the average value was used for analysis. Body fat percentage was then calculated using the Pollock 5-site regression equation, and lean mass was derived by subtracting fat mass from total body mass.
External load measurement
The G-VERT is a wearable Inertial Measurement Unit (IMU) positioned on the athlete’s waistband, near the body’s centre of mass, to measure jump count and jump height. It is a small, lightweight device measuring approximately 6 × 3 × 0.5 cm, weighing about 68 g (0.15 lbs), and containing a 3-axis accelerometer and gyroscope operating at a high sampling rate of 3,000 Hz. It is designed to provide coaches and researchers with a practical, real-time method for quantifying external training load in sports that involve frequent jumping. The instrument was previously validated and confirmed its reliability [11].
Internal load measurement
Internal training load was measured using the session-RPE method proposed by Foster et al. [14], which consists in multiplying the perceived exertion of the session by the volume of training measured in minutes. The Borg category-ratio scale (CR-10) [26] was used to quantify perceived exertion. The Borg CR-10 scale is a modified rating of perceived exertion scale that uses both numbers from 0 to 10 and verbal anchors to help athletes match their subjective feeling of effort to a corresponding number, ranging from ‘Rest’ (0) to ‘Maximal effort’ (10). In response to the question, ‘How intense was the session?’, each player provided an individual rating using a dedicated form designed specifically for the study.
Statistical analysis
All analyses were conducted using the cleaned dataset, which excluded jumps below 17.5 cm and values exceeding 15% of each athlete’s maximum height. This procedure was intended to minimise potential bias and improve the reliability of the results by focusing on valid and ecologically representative jump events. Mixed ANOVAs were conducted to compare dependent variables among different volleyball positions, training methods, and season phases. For each analysis, a Bonferroni multiple comparison adjustment was applied for pairwise comparisons, and a Tukey HSD post hoc test was used for comparisons between positions. Oneway ANOVAs were performed to compare the dependent variables of internal and external load across different types of training and games. A Pearson correlation with Cohen’s effect size was also performed to examine the relationship between external and internal load variables. All statistical analyses were performed using GraphPad Prism 8 and SPSS. The statistical significance level was set at p 0.05.
Results
When assessing the athletes’ anthropometric measurements, the present group showed that the opposites (OP) had the highest average age, highest weight, and greatest values for lean body mass. The líberos (LB) were the youngest and shortest athletes, with the lowest values for weight, body fat percentage, lean body mass, and fat mass. The middle blockers (MB) stood out as the tallest, while the setters (S) had the highest body fat percentage and fat mass. Table 1 presents the descriptive data for the sample. When analysing the anthropometric data for each position, a statistical difference was found only for lean body mass between the líberos and the opposites (p = 0.034). No significant differences were found for the other positions or anthropometric variables.
Table 1
Descriptive data of the sample
A total of 270 training sessions were recorded during the season, comprising 169 Training Without Jumps (TWoJ) and 101 Training With Jumps (TWJ) sessions. Within the TWoJ category, 88 sessions occurred during the pre-competitive period and 81 during the competitive period, while the TWJ sessions comprised 27 and 74, respectively. The mean duration of TWoJ was 57.04 ± 23.58 min, and that of TWJ was 71.41 ± 20.70 min. Throughout the same period, a total of 33 matches were played: 22 in the Brazilian Superliga, 3 in the Copa do Brasil, 4 in the Campeonato Carioca, and 4 friendly games, resulting in 30 wins, 2 losses (both in the Superliga), and 1 draw (2 × 2 friendly). Considering the number of sets played, 18 matches lasted three sets, 11 lasted four, and four extended to five sets, with corresponding mean durations of 99.08 ± 13.83 min, 116.61 ± 27.86 min, and 158.00 ± 13.11 min, respectively.
Session-RPE
No interaction was found between season phase and position [F(4,92) = 1.078, p = 0.372, η2 = 0.045]. A significant main effect was found for position [F(4,92) = 18.266, p < 0.001, η2 = 0.443], showing a significant difference for middle blockers, with values lower than the other positions, and for líberos, with values higher than middle blockers, opposites, and setters (Figure 1; Table 2).
Figure 1
Variation in training load across 20 weeks of the preparatory period and 20 weeks of the competitive period by player position: A – libero, B – setter, C – middle blocker, D – outside hitter, E – opposite or right-side hitter
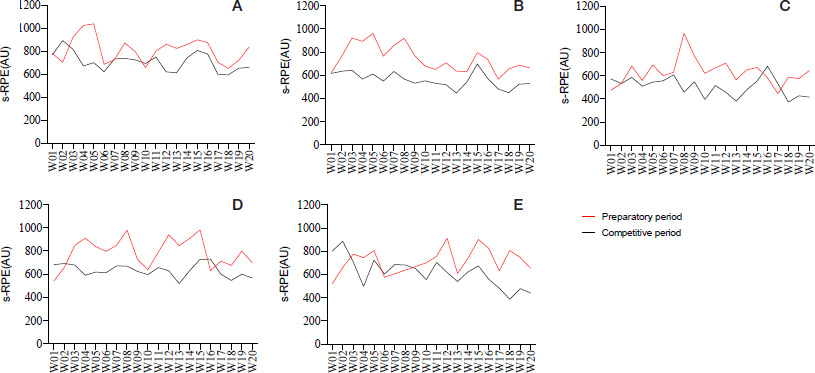
Table 2
Comparison between positions for the average of the RPE of the session in each period
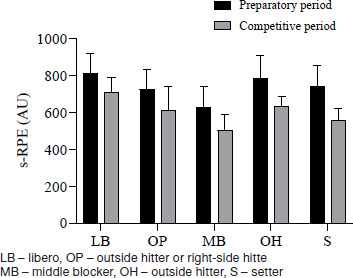
A significant main effect was also found for competitive period [F(1,92) = 99.836, p < 0.001, η2 = 0.520], with the preparatory period having higher values (p < 0.001) than the competitive period (Figure 2; Table 3). Furthermore, when comparing the values for each position individually, significant values were also observed for the preparatory period (p < 0.001) (Figure 2; Table 2).
Figure 2
Comparison of the mean session-RPE of the preparatory and competitive periods for each position
Type of session × game
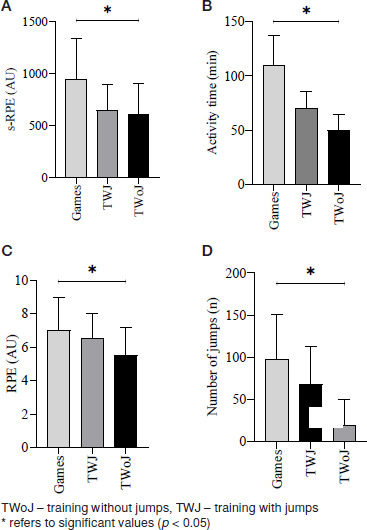
The differences in the dependent variables based on the independent variables (Games; TWoJ; TWJ) were analysed, and significant differences were found for the following: Jumps (Games × TWJ; Games × TWoJ; TWJ × TWoJ, p < 0.001), activity time (Games × TWJ; Games × TWoJ; TWJ × TWoJ, p < 0.001), RPE (Games × TWoJ; TWJ × TWoJ, p < 0.001; Games × TWJ, p = 0.004), and session RPE (Games × TWoJ; TWJ × TWoJ; Games × TWJ, p < 0.001), as can be seen in Figure 3.
Type of session × position
An interaction between position and type of training was observed for session-RPE [F(4,153) = 5.802, p < 0.001, η2 = 0.132]. A main effect for positions was also found [F(4,153) = 5.86, p < 0.001, η2 = 0.133], where the MB showed a statistical difference compared to LB (p = 0.011), OP (p = 0.006), and S (p = 0.006), as well as OH compared to OP (p = 0.036) and S (p = 0.036) (Figure 4A; Table 4). A main effect for type of training was also found [F(1,153) = 7.47, p = 0.007, η2 = 0.047], where TWJ presented higher values than TWoJ (Figure 4A; Table 4). Therefore, it was possible to observe a difference in the interaction between LB and the other positions for each type of training (Figure 4A; Table 4).
Figure 4
(A) Comparison between positions and session RPE in TWoJ and TW (B) Comparison between positions and jumps in TWoJ and TWJ
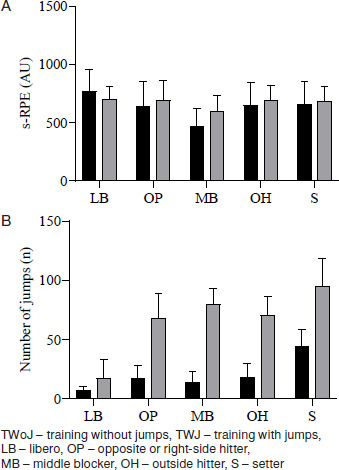
Table 4
Comparison between positions for the average session RPE for each type of training
An interaction between position and type of training was observed for jumps [F (4,151) = 27.722, p < 0.001, η2 = 0.423]. A main effect for positions was also found [F(4,151) = 127.993, p < 0.001, η2 = 0.772], where LB showed a statistical difference compared to the other positions (MB p < 0.001; OP p < 0.001; S p < 0.001; OH p < 0.001), presenting lower values (Figure 4B; Table 5). A difference was also found between S and the others (MB p < 0.001; OP p < 0.001; LB p < 0.001; OH p < 0.001), where S presented higher values. No significant difference was found for the attackers (Figure 4B; Table 5). A main effect for type of training was also found [F(1,151) = 662.109, p < 0.001, η2 = 0.814], with TWJ having higher values. Therefore, it was possible to observe a difference in the interaction between LB and the other positions for each type of training (Figure 4B; Table 5).
Table 5
Comparison between positions for the average jumps for each type of training
External × internal load
Correlations were performed between internal and external load variables for each type of training (TWJ and TWoJ). When analysing these correlations in TWJ, a small positive correlation was found between RPE and jumps (r = 0.1; p = 0.0003; 95% CI = 0.04 to 0.15), and with activity time (r = 0.23; p > 0.0001; 95% CI = 0.17 to 0.28), while for session RPE, a small positive correlation was observed with activity time (r = 0.18; p < 0.0001; 95% CI = 0.12 to 0.23). However, in TWoJ, only a small positive correlation was found between RPE and activity time (r = 0.28; p < 0.0001; 95% CI = 0.23 to 0.33). For session RPE, a small positive correlation with activity time was found (r = 0.38; p < 0.0001; 95% CI = 0.33 to 0.43), along with a trivial positive correlation between jumps and session RPE (r = 0.07; p = 0.0117; 95% CI = 0.01 to 0.13), as shown in Table 6.
Table 6
Description of correlations between external and internal load measures with effect size in r
Discussion
The present study investigated the internal and external load responses over the course of a competitive season for a professional volleyball team. It was observed that the preparatory period resulted in higher training loads, a strategy implemented by the coaching staff to prepare the team over time for the competitive phase. During the competitive period, the average values of the matches were found to be higher than the training averages for all variables investigated. Additionally, it was noted that the different player positions generated varying demands during training sessions, particularly when comparing middle blockers (MB) and líberos (LB) with the other positions. Furthermore, a significant and positive correlation was observed between jumps and internal load during the sessions.
It was found that the preparatory period led to higher external and internal loads compared to the competitive period, supporting hypothesis (a). Similar findings were reported by Andrade et al. [17] and Pisa et al. [27], where higher internal loads and training volumes (in minutes) were observed during the preparatory phase. This phenomenon can be attributed to periodisation strategies employed by coaching staff, since during the preparatory phase, the objective is to increase the athlete’s overall physical capacity by gradually exposing them to higher training volumes and intensities, which enhances the body’s ability to tolerate greater workloads in the future [28]. In particular, internal load is typically elevated during the preparatory phase due to the higher training intensity and volume, which are intended to build aerobic endurance and muscular endurance. This contrasts with the competitive period, where the focus shifts towards maintaining peak performance and fine-tuning volleyball-specific skills, resulting in relatively lower internal loads [29].
As per hypothesis (b), it was observed that both external and internal loads were higher during matches than during training. Although the TWJ sessions resulted in higher average internal loads compared to TWoJ, the match values still exceeded those observed during training. These findings align with previous reports which showed that both internal and external loads are generally higher during matches compared to training sessions [18, 30]. A potential explanation for this difference lies in the fact that match durations were longer than TWJ sessions, which, in turn, were longer than TWoJ sessions. Thus, the duration of the activity and the volume of jumps should be considered important factors when distinguishing between different types of training and matches. Lima et al. [30] demonstrated that the temporal proximity of matches significantly influences the configuration of training sessions in professional volleyball. In their study, higher internal and external loads were observed two days before competition (MD–2), while both decreased on the day preceding the match (MD–1), reflecting a tapering approach. This pattern indicates that training structure and intensity are adjusted according to match distance, with greater volumes and jump demands earlier in the week and reduced loads closer to competition to optimise recovery and performance readiness.
According to hypothesis (c), different types of training and player positions are expected to produce distinct internal and external load responses in athletes, and our results largely align with this hypothesis. Specifically, we observed that setters (S) exhibited a higher volume of jumps compared to other positions. This finding is consistent with previous studies indicating that setters generally perform the highest number of jumps, albeit at lower heights and intensities compared to positions like outside hitters (OH) or opposites (OP) [21, 22]. Interestingly, our results showed that middle blockers (MB) exhibited lower internal load values relative to other positions. This aligns with research by Bouzigues et al. [22], which reported that MBs tend to experience the highest training loads among male athletes, but this is often associated with high-intensity efforts like blocking and quick directional changes rather than jump volumes. This suggests that while MBs may not jump as much as setters or OH/OP players, their training loads are still high due to the intensity of their actions during training. In contrast, the líberos (LB) in our study exhibited higher session RPE values than the other positions, which is noteworthy given their lower jump volumes, likely due to the specificity of their role. This result aligns with findings by Horta et al. [9], who also reported that líberos tend to show higher RPE values despite performing fewer high-intensity actions like jumps, as they are often involved in more continuous movement and defensive actions that contribute to a higher internal load. Further, when examining TWoJ sessions, we found that LB players demonstrated a distinctive response pattern, likely influenced by their relatively low jump volumes. This supports the idea that position-specific roles drive differential internal and external load profiles, as seen in the study by Horta et al. [9], where LB players showed higher RPE despite lower jump volumes. This suggests that the overall physical demands for líberos might be more evenly distributed over the course of a session, with an emphasis on maintaining high endurance and consistency in defensive actions.
In contrast, research by Cabarkapa et al. [21] highlighted that outside hitters and opposites tend to exhibit greater jump heights and thus, potentially, greater external loads compared to setters or MBs. These positions are involved in more attacking plays, which are typically associated with higher jump intensities. This was partially reflected in our results, as we observed a trend where the external load was higher for positions that required more explosive actions (e.g., OH, OP), which also correlates with their higher jump volumes.
Our study also revealed that different types of training sessions generated varying internal load responses. Specifically, tactical and attack precision training sessions were associated with higher RPE values, which supports previous research by Horta et al. [9] that found higher RPE values during specific skill-focused training, such as attack drills. These sessions likely target more specific neuromuscular adaptations and energy system utilisation, which may lead to a higher perception of effort, particularly in positions that require high levels of coordination and skill.
In line with hypothesis (d), a positive correlation was found between jumps and RPE during TWJ, as well as between jumps and session RPE during TWoJ, which is consistent with findings from Lima et al. [30]. However, these correlations were small and trivial, suggesting that while jumps may contribute to the internal load, they are not the sole determinant of the perceived effort or session intensity. Similarly, the correlations for activity time were also small, further emphasising the complexity of internal load regulation in volleyball. This finding is in accordance with previous research that highlights the multifactorial nature of internal load, where the RPE is influenced not only by the volume of physical actions but also by the intensity, complexity, and overall context of the training session or match [8, 31].
While jumps and activity time are commonly used as indicators of external load, they represent only a portion of the physical demands experienced by volleyball players. As suggested by Pelzer et al. [32], other game actions, such as diving, defending, or non-jumping serves, could also play a significant role in influencing the internal training load. For example, defensive movements, such as low- or high-intensity sprints or lateral movements, could generate substantial internal load through energy system utilisation, despite not involving jumps. Additionally, blocking actions, which are not always associated with high jump heights, could also impose significant neuromuscular strain, contributing to perceived effort. Similarly, the mental fatigue and concentration required during strategic gameplay or decision-making can also contribute to the internal load, though it may not be directly captured through simple external measures like jump volume or activity time [33].
While the present study provides valuable insights into the internal and external load responses during different phases of a volleyball season, it is not without limitations. One key limitation of the present study is the lack of control over several contextual variables that could have influenced the results, such as the specific structure of the training sessions, individual drills, and recovery protocols, which were not monitored consistently across athletes. In particular, parameters related to training structure – such as drill duration, and pausing – were not systematically recorded, as notational analysis data were unavailable. These factors may substantially affect internal load responses [27], since a higher training density or shorter rest intervals can elevate perceived exertion and physiological stress even when the external load indicators remain similar. Although training density was not quantified in the present study, as the duration of each individual action within drills was not systematically recorded, it is important to recognise that this variable may substantially influence the internal load experienced by athletes. Technical and tactical sessions, in particular, often involve short or very short rest intervals between successive actions, intentionally prolonging game-like sequences and increasing overall physiological and perceptual stress. Therefore, future studies should consider incorporating notational analysis or time-motion assessment to quantify training density, providing a more comprehensive understanding of how drill structure and temporal organisation affect the internal load across playing positions and training phases.
Consequently, variability in individual training history, recovery practices, and session structure [27] could have contributed to fluctuations in internal load and partially confounded the observed findings. Similarly, the study focused primarily on jumps and activity time as external load indicators, overlooking other potential measures such as changes in direction, acceleration/deceleration patterns, or cognitive demands that could also contribute to internal load. Moreover, despite the data-cleaning procedures implemented to enhance measurement accuracy, minor inaccuracies inherent to the G-VERT device may persist, including slight overestimations of jump height and sensitivity to placement and movement artifacts [11, 12, 13].
The reliance on subjective measures like RPE introduces the possibility of bias, as individual perceptions of effort may vary based on factors such as motivation, fatigue, or psychological state, which are difficult to standardise across a team. Another limitation is the relatively small sample size, which may limit the generalisability of the findings to other teams or sports contexts. Lastly, age may act as a confounder in longitudinal monitoring, as younger and older athletes can differ in recovery kinetics and tolerance to cumulative load. While our repeated-measures design within the same elite squad partially mitigates between-subject confounding, we did not explicitly model age; therefore, residual confounding cannot be ruled out. Future studies should stratify by age and/or include age as a covariate (and explore interactions with playing position and season phase) to better isolate age-related effects on internal (e.g., sRPE) and external (e.g., jump metrics) load responses.
The findings of this study may offer practical implications for managing training loads in volleyball. The higher internal and external loads during the preparatory period highlight the importance of strategically increasing training intensity early in the season to build athletes’ physical capacity, potentially reducing injury risk during the competitive phase. Position-specific differences, such as the higher jump volumes in setters and greater session RPE in líberos, suggest that the training should be adjusted to the specific demands of each position. Coaches should monitor and adjust loads accordingly to ensure players are neither over-nor under-loaded. Additionally, while jumps were positively correlated with session RPE, these correlations were small, indicating the need to consider other external load variables, such as movement patterns and cognitive demands, to gain a more complete understanding of the factors influencing internal load. Incorporating wearable technology and combining external load data with subjective measures like RPE could improve load monitoring and help optimise training plans while minimising injury risks.
Conclusions
The findings confirm that the preparatory period was associated with higher external and internal loads compared to the competitive period, supporting the strategic approach of building physical capacity early in the season. Notably, setters exhibited a higher volume of jumps compared to other positions, while middle blockers showed lower internal load values and líberos demonstrated higher perceived session effort values. These position-specific responses underline the importance of tailoring training loads to the specific demands of each role. Additionally, while a positive correlation was found between jump volume and RPE during TWJ, and between jumps and session RPE during TWoJ, the small correlation coefficients suggest that other factors – such as movement patterns and cognitive demands – also contribute to internal load and should be considered in future training assessments.