Introduction
The decline in muscle function associated with ageing is closely linked to decreased physical abilities in older adults. Studies have shown a strong correlation between reduced physical performance and a higher risk of falls among the elderly. This increased risk of falling can have a significant impact on life expectancy and quality of life in older individuals, often leading to hospitalisations and potentially contributing to higher mortality rates [1]. The current evidence indicates that older women have a higher risk of falling than older men. Furthermore, falls are associated with a higher incidence of fractures in older women [2, 3]. A possible explanation for this is that older women experience menopause, which leads to a decrease in bone mineral density due to a drop in oestrogen, resulting in osteoporosis. Osteoporosis is a progressive disease that disproportionately affects postmenopausal women and makes them more susceptible to fractures [2]. Additionally, older women are often underrepresented in exercise training studies and tend to be more sedentary and less physically active than older men [4]. This highlights the importance of creating interventions specifically for this population.
A previous meta-analysis indicated that muscle strength and physical performance are better predictors of functional decline in activities of daily living (ADL) in older adults compared to muscle mass alone [5]. While muscle strength is essential for physical performance, research suggests that muscle power has an even stronger association with functional outcomes than strength alone. This implies that the ability to generate force rapidly may be more crucial for maintaining independence in daily activities than maximal strength alone [6]. Muscle power demonstrates a stronger correlation (r = 0.47) with functional measures compared to muscle strength (r = 0.43) in evaluating lower extremity performance [7]. While muscle strength, defined as the ability to generate maximal force, is a well-established factor in functional limitations among older individuals, muscle power – calculated as the product of force and contraction velocity – appears to decline earlier and more rapidly than strength with age [8]. A longitudinal study conducted over 10 years by Alcazar et al. [9] highlighted a decrease in maximal power output among older adults. This decline was attributed to diminished force generation capacity and slower movement velocity. The researchers observed that these deficits in muscle power were linked to reduced physical performance, lower quality of life, increased frailty, and impaired cognitive function in the elderly population [10]. Therefore, interventions aimed at enhancing muscle power are crucial for this demographic.
Jumping training is a dynamic exercise method that leverages the stretch-shortening cycle, which is a rapid sequence of muscle-tendon lengthening and shortening crucial for boosting power output in athletes. While traditionally associated with athletic performance, recent research has explored its potential advantages for the general population and older adults. A meta-analysis investigating the impact of jumping training in older individuals found it to be a safe and effective way to enhance power output [11]. Nonetheless, the rapid movements involved in jumping exercises can pose challenges and potential risks for older individuals [12]. Proper landing techniques are vital to minimise Ground Reaction Force (GRF), which can cause muscle pain, strain, and possible injuries to muscles and joints [13]. To address these concerns, the use of minitrampolines with elastic surfaces presents a viable option, potentially reducing strain and lowering the risk of adverse events in older populations. A recent randomised controlled trial showed that SuperJump training – a form of high-impact exercise using a mini-trampoline – led to notable improvements in bone health and glucose metabolism in women with regular menstrual cycles [14]. In addition, another study found that mini-trampoline exercise can enhance physical performance in individuals with osteopenia [15]. These findings indicate that mini-trampoline exercise may act as a stimulus affecting multiple physiological systems and producing widespread effects. However, the mentioned studies utilised a structured program that combined both resistance and aerobic exercises, unlike the present study, which focused solely on a jumping-based protocol. So, this preliminary study aimed to assess the safety and effectiveness of a 4-week minitrampoline jumping exercise program in improving knee extensor maximal strength and physical performance in older women. The researchers hypothesised that this exercise approach would enhance knee extensor strength and physical performance while ensuring participant safety.
Material and methods
Study design and participants
This preliminary randomised, controlled, assessors blinded, open-label trial investigated the safety and effectiveness of a 4-week mini-trampoline jumping exercise program on physical performance in older women. The study was conducted at the Physiotherapy Laboratory, Department of Physiotherapy, Faculty of Associated Medical Sciences, Khon Kaen University, Khon Kaen, Thailand, spanning from September 2024 to January 2025. The eligible participants were healthy women aged 60–65 years with no medical contraindications to exercise and a body mass index below 30 kg/m2 who were able to walk independently. Exclusion criteria included neurological diseases, cardiovascular conditions, musculoskeletal impairments, previous Achilles tendon rupture, severe osteoarthritis, joint replacement, or concurrent enrolment in other exercise intervention programs. During the initial visit, participants were enrolled and randomly assigned to either the experimental group (EG) or the control group (CG) through a concealed allocation process using opaque envelopes, each containing a single letter – ‘E’ for experimental or ‘C’ for control group assignment.
Intervention
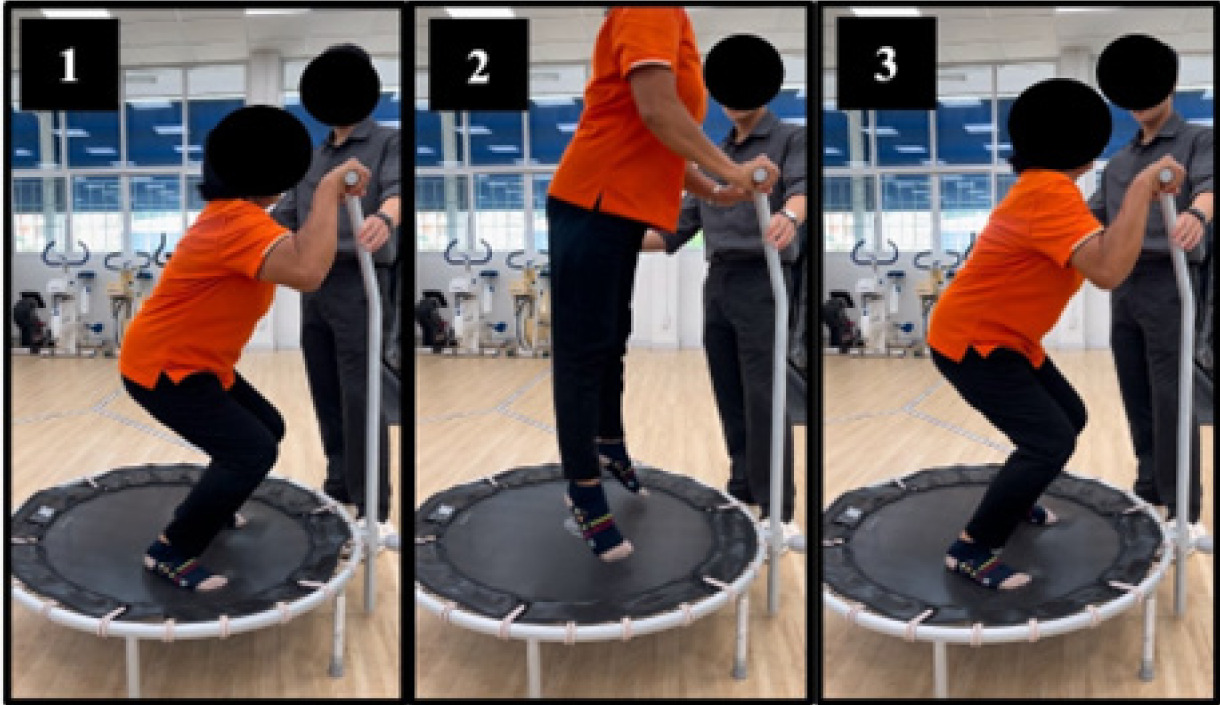
The mini-trampoline jumping exercise program was implemented as an intervention to enhance fitness, particularly focusing on power generation and strength improvement in older populations. The program utilised a DOMYOS FIT TRAMPO 500 (Decathlon) minitrampoline with an 81 cm jumping surface positioned at a height of 24 cm and featuring a front bar for safety. Participants engaged in jumping exercises comprising three main phases: eccentric-to-concentric, propulsive, and landing (refer to Figure 1). Each session included 90 contacts (6 sets of 15 contacts) conducted three times weekly for four weeks, totalling 1,080 contacts throughout the intervention period. This regimen aligns with the recommendations for beginners by the National Strength and Conditioning Association (NSCA) and the training protocol from previous studies [12, 16]. Certified sport physiotherapists (CS and LDJ) with experience supervised all sessions, ensuring proper execution, safety, and monitoring for any adverse events. The training sessions were held at the Physiotherapy Department, School of Physiotherapy, Faculty of Associated Medical Sciences, Khon Kaen University, Thailand. Participants were acquainted with the movement phases, with a focus on the correct landing technique. Adherence to the program was monitored through logbooks to verify the completion of all sessions. This mini-trampoline intervention was chosen as a low-impact alternative to traditional jumping exercises, aiming to reduce exertion and risk for older adults while still offering benefits in power and strength enhancement.
Outcome measurements
Maximal knee extensor strength testing
The study employed a Biodex System 4 Pro Dynamometer (Shirley, New York) for conducting the isokinetic and isometric strength assessments, with calibration carried out before each session to ensure accuracy. Participants were seated upright with the seat inclined at a 105° angle and secured by shoulder and waist straps to minimise compensatory movements. The knee’s rotational axis was aligned with the dynamometer’s shaft, and an ankle strap was positioned above the malleoli. The knee’s range of motion was set from full extension to 90°–110° flexion, using 90° as the anatomical reference point.
Assessments were performed on the dominant side following a five-minute warm-up on a stationary cycle ergometer. The testing sequence commenced with isometric knee extension at 90° (PTMVC) and proceeded to isokinetic knee extension at 60°/s (PTISOK). For isometric testing, participants executed three five-second contractions with 30-second rest intervals. A five-minute break preceded the isokinetic assessment, starting with three submaximal repetitions followed by three maximal contractions. Subsequently, after another five-minute rest period, participants underwent the final isokinetic test at 60°/s, involving three submaximal practice attempts and five maximal contractions [17].
A single assessor administered all tests, offering consistent verbal instructions throughout the process. Participants were guided to exert maximal effort with an emphasis on speed during contractions. Data analysis involved determining peak torque from the highest of three trials in isometric testing and peak torque at 60°/s from the highest of three trials in isokinetic testing.
Physical performance
Five times sit-to-stand test (5STST)
The sit-to-stand test, a commonly utilised assessment for evaluating lower extremity strength and balance, was conducted following a standardised procedure. Participants initiated the test in a seated position with their back against a chair and arms crossed over their chest. Upon the examiner’s cue to begin, subjects were tasked with standing up and sitting down five times as swiftly as possible. Timing commenced at the start signal and concluded when the subject’s buttocks contacted the chair after the fifth repetition. Participants were instructed to fully stand between each repetition without relying on the chair’s back for support and were allowed to adjust their foot positioning for comfort. The examiner provided clear guidance and ensured proper execution of the test throughout [18]. Each participant completed two trials of the sit-to-stand test, and the average time taken across both attempts was calculated and utilised for subsequent analysis.
Power output from five times sit-to-stand test
The study utilised the relative mean sit-to-stand (STS) power (W/kg) as a measure to represent the power output derived from the 5STST. The calculation for the relative mean STS power, as suggested by Alcazar et al. [19], is presented below [19, 20]:
Relative mean STS power = 0.9 × g × height (0.5 × × chair height) /(five STS time × 0.1)
Timed up and go test (TUGT)
The timed up and go test (TUGT) is a functional mobility assessment method that measures the time taken for individuals to complete specific tasks such as rising from an armchair, walking a short distance, turning around a cone, and returning to sit back down. Initially designed to evaluate balance and fall risk among the elderly, this test involves using a chair with arms and a marked 3-metre walking path with a cone at the end. Participants are positioned with their back against the chair, feet behind a starting line, and upon the signal to begin, they stand up, navigate around the cone, walk back to the chair, and sit down. Timing commences at the start signal and concludes when the individual’s back makes contact with the chair. Following a practice run, two timed trials are executed, and the average time is calculated for analysis purposes [21, 22].
10-metre walk test (10MWT)
The 10-metre walk test (10MWT) was utilised to assess gait speed under both regular and fast walking conditions. This evaluation took place on a level, uncarpeted 10-metre pathway. To ensure consistency, only the central 4 metres were timed to eliminate the impact of acceleration and deceleration. Participants were instructed to walk at their normal pace for the standard speed assessment and at their maximum speed without running for the rapid speed assessment. Timing began when the participant’s leading foot crossed the 3-metre mark and concluded at the 7-metre mark. Each speed condition involved two trials with appropriate rest intervals between them. The average time from the two trials was used to calculate gait speed in metres per second (m/s) for each condition [23, 24].
Statistical analysis
The statistical analysis involved presenting descriptive statistics for baseline characteristics, including means and standard deviations for each group. The Shapiro–Wilk test was utilised to examine the data distribution. Within-group changes from baseline to post-intervention were assessed using paired t-tests, while between-group variances were analysed through ANCOVA with baseline measurements as covariates and between-group Bonferroni post-hoc analysis. Statistical significance was established at p < 0.05. Effect sizes were reported using Hedges’ g for within-group comparisons (small: 0.2, medium: 0.5, large: 0.8) and partial η2 for the between-group analyses (small: 0.01, medium: 0.06, large: 0.14) [25, 26]. All statistical analyses were conducted using SPSS version 29 (Chicago, Illinois, USA).
Results
Participants and baseline characteristics
Nineteen female participants were included in this study, with random allocation into two groups: 10 in the CG and 9 in the EG. All participants successfully completed the study protocol. As depicted in Table 1, the baseline characteristics were comparable between the two groups. No adverse events were documented in the EG during the study, except for instances of delayed onset muscle soreness (DOMS) following the intervention.
Table 1
Baseline characteristics of participants categorised by treatment: control group (CG) or jumping exercise group (EG)
Table 2
Comparison of outcome measurements between CG (n = 10) and EG (n = 9) at baseline and 4-weeks post-intervention
[i] PTMVC – isometric knee extension at 90°, PTISOK – isokinetic knee extension at 60°/s, 5STST – five times sit-to-stand test, TUGT – timed up and go test, CS10MWT – 10-metre walk test at casual speed, velocity CS – velocity at casual speed, FT10MWT – 10-metre walk test at the fastest speed, velocity FT – velocity at the fastest speed
a paired t-test for within-group comparison, b one-way ANCOVA test for between-groups comparison
* p < 0.05, ** p < 0.01, # p < 0.001
Outcome variables
Maximal knee extensors strength
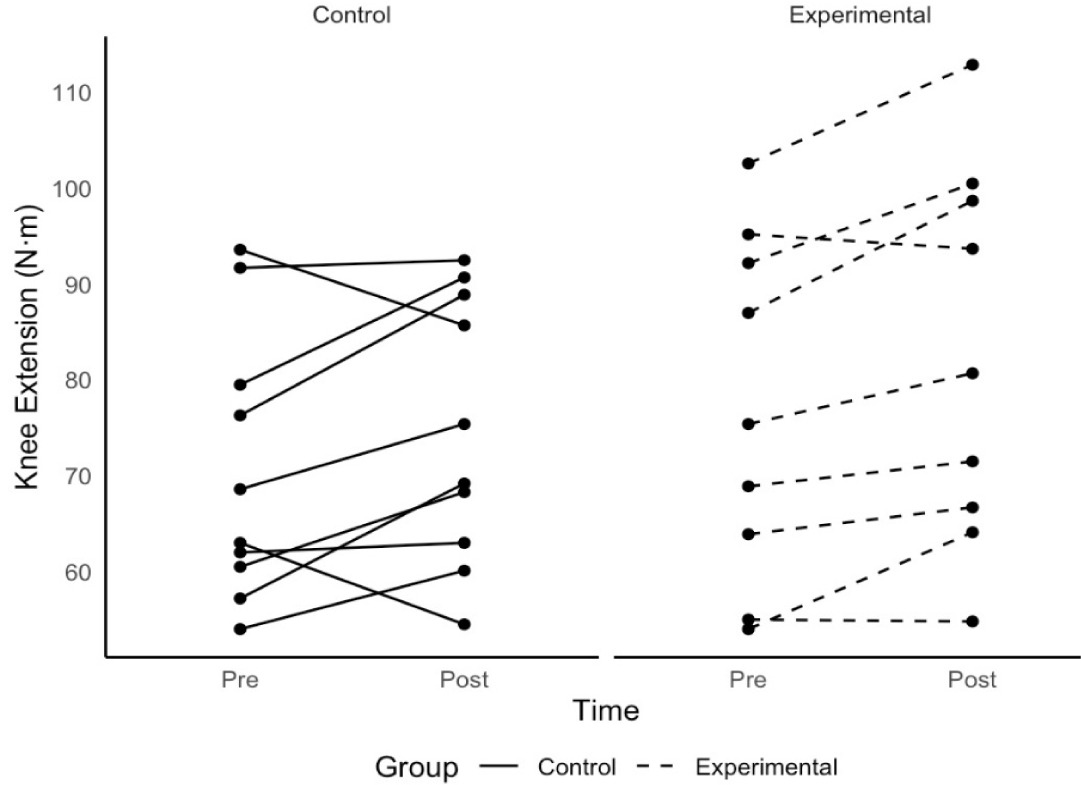
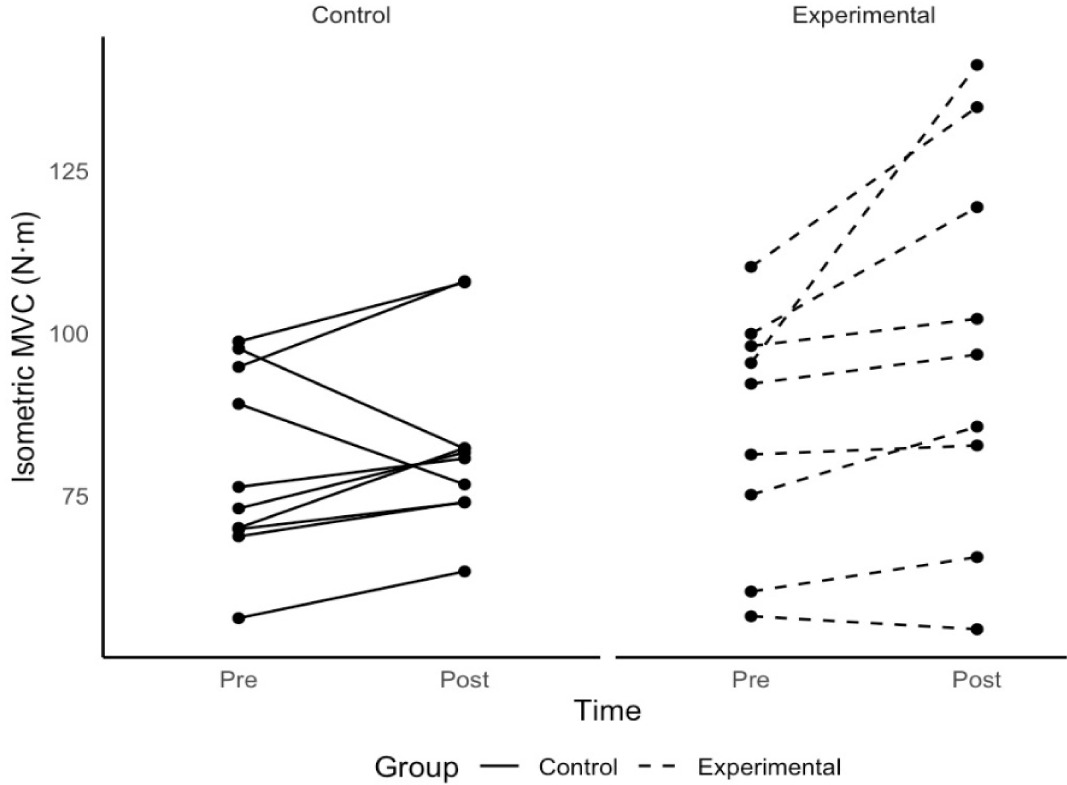
Following a four-week intervention, our study findings showed similar outcomes in maximal strength tests for both the CG and the EG, encompassing isometric and isokinetic evaluations. While no statistically significant variances were observed in overall maximal strength metrics, the EG exhibited a noticeable, albeit not statistically significant, enhancement in PTMVC in comparison to the CG (adjusted values: 94.38 ± 4.26 N · m vs 86.36 ± 4.04 N · m; p = 0.19). In the isokinetic knee extension test at 60°/s, the EG also displayed a slightly greater mean difference than the CG (adjusted values: 79.30 ± 2.26 N · m vs 77.83 ± 2.24 N · m; p = 0.65). Intriguingly, the EG demonstrated significant improvements within the group in both maximal strength tests (PTMVC: p = 0.018; Hedges’ g = 0.76; PTISOK: p = 0.005; Hedges’ g = 1.02), while the CG did not exhibit such enhancements (p > 0.05) (Table 2). Individual progress analysis over time indicated that up to 90% of EG participants exhibited a rising trend in both PTMVC and PTISOK, as depicted in Figures 2 and 3. Conversely, approximately 80% of CG participants demonstrated similar advancements in these metrics.
Physical performance
The EG demonstrated significant enhancements in various key physical performance measures compared to the control group (CG): (1) 5STST: EG 5.87s vs CG 7.21s (p < 0.01; η2 = 0.56); (2) Power output: EG 5.53 watts vs CG 4.57 watts (p = 0.002; η2 = 0.47); (3) TUGT: EG 6.30s vs CG 8.71s (p = 0.004; η2 = 0.41). However, no significant differences were observed in the 10MWT or its velocity at both comfortable and fastest speeds (all p > 0.05). Within the EG, significant improvements were noted in the aforementioned parameters, with substantial effect sizes (Hedges’ g ≥ 1.20), except for the 10MWT and its velocity, which exhibited non-significant alterations (effect sizes ranging from small to medium). The CG also showed significant changes in 5STST, power output, and TUGT. However, the advancements in 5STST and power output were modest, with p-values nearing 0.05 (0.047 and 0.041, respectively) and 95% confidence intervals encompassing zero. It is noteworthy that while the CG displayed a significant variance in TUGT post-intervention, it was in the opposite direction to the EG, with CG participants taking longer to complete the test (Table 2).
Discussion
This research delved into evaluating the safety and effectiveness of a 4-week mini-trampoline jumping exercise regimen on knee extensor maximal strength and physical performance among older women. The structured program, involving 1,080 total contacts, resulted in notable enhancements in various physical performance indicators such as the 5STST, power output, and TUGT, although not in the 10MWT. Significantly, the 4-week intervention led to improved maximal knee extensor strength in both isometric and isokinetic assessments within the experimental group. Nonetheless, when comparing between-groups, similar increments in maximal strength were observed. These findings suggest that mini-trampoline bouncing can effectively boost knee extensor strength and physical performance in older women over a 4-week span. The intervention was deemed safe, with only delayed onset muscle soreness (DOMS) noted as a typical response to resistance training. Crucially, this training approach showcased feasibility and time efficiency for female older adults.
The study findings indicated significant enhancements in maximal knee extensor strength within the EG but not in the CG for both the isometric and isokinetic tests. In isometric testing, the EG displayed a 12.66 N · m increase, suggesting that mini-trampoline bouncing can indeed augment strength development, despite the absence of significant intergroup differences. These results differ from a previous study that reported no significant changes within or between groups following jumping training in older males [12, 27]. These results contrast with prior research that reported minimal changes in maximal voluntary contraction (MVC) following jumping training in older males. Methodological variations, such as the measurement of knee extensor torque in Newton-metres (N · m) without visual feedback in our study, as opposed to linear knee extensor force in Newtons in the previous study, make direct comparisons challenging [12, 27]. The study’s observations on isokinetic knee extensor strength echoed those of isometric testing, albeit with a smaller improvement magnitude (5.49 N · m increase). These results align with earlier studies that demonstrated positive trends in isokinetic knee extensor strength, with increases of 12.6 N · m and 8.8 N · m respectively [28, 29].
Although 4-week interventions are less frequently used in resistance training studies, recent evidence indicates that neuromuscular and strength gains can still be observed within this short period. For instance, Wilson et al. [30] found that a resistance training program produced about a 15% increase in MVC after just 4 weeks, demonstrating that significant improvements can occur in a relatively brief timeframe. Another study implemented a 6-week resistance training program in older adults (average age 67 ± 5 years) and found that after 6 weeks ofjump training, participants experienced improvements in all neuromuscular measures, comparable to those seen with both traditional and highvelocity resistance training [31]. Based on the evidence discussed, a 4-week intervention could be considered an appropriate duration to observe neuromuscular adaptations in older adults or individuals who have not previously engaged in training. This adaptation might indicate potential benefits from the activation of muscle spindles and inhibition of Golgi tendon organs through jumping exercises [32]. The complex, multi-joint nature of jumping exercises may explain the modest changes observed in isolated muscle testing, as they emphasise coordinated movements across multiple joints rather than isolated joint contractions. Consequently, the transfer of adaptations from jumping exercises to isolated testing scenarios may be limited, resulting in the smaller measurable changes in single-joint strength assessments in the present study. Another possible reason for the lack of significant differences between groups in maximal strength tests could be related to the specificity of the exercise training. In this study, participants engaged in power-oriented movements on a mini-trampoline. These short, explosive, and rapid actions may have contributed to strength gains through the mechanisms previously discussed. However, this form of training may not be sufficient to enhance maximal strength capacity.
The study highlighted significant enhancements in both the 5STST and its derived power output. While traditionally considered a measure of lower limb strength in older adults, the emphasis on performing the task swiftly suggests a reflection of power generation rather than pure strength. Alcazar et al. [19] established a link between lower limb power generation and variables like sit-to-stand time, chair height, body mass, and height. These associations were utilised to calculate sit-to-stand power, a method akin to established power assessments in leg press exercises. The notable advancements in both 5STST performance and power output can be credited to the impacts of mini-trampoline jumping training, with significant progress evident within a mere four-week intervention period. Despite both the training program and the 5STST involving multi-joint movements, their execution varies. The jumping training integrates a propulsive phase where the body leaves the ground, contrasting with the 5STST that necessitates deceleration during the ascending phase. This dissimilarity in movement patterns, particularly the engagement of the antagonist muscle in the subsequent phase of the 5STST movement, hinders maximal body acceleration throughout the entire push-off phase [33]. Nonetheless, the outcomes suggest that the 4-week training regimen was effective in eliciting positive responses in power-based physical performance among older adults.
The study unveiled significant enhancements in dynamic balance ability, as measured by the TUGT. Both the EG and CG displayed noteworthy within-group alterations, albeit with differing results. The EG demonstrated improvement with a large effect size, while the CG unexpectedly increased their completion time compared to baseline. These outcomes were as expected, as the improvement in balance likely stemmed from the compliant surface of the mini-trampoline. Participants had to sustain postural control during the landing phase of jumping, potentially contributing to enhanced balance skills. This discovery is in line with prior research on athletes with ankle instability, which noted enhancements in postural control through the use of a mini-trampoline, even without explosive training [34]. Similarly, a study on older women with osteopenia reported similar TUGT enhancements, though their intervention included jumping as part of a broader program [15]. Another possible explanation is the eccentric nature of the movement, which is crucial for deceleration ability. Previous studies have shown that exercise training that includes eccentric contractions, which involve controlled muscle lengthening under tension, improves dynamic balance [6, 22]. Therefore, the eccentric nature of the movement not only improves power generation but also enhances braking ability, which is a key component of functional tasks such as the TUGT [22].
Regarding gait speed, another vital indicator of physical performance in older adults, the current study did not find significant differences between or within groups for both casual and fastest speeds. This lack of change might be attributed to the baseline speeds in the EG within normal ranges, (casual: 1.18 vs 1.20 m/s; fastest: 1.70 vs 1.72 m/s), suggesting a potential ceiling effect among the healthy older female participants. This differs from a previous study that demonstrated significant gait speed improvements (p < 0.05; 1.46 vs 1.82 m/s) in older women with osteopenia, who were also older than the participants in the current study [15]. Although there were no statistically significant differences in the time spent on the 10MWT or gait speed, our study observed an insignificant trend of improvement in the EG compared to the CG after covariate analysis (the EG took less time and had a faster speed than the CG). This suggests that jumping exercise may potentially benefit the time spent on the 10MWT and gait speed. The cardiovascular responses to jumping exercise may explain the exercise intensity in each session, which could be a reason for the improved 10MWT outcomes [35]. However, based on our preliminary analysis, this is not enough to conclude that jumping exercise can improve 10MWT outcomes, and this point needs to be investigated in a future study with a longer follow-up period.
Limitations
The study is constrained by a small sample size of 19 older female participants. As our study was preliminary and, to our knowledge, there were no similar studies on this specific population, an a priori power analysis to ensure sufficient statistical power was not feasible. Future research should address this limitation by conducting a priori power analyses to determine an appropriate sample size. Another limitation is the absence of post-intervention follow-up, which prevents an assessment of the long-term observational effects. A placebo or motivational bias may have influenced the outcomes in the experimental group, as their continued engagement with the intervention could have influenced the results. However, a notable strength of the study was the 100% participation rate across all sessions, reflecting the high adherence observed in Franchi et al.’s [12] study involving 9 older male participants over a similar short-term period. A potential focus for future research is comparing pure power-based jumping, as utilised in this study, with resistance-based training. Subsequent studies could incorporate an active control group participating in resistance-based training to directly assess the effects of these diverse exercise modalities.
Conclusions
The 4-week mini-trampoline jumping exercise program showed promise for safety and potential benefits for physical performance among older women. The participants tolerated the intervention well, experiencing only mild delayed onset muscle soreness with no other reported adverse events. While the program suggested possible advantages for certain aspects of physical performance, its influence on maximal knee extensor strength remains uncertain and requires further investigation. Future research should prioritise larger, adequately powered, longer-term randomised controlled trials with active comparators to more definitively establish the efficacy of mini-trampoline jumping training. Finally, studies should also explore appropriate periodisation and progression strategies to better understand the potential capacity of this intervention for enhancing maximal strength outcomes in older adults.