
Highlights
– Body weight and bench row strength are significant predictors of 100-m sprint performance. Notably, lightweight athletes were 30.5% slower than their heavyweight counterparts.
– At a distance of 500 m, body weight, bench row strength, and squat strength significantly influenced performance time. Furthermore, female athletes performed 9.2% slower than male athletes.
– For the 2000-m distance, only the weight sub-category and its interaction with sex were found to be significant, favouring heavyweight male rowers.
– Importantly, the performance advantage of heavier and stronger athletes was not sustained over longer distances, as no relevant associations were found at the 6000-m distance.
– The study suggests that training strategies aimed at increasing strength and optimising body composition are essential for success in events up to 2000 m, particularly in the initial 500-m segment.
Introduction
Rowing is a sport renowned for its exceptional kinanthropometric profile, characterised by high lean mass and low body fat [1]. This distinctive physical constitution provides rowers with a significant relationship between muscle strength and lean mass, placing them in a favourable position in terms of absolute anaerobic power (Watts) and aerobic power (VO2max) when compared with their peers from other sports modalities [1–5]. Aerobic power in rowing is primarily defined as the maximal oxygen uptake (VO2max), reflecting the efficiency of oxygen delivery and utilisation during sustained efforts, while anaerobic power refers to the peak power output generated by the phosphagen and glycolytic systems over short durations, which is critical for sprints and race starts [2, 6]. These physiological components are directly correlated with rowing performance, as higher aerobic power supports endurance over 2000–6000 m races, and greater anaerobic power contributes to acceleration and sprinting over shorter distances [2, 4, 5]. Such attributes have been pivotal in establishing rowing as a demanding and highly competitive sport, where the difference between victory and defeat is often measured in fractions of a second [7].
To accommodate the inherent diversity in physical attributes among rowers, World Rowing has strategically subdivided the U-23 (19 to 22 years old) and senior category (23 years old and above) into lightweight and heavyweight subcategories, each with specific weight limits for men and women [7, 8]. In this categorisation, lightweight women in individual boats must not exceed 59 kg, and for team boats, the average crew weight should not surpass 57 kg. Similarly, lightweight men competing in individual boats must stay under 72.5 kg, and the average crew weight in collective boats cannot exceed 70 kg. However, it is noteworthy that this body weight criterion does not extend to the junior categories, encompassing athletes from the lowest age group (up to 18 years of age). This omission potentially leads to the exclusion of adolescent rowers who may have significant potential in the sport.
In addition, body weight is strongly correlates with strength, power, and endurance, as heavier rowers often exhibit greater absolute force production and leverage, contributing to increased stroke power and higher boat velocity, while lighter athletes may benefit from improved relative strength and efficiency, influencing their endurance and technical performance [9–11].
Recent studies have cast light on the kinanthropometric profiles of elite junior rowers, revealing that medallists and finalists in international events tend to exhibit greater mass and stature [1, 12, 13]. Despite these differences, modern rowing boat designs have made strides in addressing these disparities, introducing vessels tailored to accommodate various body weight categories (e.g., F44, 50–60 kg; F15, 65–75 kg; F45, 70–85 kg; F01, 85–95 kg; F47, 90–100 kg; F39, 95–110 kg) [14]. These innovative boat designs aim to level the playing field, enabling relatively lighter athletes to compete effectively in events historically dominated by heavier counterparts [7].
It is essential to recognise that the motivation for relatively lighter and smaller athletes to compete against their heavier counterparts may stem from recent developments in the sport. The decision to eliminate the lightweight category from the 2028 Olympic Games presents a unique challenge, compelling athletes to adapt and compensate for the inherent disadvantage of body weight [15–17]. The reduction of the Olympic rowing distance from 2000 m to 1500 m will shift the energy system demands: race duration will decrease from approximately 6–7 min to 4–5 min, thereby increasing the reliance on phosphagen (ATPPCr) and anaerobic glycolytic pathways, elevating peak blood lactate concentrations, and imposing greater intracellular buffering requirements; concurrently, the proportional contribution of oxidative metabolism will diminish, necessitating revised training periodisation with a stronger emphasis on glycolytic power output, lactate tolerance development, and high-intensity interval sessions while still preserving aerobic capacity [6].
Given the proposed changes to the sport’s competition structure, which will likely impact the development of junior rowing, the present study aimed to analyse the relationship between the subdivisions of body weight and the performance of junior rowers. Therefore, our initial hypothesis was that when considering the subcategories of body weight, heavyweight athletes would produce superior performance across tests of muscle strength and power, as well as aerobic and anaerobic power compared to their lightweight peers. Clinically, understanding these associations may assist coaches, sports scientists, and healthcare professionals in designing individualised training and nutrition strategies that optimise body composition, enhance strength and power, and reduce injury risks, ultimately supporting the long-term development and well-being of young rowers [15, 18].
Material and methods
Study design and participants
This study employed a cross-sectional design and utilised data from 235 national [19] Brazilian rowers (64 females, age 17 ± 1.0, Tier 3), from the under seventeen (U-17, 89 subjects) and the under nineteen (U-19, 146 subjects) categories. The International Rowing Federation subdivides the senior category (U-27) and the master category (> 27 years of age) based on body weight as: lightweight (male < 72.5 kg, female < 59 kg) and heavyweight (male > 72.5 kg, female > 59 kg) [7]. For the purpose of this study, we maintained this body weight subdivision for the U-17 and U-19 categories (junior category) [7].
A priori sample size was determined considering an effect sizes of 0.459 for males and 0.394 for females according to Nobuyuki et al. [20], which assessed the correlation between body weight and lower limb strength in men and women at a similar age range to that of the junior rowing category. We chose this variable to determine the sample size because it reflects the relationship between body weight and muscle strength. In rowing practice, lower-limb strength contributes directly to the propulsion of the boat during locomotion.
Thus, we used the open-source G*Power software (Version 3.0; Berlin, Germany) with the statistical configuration of the ‘T’ family (correlation), assuming a of 0.80 and an < 0.05. The minimum sample size of 32 subjects was determined for males (t: 2.0, power: 0.8) and 45 subjects for females (t: 2.0, power: 0.8). In structuring this research, we adhered to the recommendations outlined in the STROBE reporting guide for observational studies [21].
Ethics and registration
This study was carried in accordance with international ethical standards for sport and exercise scientific research [22]. Data were extracted from a database provided by the Brazilian Rowing Confederation (CBR) with written authorisation from the CBR and approval by the Ethics Committee of the Federal University of Rio Grande do Norte, protocol number #75841023.6.0000.5537. No information that could potentially identify any of the athletes, i.e. CBR registration, names or locations, were assessed. This study’s protocol is registered and publicly available on the Open Science Framework Registries platform, doi: 10.17605/OSF.IO/X26BJ.
Data assessment
Participants were selected from the National Rower Evaluation System [SNAR (in Portuguese: Sistema Nacional de Avaliação do Remo)] database which contains information on anthropometrics (height, wing-span, and body weight), specific ergometric rowing tests (100-m, 500-m, 2000-m, and 6000-m), as well as strength tests (bench row, bench press, squat and deadlift) conducted annually on national-level athletes. Initially, data from 2870 athletes of all age categories were assessed. Subsequently, a selection of athletes between the ages of 15 and 18 years (the junior category) was performed, and data from 573 athletes in the junior category was retrieved. Finally, following screening for inclusion according to the established criteria, the dataset contained the following information: (i) Performance data for 100-m, 500-m, 2000-m, and 6000-m ergometric rowing; (ii) Resting and peak heart rate measurements during the performance at 100-m, 500-m, 2000-m, and 6000-m distances; (iii) Upper limb strength data (bench row and bench press); (iv) Lower limb strength data (squat and deadlift); (v) Height and body weight measurements. Only athletes with complete data available were included. In case of serial data available from different years, we considered the participant’s first SNAR. If data were incomplete, we retained the data from the following year. The data assessment was provided in a double-blind manner, where CBR evaluators were unaware of the investigation, and the athletes were not informed of the research. The variables of body weight, sex, competition category (U-19 and U-17), and body weight sub-division (Lightweight and Heavyweight) were anonymised and transmitted to a blinded researcher who had no prior access to the database. Data from a final number of 235 athletes in the junior category of Brazilian rowers were analysed (see Figure 1).
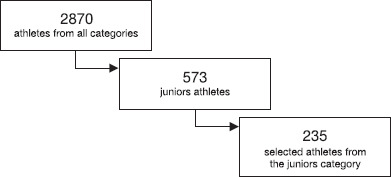
National Rower Evaluation System evaluations
The CBR provided the researchers with information regarding the procedures used during the annual SNAR assessments and establishes guidelines and recommendations for how the tests should be performed; while the clubs’ technical staff are responsible for carrying out the assessments, i.e. anthropometric measurements, sport-specific performance tests, and upper and lower limb strength evaluations. Of note, clubs are allowed to select the tools and adapt the protocols based on their available resources (e.g., equipment models and necessary procedural adjustments).
A week prior to SNAR evaluations, the athletes perform a maximal stress test conducted by a cardiologist for medical clearance and undergo anthropometric measurements, as well as sprint, endurance, and strength tests. The body mass, height, and wingspan are measured with the athletes barefoot and wearing light clothes, using a digital scale, stadiometer, and anthropometric tape, respectively. The CBR recommends that evaluators follow the International Society for the Advancement of Kinanthropometry (ISAK) standard for anthropometric measurements [23].
Two sprint and two endurance rowing tests are performed on an ergometer rowing machine with a 24-h interval in between (details below); and then, after a 48-hour recovery period, two upper limb strength tests (bench row and bench press) and two lower limb strength tests (squat and deadlift) are performed. The protocol details are illustrated in Figure 2.
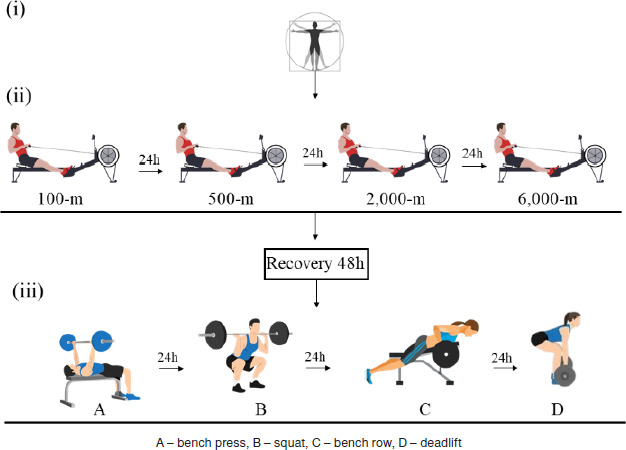
Sprint speed and endurance rowing tests
Prior to the ergometric rowing tests, participants performed a 15 min warm-up rowing at a self-selected intensity. Speed was analysed by means of 100-m and 500-m maximal sprint tests (see Figure 2). And endurance rowing performance was analysed by 2000-m and 6000-m time trials (see Figure 2), in accordance with the CBR recommendation, on ergometric rowing equipment [Concept® model-D equipped with a digital monitor (PM3, PM4, PM5 or a similar one), USA] calibrated according to the International Rowing Federation of Australia specifications of resistance factors based on sex and age for the junior category [male: 120 (Ns2/m2), female: 110 (Ns2/m2)]. At the end of the test, the times in seconds (100 m and 500 m) and minutes (2000 m and 6000 m) are recorded by a computer connected to a digital monitor [8]. The CBR recommends that evaluators monitor participants’ heart rate using short-range radio wave telemetry through a portable device connected to a chest strap. The primary recommendation is to use Polar® equipment (Kempele, Finland); however, there is flexibility to use other similar devices that can be connected to a smartphone to monitor heart rate during the assessments. The recommendation is that exercise intensity be monitored by maintaining peak heart rate above 80% of the maximum heart rate.
In addition, energy expenditure in kilocalories (kcal) was calculated according to the Compendium of Physical Activities, which defines the metabolic equivalents (METs) for different intensities (light, moderate, and vigorous) of activities performed on a rowing ergometer based on the average wattage of each effort [20–26]. Accordingly, the number of kilocalories expended was determined using the standard mathematical model commonly employed by Concept2® rowing ergometers, as follows [27]:
kcal = METs × weight (kg) × time (h).
Upper and lower limb muscle strength
The following description is based on the CBR recommendations: The muscle strength of upper limbs (bench row and bench press) and lower limbs (squat and deadlift), used the following protocol: (i) Initially, each athlete self-selected the load (kg) that he/she considered adequate to perform one maximum repetition (1RM); (ii) Subsequently, after performing the exercise, the athlete informed his/her subjective perception of the load (in light, moderate and heavy); (iii) After informing his/her subjective perception, the CBR evaluator asked if he/she should adjust the load to a higher value; according to the athlete’s answer, 3% of the load was increased or reduced. Each athlete had three attempts interspersed by five minutes of passive rest for the execution of 1RM. The described procedure was repeated for all attempts. When the athlete reached 1RM on the first or second repetition, the test was interrupted and finished. If the athlete could not execute the movement correctly with the initial relative load, the test was interrupted, and the athlete received a 10-min passive rest period to choose a lower subjective load and try again. The specifications of the techniques considered during 1RM testing are available in a previous study [28]. Finally, we divided the 1RM value by the athlete’s body weight (kg) to determine the relative strength values for each test.
Data processing
Body composition
We determined body mass index (BMI) by dividing body weight in kilograms by height in metres squared [BMI = weight (kg) /height (m)2]. To determine fat mass levels (%F) we used the mathematical model proposed by Deurenberg et al. [29]. The model was developed for subjects of both sexes aged between seven and 83 years and consists of:
%F = (1.20 × BMI) + (0.23 × age (years)) – – (10.8 × sex) – 5.4
where: F – fat, BMI – body mass index (kg/m2), and sex – female = 0, male = 1.
To determine the absolute %F values, we divided the final result by 100 and multiplied it by body weight. We then determined the fat-free mass (FFM) levels by subtracting the absolute values of fat mass from body weight. Then, to determine the relative FFM values, we multiplied the absolute values by 100 and divided by body weight.
Biological maturation
The state of biological maturation was assessed as a biological age in years from the attainment of peak height velocity (PHV), termed maturity offset, where 0.0 years equals PHV; a measure of somatic maturation. Years from PHV was predicted using the mathematical models for boys and girls between 8 and 18 years old proposed by Moore et al. [18]:
Maturity offset in males = –7.999994 + + [0.0036124 × (age (years) × stature (cm))]
Maturity offset in females = –7.709133 + + [0.0042232 × (age (years) × stature (cm))]
Participants were classified as pre-PHV (maturity offset < –1.0 years from PHV), circum-PHV (between –1.0 and 1.0 years from PHV), and post-PHV (> 1.0 years from PHV) [18].
Anaerobic and aerobic power
The absolute anaerobic power (in watts, W) during the 100-m, 500-m, 2000-m and 6000-m tests was determined by the rowing ergometer, and the relative anaerobic power per body weight (kg) was subsequently calculated (W/kg). The maximum aerobic power [VO2 (l/min)] was determined using the rowing ergometer according to the following equations [30, 31]:
VO2 (l/min) in males = (1.682 + 0.0097 × × power [W] in ER)
VO2 (l/min) in females = (1.631 + 0.0088 × × power [W] in ER)
where: VO2 – maximal oxygen uptake, ER – rowing ergometer.
Subsequently, relative aerobic power [VO2 (ml/kg/min)] was calculated by dividing absolute aerobic power by the athlete’s body weight, according to the following equation [6]:
VO2 (ml/kg/min) = (VO2 (l/min) × 1000) /body weight (kg)
where: VO2 – maximal oxygen uptake.
Statistical analyses
The normality of the data was tested by the Kolmogorov–Smirnov test, Z-score of asymmetry and kurtosis (–1.96 to 1.96), coefficient of variation being acceptable up to 15% and QQ-line plotting. If the assumption of normality was violated in one of the tests, non-parametric statistics were adopted for data treatment. Thus, the sample was characterised descriptively by medians and interquartile ranges. The Bonferroni correction was applied for all comparisons between groups (Lightweight and Heavyweight). Subsequently, the groups were compared by the U-Mann–Whitney test for independent samples, and the effect size between the differences was verified by the R coefficient considering the magnitude [32]: small, 0.1 to 0.2; medium, 0.3 to 0.4; broad, 0.5 to 0.7; and very broad, 0.8. Correlations between variables were performed by Spearman’s rho coefficient (r) considering the same magnitude previously cited. The 95% confidence interval was calculated for the effect measures.
Subsequently, to examine the factors associated with performance over different distances (100-m, 500-m, 2000-m, and 6000-m), generalised linear models (GLMs) with a Gamma distribution and log link function were used, which are appropriate for modelling continuous and skewed dependent variables (such as race times). Only race time was considered, as it is the most objectively used measure by rowing coaches. The following variables were included as predictors: body weight (kg), fat-free mass (kg), weight subdivision (lightweight vs. heavyweight), sex (male vs. female), interactions between weight subdivision and sex, and 1RM values for the bench row, bench press, squat, and deadlift exercises. The selection of these variables was based on the subsequent analyses. The GLM results were expressed as beta coefficients ( ), prevalence ratios [Exp ( )] with corresponding 95% confidence intervals (95% CI), and p-values corrected using the Bonferroni post-hoc method. The effects were interpreted in percentage terms based on the logarithmic transformation: Exp ( ) < 1 indicates a proportional reduction in race time per unit increase in the predictor. Although the Bonferroni correction reduces the likelihood of type I error, it may increase the risk of type II error. Nevertheless, we chose to use the corrected p-values to maintain a conservative statistical approach, given that the limitations of the data collection protocols in the SNAR database are not clearly specified.
All analyses were performed using the open source JASP® software (Version 0.16.3.0; University of Amsterdam, Holland) considering p < 0.05. All figures were created in the GraphPad Prism software (Version 8.01 (244), California, USA).
Results
The sample was in the post-PHV stage of biological maturation, indicating that both groups were biologically comparable (PHV standard error: lightweight = male [0.08] /female [0.2], Heavyweight = male [0.09] /female [0.13]) (Table 1). The standard error observed for the 1RM tests was below 4.0 in both groups. Specifically: squat = male [1.7] /female [2.8]; deadlift = male [2.1] /female [3.6]; bench press = male [1.1] /female [1.6]; bench row = male [0.9] /female [1.5]. Performance differences between lightweight and heavyweight junior rowers were evident in multiple ergometric rowing tests (100-m, 500-m, 2000-m, and 6000-m), particularly in measures of speed, as well as absolute and relative anaerobic and aerobic power.
Table 1
Sample characterisation
There were no significant differences in peak heart rate between groups across all distances (100-m, 500-m, 2000-m, and 6000-m), for either male and female athletes, indicating similar levels of exercise intensity (100-m: male p = 0.07, female p = 0.09; 500-m: male p = 0.10, female p = 0.07; 2000-m: male p = 0.3, female p = 0.20; 6000-m: male p = 0.30, female p = 0.50).
In male athletes, body weight and strength measures (upper limbs: bench row and bench press; lower limbs: squat and deadlift) were significantly correlated with 100-m and 500-m sprint performance, and 6000-m endurance (Table 2). Additionally, body weight correlated positively with strength in all tested lifts. Among females, similar correlations were observed for body weight and strength measures with 100-m and 500-m performance. It is noteworthy that Table 2 presents only the significant correlations. To view all analyses, we recommend consulting Table S-1, available in supplementary material 1.
Table 2
Correlations of body weight with the performance of male and female junior rowers
[i] 1RM – one-repetition maximum
Data treatment: Spearman’s correlation
Bold – statistically significant at p < 0.05
Table 2 presents only the significant correlations. To view all analyses, please refer to Table S-1 in supplementary material 1.
In males, both fat mass and fat-free mass correlated significantly with 100-m and 500-m sprint performance, and with strength measures (1RM: bench row, bench press, squat). Fat-free mass also correlated with 6000-m performance. Among females, both fat mass and fat-free mass correlated with 100-m and 500-m, while fat-free mass also correlated with 2000-m performance.
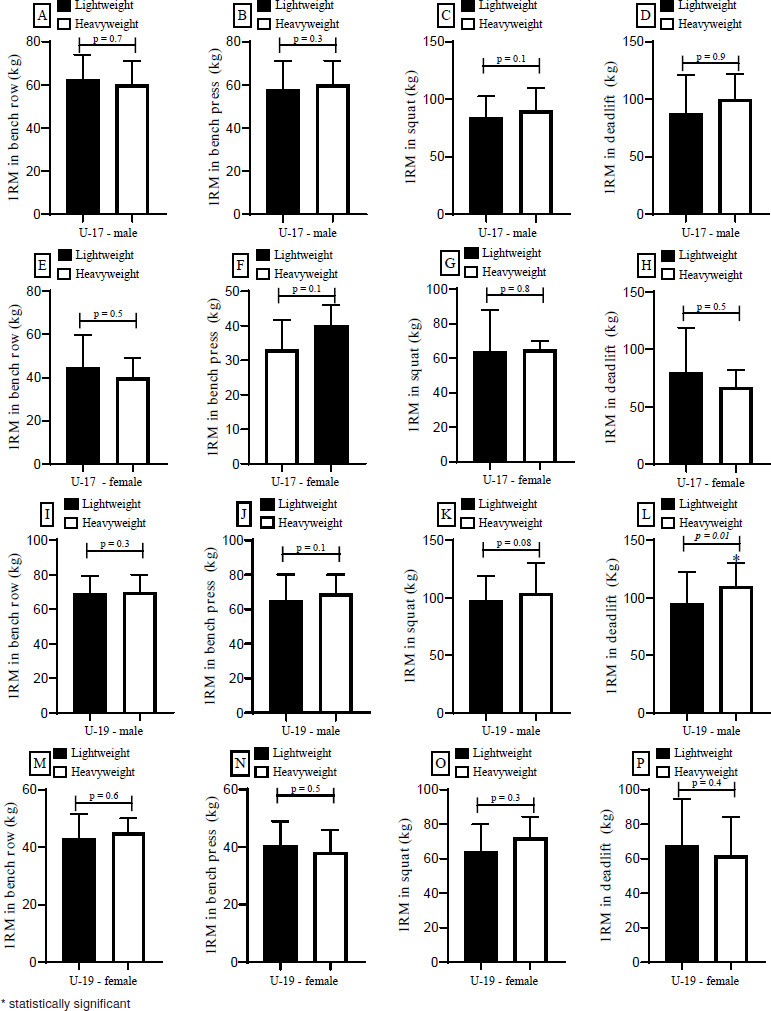
When comparing strength test medians, no significant differences were found between lightweight and heavyweight athletes in the U-17 category for either sex across upper (bench row and bench press) and lower (squat and deadlift) limb strength (Figure 3 A–H). In the U-19 category, male heavyweight athletes showed significantly higher strength in the deadlift (U-statistic = 16.0; effect size = 0.3; 95% CI: 0.0 to 0.5) compared to their lightweight peers (Figure 3 L). Among U-19 females, no significant differences were found in any strength measure (Figure 3 M–P).
Figure 3
Comparisons of subcategories by body weight in relation to performance of muscle strength of upper and lower limbs in U-17 and U-19. 1RM – one repetition maximum. Data treatment: Mann–Whitney U test
Heavyweight athletes generally performed better in ergometric rowing, but group-specific patterns emerged (Table 3):
Table 3
Comparisons of subcategories by body weight in relation to anthropometric profile and ergometric rowing performance
[i] VO2 – volume of oxygen consumption
Data treatment: Mann–Whitney U test
Bold – statistically significant at p < 0.05
Table 3 presents only the significant correlations. To view all analyses, please refer to Table S-2 in supplementary material 1.
– U-17 males: Heavier athletes outperformed in absolute aerobic power [2000-m (U-statistic = 9.0)], and in both absolute/relative anaerobic and aerobic power at 6000-m (U-statistic = 11.0).
– U-17 females: Heavyweights performed better in 100-m (U-statistic = 7.0) and 500-m (U-statistic = 12.0) sprints, 2000-m specific performance, and in both absolute/relative power across multiple distances.
– U-19 males: Heavyweights showed superior absolute anaerobic power [500-m (U-statistic = 9.0), 2000-m (U-statistic= 7.0), 6000-m (U-statistic = 9.0)], relative anaerobic power [500-m (U-statistic = 9.0), 2000-m (U-statistic = 9.0)], and absolute aerobic power [500-m (U-statistic = 13.0), 6000-m (U-statistic =15.0)].
– U-19 females: Enhanced performance was observed for heavyweights in 100-m (U-statistic = 8.0) and 500-m (U-statistic = 8.0) speeds, absolute anaerobic and aerobic power across all distances, and relative aerobic power in the 100-m (U-statistic = 7.5) test.
Regarding body composition, no significant group differences were observed in fat mass or fat-free mass for males (Table 3). However, among females, heavyweights (both U-17 and U-19) had significantly higher absolute and relative fat mass and fat-free mass compared to lightweights [fat (%): U-statistic = 15.0; fat (kg): U-statistic = 9.0; fat-free-mass (%): U-statistic = 15.0; and fat-free-mass (kg): U-statistic = 5.0; Table 3]. It is noteworthy that Table 3 presents only the significant correlations. To view all analyses, we recommend consulting Table S-2, available in supplementary material 1.
The GLM models indicated that for the 100-m distance, higher body weight was associated with a 2.4% reduction in time for each additional kilogram (Table 4). Lightweight category athletes showed 30.5% worse performance compared to heavyweight athletes. Bench row 1RM was also a significant predictor, with a 0.8% time reduction for each additional kilogram (Table 4). Other strength variables, body composition, and sex were not significantly associated. For the 500-m distance, body weight maintained a significant effect, with a 0.3% reduction per additional kilogram. Female athletes performed 9.2% worse than male athletes (Table 4). Performance was also positively influenced by 1RM values in the bench row and squat exercises, with reductions of 0.19% and 0.14% per additional kilogram, respectively. Other variables were not significant.
Table 4
Generalised Linear Models to verify the effects of body weight, body composition and upper and lower limb strength on race time performance for distances of 100, 500, 2000 and 6000 m on a rowing ergometer
For the 2000-m distance, only the body weight sub-category was associated with time (lightweight > heavyweight by 5.9%). A significant interaction between weight subcategory and sex was observed, suggesting that the difference between categories varied according to sex (Table 4). No strength or body composition variables were significant. In the 6000-m model, no significant associations were found between race time and any of the predictor variables analysed (Table 4). It is important to emphasise that, in the GLM models presented in Table 4, no multicollinearity was identified between body weight and fat-free mass (p > 0.5).
Discussion
In this study, we examined how subcategories of body weight affect performance in junior rowers. Our results confirmed our initial hypothesis that heavyweight athletes would exhibit superior performance compared to their lightweight counterparts. There is a strong correlation between body weight and rowing performance in both female and male junior rowers, with heavyweight athletes outperforming lightweight ones, even after adjusting for body size. Further, a strong correlation between upper and lower limb strength and rowing performance was also observed, particularly among male athletes.
Aligned with our findings, research by Majumdar et al. [9] demonstrated an association between body weight and performance in the 2000-m ergometric rowing test, which was attributed to the biomechanics of rowing. According to Kleshnev [10], body weight plays a crucial role in rowing biomechanics by facilitating leverage through synchronised ankle, knee, hip, and trunk extension. Such synchronicity results in the effective transfer of body weight, enhancing the initial acceleration and overall speed of the boat. So, rowers with refined techniques can optimise their body weight to elevate their on-water performance.
Moreover, the generalised linear models adjusted with a gamma distribution and log-link function (Table 4) revealed that body weight was negatively associated with 100-m and 500-m times, indicating that heavier athletes tend to perform better at shorter distances. For instance, each additional kilogram was associated with a 2.4% reduction in 100-m time and a 0.3% reduction in 500-m time. Conversely, in longer distances (2000-m and 6000-m), no significant effect of body weight was observed, suggesting that its influence diminishes as the aerobic component becomes more prominent.
Significant sex differences were also found for the 500-m time, with female rowers performing 9.2% slower than males on average (Table 4). Strength indicators such as 1RM in bench row and squat were also relevant: each 1 kg increase in Bench Row was associated with a 0.19% and 0.8% reduction in 500-m and 100-m times, respectively, highlighting the importance of pulling strength for sprint performance. It is noteworthy that the 1RM data in the present study showed a standard error greater than 1.0 kg for both sexes, which requires caution when interpreting the findings related to the 1RM analyses.
Our findings underscored a possible influence of biological maturation on this relationship, regarding that early-maturing rowers experience more rapid increases in body mass and size than their late-maturing peers [11]. A longitudinal study by Almeida-Neto et al. [33] further supports this thesis by demonstrating that advanced biological maturation is associated with increased muscle power in junior rowers of both sexes. Moreover, this maturation-driven progression also correlates with heightened levels of anaerobic enzymes (e.g., lactate dehydrogenase, creatine kinase, and adenylate kinase), which favour muscle power performance [34].
In our sample, although both lightweight and heavyweight athletes were post-PHV, heavyweight athletes reached PHV approximately nine months earlier than lightweight athletes (Table 1). This suggests a maturation advantage that may translate into transient performance benefits, especially during early adolescence. Such findings reinforce the notion that early biological maturity may confer competitive advantages in junior categories. However, the estimation of biological maturity using prediction models carries inherent uncertainty. The PHV estimate model applied in this study has a known standard error (± 0.57 years), which can affect precision in individual-level interpretation [11, 28]. In our study, the standard error of PHV ranged from 0.08 to 0.13, which falls within the standard error margin previously reported in the literature (0.57).
This limitation should be considered, particularly when comparing groups with close maturation values. Another important methodological consideration involves the secondary nature of the data analysed. Because the SNAR database is populated with information collected by various rowing clubs under different logistical constraints, the assessment protocols may have varied. This heterogeneity (especially in the execution of the strength, anthropometric, and ergometer tests) may introduce inter-club or inter-evaluator biases. Although CBR provides methodological guidelines, the extent of adherence by different teams remains unclear. This variability should be acknowledged as a limitation and treated with caution during the interpretation of the results.
In addition, the VO2max values used in this study were derived from a predictive equation validated for adults, not adolescents. Although widely used, the adaptation of this model for junior populations is questionable, particularly due to differences in metabolic efficiency, ventilatory thresholds, and body composition [6]. Therefore, the interpretation of absolute and relative VO2max values in this context should be cautious, and conclusions regarding aerobic capacity should not rely solely on these estimates. We strongly recommend that future studies employ direct measurement methods tailored for adolescent populations.
In agreement with the literature, body weight continues to explain a significant portion of power and speed performance among junior post-PHV rowers [35]. This reinforces the relevance of including body weight as a selection criterion for talent identification and long-term development programs. For example, Winkert et al. [12], who conducted a retrospective investigation involving 910 former elite rowers from the German national junior team and reported that male rowers with higher body weights are more likely to pursue long-term careers in rowing.
Further evidence on the importance of morphology for performance is provided by Larochelambert et al. [36], who emphasised in their discussion on the significance of morphology for rowing performance that rowers with smaller body sizes and lighter body weights tend to perform more poorly in single scull boats. Further, Perić et al. [37] examined boat speed dynamics in actual rowing conditions and pinpointed a strong association between boat speed, power generation, and the average force exerted by rowers. They also highlighted the prevalence of higher body weight and larger body size among elite rowers when compared to sub-elite categories.
Previous studies have shown that among elite rowers (adult males and females), heavier athletes still maintain a performance advantage even after adjusting the data for body weight [36]. Secher’s [2] pioneering study in 1983 shed light on the biomechanical advantages of rowers with greater height, wingspan, and body mass. Such advantages enable these rowers to create more efficient mechanical levers for handling oars and helmsmen, ultimately enhancing boat speed. Furthermore, the predominance of the mesomorphic somatotype component among rowers suggests that higher body weight is primarily due to increased lean mass [38–41].
Our models confirmed this by showing that fat-free mass (FFM) was not independently associated with performance in any distance once total body weight was controlled for (Table 4), indicating collinearity or masking effects between lean mass and total mass. It is important to highlight that the predictive model used to estimate FFM was based on body mass index (BMI), which represents a significant limitation. Therefore, caution is warranted when interpreting the findings related to FFM prediction in the present study. However, raw differences in relative power and absolute power between groups (see Table 2) clearly favoured the heavyweight athletes. This reinforces the importance of integrating morphological and functional indicators (e.g., lean mass and strength tests) in talent identification.
Practical applicability
Our findings offer practical value to coaches and sports scientists working with junior rowers. The evidence supports the strategic use of body weight classification in long-term athlete development programs. Coaches may consider that heavyweight athletes show a higher probability of success, particularly at younger ages and in shorter race formats. Nonetheless, they must remain cautious when using body weight or anthropometric data for early talent identification, given the influence of transient maturation advantages and the associated risk of misclassification.
From a performance standpoint, the results indicate that heavyweight rowers have a clear advantage in distances up to 500-m, likely due to their superior absolute power and stroke force. For lightweight athletes, compensating for this disadvantage requires specific training strategies, including: (i) developing higher relative strength through targeted resistance training, (ii) emphasising stroke rate optimisation to offset lower stroke power, and (iii) improving technical efficiency to maximise boat speed with less absolute force production. Interval training focused on anaerobic power and lactate tolerance may also help lightweight rowers close the performance gap in shorter races.
The recent decision to discontinue the lightweight category and reduce the Olympic race distance to 1500 m by 2028 introduces a new challenge. This change may benefit heavier and taller athletes, as suggested by previous projections [16, 17]. Even so, lighter and average-statured junior rowers should not be discouraged from pursuing competitive rowing careers.
Another practical implication involves sex-based performance differences. Female rowers performed approximately 9% slower than males in 500 m trials, which has implications for the formation of mixed boats (e.g., one male and one female athlete). These findings suggest that optimising mixed-crew pairings requires careful matching of technical proficiency, relative power output, and stroke synchronisation between male and female rowers to minimise performance gaps and enhance boat balance and efficiency.
To support equitable development across all morphotypes, strategies should include improving aerobic capacity, optimising rowing mechanics, increasing relative strength and power, and promoting lean mass gains over time. These factors consistently correlate with success at the international level [42–46].
In summary, our study highlights the importance of considering body weight subcategories in rowing, especially in the junior categories. Furthermore, we stress the importance of considering athletes’ biological maturation in training prescriptions, especially for those who are pre- and circum-PHV [28, 33]. To assist coaches and trainers in trying to minimise the differences between lightweight and heavyweight athletes competing in the same category, we have included training prescription suggestions for light rowers in supplementary file 2.
Limitations and future suggestions
This study has some limitations: (i) Heterogeneity in the assessment procedures across rowing clubs may have compromised the standardisation and internal validity of the SNAR data; (ii) The use of predictive models to estimate aerobic capacity and biological maturation may limit the precision of the analyses; direct measurement methods are preferable in future research; (iii) The VO2max predictive equation applied is validated for adults, but not adolescents, which limits the applicability of this variable in the current study; (iv) The 1RM tests showed a mean standard error above 1.0, which requires caution in interpreting the findings (this outcome may be attributed to the heterogeneity of the procedures adopted by SNAR); (v) The absence of longitudinal data restricts the capacity to infer whether body weight maintains predictive value across later developmental stages.
Future studies should address these limitations through longitudinal designs that include direct measures of aerobic and anaerobic capacity, biological age assessments, and controlled testing protocols across clubs. We also recommend that the Brazilian Rowing Confederation improve procedural standardisation and consider incorporating direct assessments into future SNAR evaluations.
Conclusions
In conclusion, this study demonstrated that body weight plays a decisive role in the performance of junior rowers, particularly in short- and middle-distance efforts. Heavyweight athletes outperformed their lightweight counterparts in 100-m, 500-m, and 2000-m ergometer tests, and exhibited greater upper- and lower-limb strength, highlighting the importance of absolute strength and mass for rowing performance. In contrast, this performance advantage was not observed in the 6000-m test, indicating that the influence of body weight diminishes as the aerobic component predominates. Furthermore, bench row and squat strength emerged as key predictors of sprint and middle-distance performance, reinforcing the relevance of developing both upper- and lower-limb pulling and pushing capacity in junior rowers.
These findings underscore the value of considering body weight subdivisions for talent identification and training strategies in junior categories. They also highlight the need for individualised approaches that optimise strength, body composition, and rowing technique to ensure equitable competitive opportunities across different morphotypes. Importantly, with the elimination of the lightweight category and the reduction of race distance in the upcoming Olympic Games, coaches and sports scientists must adapt their long-term development plans to address these evolving physiological and competitive demands.
Declaration of data availability
The database for this study is publicly available at https://figshare.com under the doi: 10.6084/m9.fig-share.20481129. Supplementary files 1 and 2 are available at https://figshare.com under doi: 10.6084/m9.figshare.25201211. The supplementary materials can also be accessed via the direct link: https://doi.org/10.6084/m9.figshare.25201211. The protocol for this study is available at: https://osf.io/x26bj/?view_only=f14db6609c724736951c464151ece66b.