Introduction
Volleyball is widely played worldwide and is recognised as a popular sport among young athletes [1]. Although volleyball is considered a safe sport [2], it involves high-intensity physical demands, such as sudden changes in direction and landing after jumps, which may increase the load on the musculoskeletal system and elevate the risk of injury [3]. The American Academy of Pediatrics [4] also supports this view, warning that the continuous execution of specific motor performances (e.g., repeated spiking and blocking) during young athletes’ growth and development process may lead to unbalanced movement patterns. These repetitive movements, essential for achieving peak athletic performance, can increase musculoskeletal loading, resulting in biomechanical and neuromuscular alterations, predisposing athletes to acute and overuse injuries [5, 6]. Indeed, studies examining the epidemiology of injuries in young volleyball players emphasise that the most common injuries occur in the lower extremities [7–10].
Several factors influencing lower extremity injuries in young volleyball players can be identified at this point. For instance, sudden changes in direction and jump-landing mechanics, which pose an injury risk, can lead to excessive stress on the knee and ankle due to insufficient neuromuscular and postural control as well as inter-limb asymmetries, ultimately resulting in injuries [11–13]. Recent evidence in female volleyball players confirms that ankle joint function is closely linked to postural control capacity, further highlighting the role of these factors in injury susceptibility [14]. It has also been suggested that biomechanical differences in female athletes may contribute to such injuries [15, 16]. Moreover, early specialisation in sports is considered one of the negative factors that may contribute to injury occurrence [17, 18]. Research demonstrates poor movement quality and established asymmetries between young volleyball players’ left and right body sides. These functional limitations and imbalances are emphasised as factors that may reduce performance and increase injury susceptibility in young volleyball players [19]. Therefore, predicting sports injuries in young athletes is crucial [20], highlighting the importance of revising training plans accordingly.
In this context, the FMS, recognised as a popular tool in the development of preventive programs, is widely used by sports scientists and coaches to assess injury risk and functional movement capacity [21–24]. Studies have demonstrated that FMS is reliable for evaluating movement quality [25–28]. Studies conducted on young volleyball players highlight that low FMS scores may be an identifiable risk factor for injuries and that preseason FMS assessments can be valuable in identifying athletes susceptible to musculoskeletal injuries [29]. FMS is a valuable tool for predicting sport-specific physical performance outcomes and implementing measures to help young volleyball players avoid the injury cycle. However, studies examining the relationship between FMS and components of physical performance argue that FMS alone is insufficient for predicting physical performance. Instead, they recommend combining FMS with sport-specific performance tests to meet individual athlete needs and the specific demands of the sport [30–32]. Moreover, research on training load distribution in elite youth volleyball highlights how physical conditioning and technical-tactical demands interact across macrocycles, underlining the importance of integrating both monitoring and performance assessment tools [33]. However, it should be noted that FMS is a tool that will allow you to estimate only a subset of the risks associated with the occur-rence of injury. This is because a holistic view of the factors influencing injury will contribute to more accurate results. For example, psychological and neuroendocrine stressors that influence movement quality, coordination, and vulnerability to injury should also be assessed. Rossi et al. [34] provide important insights into how performance anxiety, hormonal responses, and team dynamics affect the performance of adolescent female volleyball players.
A literature review reveals that while there are studies evaluating the effectiveness of FMS in assessing movement quality and injury risk in volleyball players, research investigating the impact of sport-specific physical and motor performance outcomes on FMS remains limited. Therefore, this study aims to determine the relationship between the composite FMS score and the physical and motor performance components that play a key role in the success of young volleyball players [35, 36]. Study results provide valuable data for developing injury prevention programs that young players and strength coaches should uti-lise. Additionally, by offering new insights into the relationship between FMS and sport-specific physical performance, this study could facilitate a more informed approach to maintaining optimal performance levels among young athletes. At this point, the study aims to examine how physical and motor performance elements affect FMS in young volleyball players and contribute to a more comprehensive evaluation of athletes regarding optimum performance and injury risks.
Material and methods
Participants
The participants were a total of 41 young female athletes aged between 11 and 13 years old who were training and participating in competitions in the volleyball branch of a sports club. The sports club is located in Tekirdag Province in western Turkey, and the study started in June 2023. The average number of weekly training sessions for the participants was 2 sessions. They also play one match a week during the competition periods. Training routines include programs to improve volleyball skills and general fitness levels. All the volleyball players had been practicing volleyball for more than 1 year. The inclusion criteria for the study were: (a) playing volleyball for at least 1 year; (b) typically developing children; (c) participants should not be using any medication; and (d) absence of any cardiovascular, neurological, orthopaedic, or psychiatric illnesses. The inclusion criteria were determined by filling out an informed voluntary consent form after explaining the study procedure in detail to all the participants and their parents. Participants who did not meet the criteria were excluded from the experimental procedure, as were those who initially joined the research but could not continue because of illness or absenteeism during the research process.
Procedure
All measurements were performed during the off-season, summer period, after the volleyball players’ competition period was completed. All measurements were performed throughout the two sessions. All tests were performed by the researchers in the training hall where the volleyball players practiced. Due to the nature of the study, the investigators and analysts, but not the participants, were blinded. In the first session, demographic characteristics such as age, sex (to confirm eligibility), and medical history were recorded. The researchers provided the participants with theoretical and practical explanations of the test and measurement protocols. Anthropometric measurements, including height and body weight, were also recorded. Subsequently, motor competence tests were performed sequentially, namely balancing backwards, jumping sideways, moving sideways, and eye-hand coordination tests (KTK3+). In the second session, the physical and functional tests were conducted. These included balance performance measurements, an agility test (pro-agility), a CMJ test, and an FMS test. The tests were performed on the participants in the same order and by the same researchers, who had considerable experience with the testing and measurement protocols. Before assessing the physical and functional tests, a standard warm-up consisting of 5 min of jogging and 5 min of dynamic stretching was performed.
Instruments
Body composition assessment
The participants’ height (m) was measured using a portable stadiometer (Mesilife 13539, Istanbul, Turkey) with an accuracy of 0.1 cm. The participants’ body weights were quantified in kilograms to a precision of 0.01 kg utilising a digital scale (PoloSmart PSC05 Mood Glass, Istanbul, Turkey). Body mass index (BMI, kg/m2) was calculated by dividing body mass (kg) by body height squared (m2).
KTK3+ test battery
The modified KörperKoordinationstest für Kinder (KTK3+) test battery, supported by a hand-eye coordination task, was used to assess the children’s motor competence [36–39]. The KTK3 measures general gross motor coordination [40]. By adding a throwing and catching task to the KTK3 test form, a KTK3+ test battery covering three fundamental motor skill domains (movement, balance, and object control) was developed [36, 38]. The KTK3+ test included balancing backwards (BB), movement sideways (MS), jumping sideways (JS), and hand-eye coordination tasks (EHC). All test items demonstrated good test-retest reliability: BB = 0.80, MS = 0.84, JS = 0.95, and EHC = 0.87 [41–43].
Countermovement jump test
Vertical jump performance was measured using an accelerometer (iVMES Athlete; Ankara, Turkey). The device was attached to a belt and positioned vertically on the participant’s waist. All participants were instructed to avoid involuntary movement in the vertical plane during jumps, which could affect the jump height. During the test, participants were encouraged to jump as high as possible. The test was conducted twice with a 30-second rest between trials. The highest jump measurements from the two test trials were used in the statistical analysis [44].
Balance tests
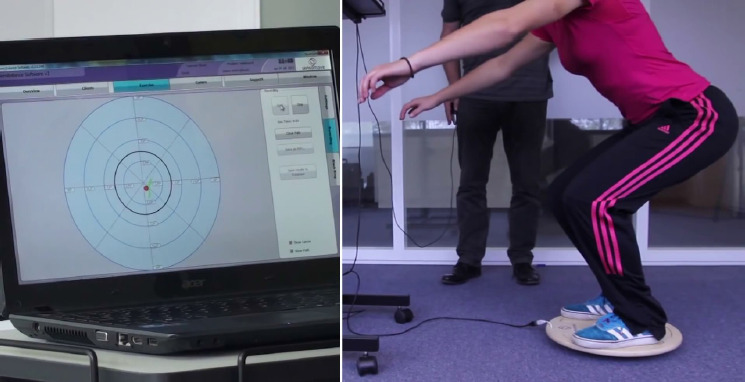
Balance was assessed using a moveable platform (Sensbalance MiniBoard; Sensamove®, Utrecht, The Netherlands), which provides an interactive training tool. While on the balance board, the participant was required to bring or hold the ball in the position required by the measured balance variable on the screen for 30 s. It was examined twice while completing two balance tasks under two conditions. The first task required the participant to hold the ball steady at a specific position shown on the screen; during this, the MiniBoard could tilt approximately 10° in all directions (static balance). In the second task, the participant was expected to move the ball to a new specified position while maintaining balance on the MiniBoard (dynamic balance). The MiniBoard is a sturdy wooden piece of equipment designed to enhance the complexity of balance challenges and is capable of multi-directional or bidirectional tilting. The posture during the balance test measurement and the screen display during the test are shown in Figure 1. First, the device uses innovative, non-invasive technology for real-time data recording. It offers storage in the form of notepad data files (e.g., human-readable text files or CSV), Excel files, and graphical files. The apparatus makes it possible to perform tests on static and dynamic balance and ankle joint mobility [45]. The balance device automatically calculated the scores of the static and dynamic balance performances of the participants as percentages and is a validated tool. There are many studies in the literature using the tool [46, 47].
Pro-agility test
The Pro-Agility Test (also known as the 20-Yard Shuttle) is designed to measure quick directional changes and acceleration. Three markers (cones) were used in this study. The central marker was positioned at the starting line. Two additional markers were placed at a distance of five yards (4.57 m) on either side of the central marker. Telemetric chronometer sticks (Sinar Fotocell, Karabuk, Turkey) were set up at the central starting line to accurately measure the time elapsed during the test. At the start, they touched the marker on the right side first, followed immediately by touching the marker on the left side. The test was concluded when the participant passed the starting line. The time for the entire sequence (right marker →left marker →back to the start) was measured using the telemetric chronometer system, ensuring precise measurement of the elapsed time. All measurements were performed twice. A rest interval of 2–3 min was provided between measurements, and the shortest time (in seconds) of both measurements, with seconds representing the unit and its accuracy, was used in the analysis [48]. The calibration of the photocell was checked by the researchers before the test started.
Functional Movement FMS Test Protocol
The Functional Movement Screen (FMS)™ system, developed by Gray Cook, Lee Burton and Keith Fields, is a system used to determine potential injury risk in athletes and the quality of individuals’ movement patterns, to assess poor neuromuscular control and to improve athletic performance. This screening system attempts to allow expert-guided assessment of an individual’s basic movement patterns. Such a screening system can also provide an important tool to help predict injury or determine readiness to return to sports following the completion of rehabilitation after surgery [49]. The Functional Movement Screening test consisted of seven different basic movements (deep squat, hurdle step, single-line step, shoulder mobility, active straight leg raises, trunk stability push-up, and rotation stability). The scoring criteria for each movement are presented in Table 1. Scoring for an FMS consists of four possibilities. Scores range from zero to three, with three being the best possible score. The maximum FMS score was 21. Individuals scoring below 14 points may be at risk of disability. The FMS composite score demonstrated moderate to good interrater and intrarater reliability, with acceptable levels of measurement error. The measures of reliability and measurement error were similar for both the intrarater reliability, which repeated the assessment of the movement patterns over a 48–72-hour period, and the interrater reliability, which had 2 raters assess the same movement pattern simultaneously. The interrater agreement of the FMS component scores was good to excellent for the push-up, quad-ruped, shoulder mobility, straight leg raise, squat, hurdle, and lunge [50].
Table 1
Description of FMS and scoring system [51]
Statistical analysis
The dataset was first examined for erroneous values, outliers, and multicollinearity in the data analysis process. No incorrectly entered data were observed during this process. The SPSS 25 statistical package (IBM Corp., Armonk, NY, USA) was used for data analysis. In addition to descriptive statistics, normality analyses of the distributions were assessed using kurtosis and skewness tests. Since the assumptions of normal distribution were met, parametric tests were applied. The effect of physical and motor performance on functional movement capacity was analysed using a multiple linear regression analysis. FMS total scores were defined as the dependent variable, while physical and motor performance elements were defined as independent variables. The significance of the results was established at p < 0.05.
Results
Demographic, anthropometric, and sports information of the participants were detailed. The participants’ mean age was 12.90 ± 1.07 years, their average height was 157.00 ± 0.06 cm, and their mean body weight was 50.54 ± 14.06 kg. The average BMI was calculated as 20.20 ± 4.83 kg/m2. The participants’ mean sports experience was 3.30 ± 1.99 years, while their volleyball-specific experience averaged 1.38 ± 0.54 years, as presented in Table 2.
Table 2
Descriptive data on participants’ age, anthropometric characteristics, sports experience, and volleyball experience
| Variable | n | Mean | SD |
|---|---|---|---|
| Age (years) | 41 | 12.90 | 1.07 |
| Height (cm) | 41 | 157.00 | 0.06 |
| Body weight (kg) | 41 | 50.54 | 14.06 |
| BMI (kg/m2) | 41 | 20.20 | 4.83 |
| Sports experience (years) | 41 | 3.30 | 1.99 |
| Volleyball experience (years) | 41 | 1.38 | 0.54 |
Figure 2 presents the distribution of the standardised residuals obtained from the regression analysis. The histogram demonstrates an approximately bell-shaped and symmetrical distribution around zero, indicating that the residuals are close to normality. The mean of the standardised residuals was –2.16E–15 ( 0) and the standard deviation was 0.894 (n = 41), further supporting the suitability of the model. Overall, these findings suggest that the normality assumption was met.
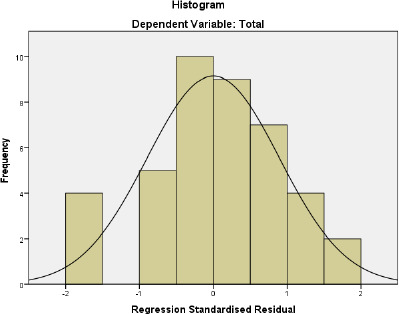
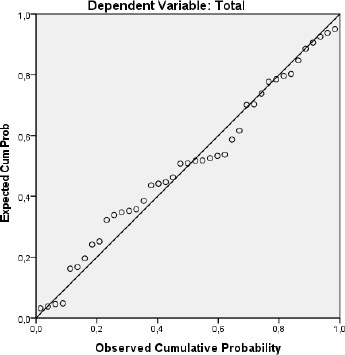
Figure 3 shows that the data points are largely gathered around the diagonal line in the Normal P-P Plot graph, which evaluates the conformity of the standardised residuals of the regression analysis to the normal distribution. This indicates that the model residuals are close to a normal distribution. Therefore, the assumption of normality of the residuals, which is one of the basic assumptions of regression analysis, is largely met. This finding is an important statistical indicator supporting the validity of the model.
When examining the multiple linear regression analysis results for predicting FMS, as shown in Table 3, it was determined that the agility, CMJ, and KTKMS parameters had a significant relationship with FMS (R = 0.780, p < 0.05). These variables together explain 60% of the variance in FMS. Additionally, agility ( = –0.369, p < 0.05), CMJ ( = 2.825, p < 0.05), and KTKMS ( = 2.242, p < 0.05) were found to be significant and positive predictors of FMS. Based on the stand-ardised regression coefficients ( ), the order of importance of the predictor variables on FMS was determined as CMJ, KTKMS, then agility.
Table 3
Multiple linear regression analysis results for predicting functional movement capacity based on physical and motor performance
On the other hand, when the multiple linear regression analysis results for predicting FMS were examined, it was found that static balance, dynamic balance, KTKBB, KTKJS, and KTKEHC did not show a significant relationship with FMS (R = 0.780, p > 0.05). Accordingly, static balance, dynamic balance, KTK BB, KTKJS,and KTKEHC were not identified as significant predictors of FMS.
Table 4 shows the skewness and kurtosis values related to the normality analysis. Since the skewness and kurtosis coefficients of the scales are between –1.5 and +1.5, it is determined that the distribution is normal [52].
Discussion
This study aimed to examine the extent to which physical and motor performance can predict the FMS score, a crucial indicator of movement ability and injury risk in young volleyball players. While previous research has primarily explored the relationship between FMS and physical performance components, this study contributes to the limited body of literature investigating the combined effects of physical and motor performance variables on FMS. Given the physical demands of volleyball, it was hypothesised that superior physical and motor performance in young players would positively influence FMS and, consequently, reduce injury risk.
The findings revealed that agility, CMJ, and KTKMS were significant predictors of FMS, explaining 60% of its variance. Specifically, CMJ had the strongest predictive value, followed by KTKMS then agility. These results suggest that enhancing these physical and motor performance components in young volleyball players could improve movement efficiency and potentially lower injury risk. In contrast, static balance, dynamic balance, KTKBB, KTKJS, and KTKEHC did not show a significant relationship with FMS, indicating that these variables may play a less critical role in determining functional movement capacity in this population.
These findings align with previous studies emphasising the importance of agility and vertical jump in volleyball performance. Agility, defined as the ability to rapidly change direction in response to a stimulus [53], and vertical jump, which reflects lower-body strength and explosive power [54], have been identified as key determinants of athletic success in volleyball [35]. Furthermore, prior research has demonstrated that lower extremity strength and neuromuscular control are critical for injury prevention in volleyball players, reinforcing the significance of CMJ and KTKMS in predicting FMS [55, 56].
Volleyball requires athletes to perform motor movements quickly and flexibly through optimal neuro- muscular control to change directions suddenly and execute controlled landings for multiple jumps [55]. These demands fluctuate across training and competition weeks, as shown by studies on within- and between-week variability of internal and external load in elite volleyball players, reinforcing the importance of precise load monitoring [57]. In young athletes, a lack of these abilities or insufficient training can lead to increased inter-limb asymmetries and rapid onset of neuromuscular fatigue, thereby increasing the risk of musculoskeletal injuries [56–59]. A study by de Azevedo Sodré Silva et al. [8] examining the epidemiology of injuries in young volleyball players found that lower extremity injuries were the most common, with the ankle and knee being the most affected regions. Various literature reviews emphasise that volleyball players’ on-court positions and the high-level movements inherent to the game, such as agility and jumping, are key factors contributing to the increased incidence of lower extremity injuries [7, 9, 10]. Furthermore, a study by Fort-Vanmeerhaeghe et al. [59] demonstrated that excessive inter-limb asymmetries and low vertical jump capacity were indicators of increased injury incidence in young team sport athletes.
The findings indicate that enhancing key physical and motor performance elements, such as agility and vertical jump, improves performance in young volleyball players and helps reduce injury risk. However, the lack of a significant relationship between physical and motor performance components, such as static and dynamic balance, and FMS aligns with previous studies investigating the relationship between physical performance and FMS, showing that FMS alone may not be sufficient to predict athletic performance in athlete populations. Therefore, FMS should be utilised alongside other testing and analysis methods to address sport-specific demands and ensure a more comprehensive evaluation [30–32].
This study presents some limitations. One of them is the cross-sectional design, which prevents establishing causal relationships between physical and motor performance components and functional movement capacity. Additionally, the sample consisted exclusively of young female volleyball players, limiting the generalisability of the findings to male athletes or players from different age groups and competitive levels. Another constraint is the reliance on FMS as the sole measure of movement capacity, as incorporating additional biomechanical or neuromuscular assessments could provide a more comprehensive evaluation. Another limitation of the study is the lack of a G*power analysis in determining the sample group size. Future research should consider longitudinal designs and a broader range of performance metrics to explore the relationship between physical attributes and functional movement in volleyball players in more depth.
Conclusions
The combined effect of agility, vertical jump, and KTKMS movement patterns – closely related to volleyball-specific movements – emerged as a significant predictor of functional movement capacity in young volleyball players. These results highlight the importance of developing these physical and motor performance components to enhance movement efficiency and potentially reduce injury risk. Given that volleyball involves frequent multidirectional movements, explosive jumps, and rapid transitions, optimising these attributes may be particularly beneficial for improving overall athletic performance. This insight can be valuable for athletic performance specialists and coaches in designing targeted training programs that emphasise agility, power, and coordination to enhance both performance and injury prevention strategies.