Introduction
The contrast resistance training method is a subset of complex training, where both traditional highload and low-load (ballistic) resistance exercises are performed within a single session in a set-by-set format [1, 2]. Using two exercises with distinctly different loads and velocities (including the intended velocity) [3] at which they are performed may target a vast portion of the force-velocity curve [2]. For example, a high-load, low-velocity exercise may primarily target the force component, while a low-load, high-velocity exercise may primarily target the velocity component [4]. Additionally, high-load exercises may induce post-activation performance enhancement on the latter low-load exercise, when performed in a set-by-set format [1]. Moreover, contrast resistance training may improve the physical performance of different populations (e.g., field hockey, physically active adults, soccer) [5–7], with varying levels of strength [8], and based on sex [9]. Contrast resistance training seems particularly effective to improve soccer players’ linear sprint speed, vertical jump height, change of direction speed (CODS) [10], and maximal strength [11], which are key surrogate traits for soccer performance and success [12, 13].
It is noteworthy that most published studies conducted on soccer players have used dynamic high-load resistance training exercises during contrast resistance training [10, 11]. However, isometric high-load training exercises might also be effective, and more logistically sound, when compared to dynamic high-load exercises during contrast training [2]. Indeed, physical education students improved countermovement jump (CMJ) height and maximal strength after isometric leg press contrast training using two different joint angles (no control group) [14]. Basketball players (age, ~8 y) improved CODS, CMJ height, drop jump reactivity, linear sprint speed, and squat jump height after isometric (holding) contrast resistance training compared to a control group [15]. In a review, Lum and Barbosa [16] reported lower fatigue and greater joint angle-specific strength, linear sprinting speed, and jump height performance after isometric compared to dynamic resistance training. Garcia-Pinillos et al. [17] recruited male soccer players (age, ~15 y) during 12 weeks of contrast resistance training using body mass-based isometric high-load exercises, and reported improved CODS, CMJ height, and soccer ball kicking velocity when compared to a control group.
Although isometric high-load training improved physical performance when compared to a control condition (e.g., standard sport-training only), including groups of physical education students [14], youth basketball players [15], and youth soccer players [17], the effects of high-load isometric versus high-load dynamic contrast resistance training on adult highly trained soccer players’ physical performance are under-researched and yet to be confirmed. Moreover, results can vary in participants practicing other sports, with different ages, years of experience, and/or sport levels [18, 19]. Indeed, youth team sport players can experience variability in proportionality between concentric and isometric muscular force from a young age [13]. Considering that most studies to date seem to involve youth team sport athletes [15, 17], it may be risky to extrapolate findings to adult highly trained soccer players. Therefore, this study compared the effects of high-load isometric versus high-load dynamic contrast resistance training on adult soccer players’ physical performance. Although physical performance assessment involves mainly dynamic actions, the authors hypothesised improvements in soccer players’ physical performance with high-load isometric contrast resistance training, even with a similar magnitude when compared to highload dynamic contrast resistance training [14, 16].
Material and methods
Design
The study was designed according to the CONSORT guidelines for randomised controlled trials and registered on the OSF platform (DOI: 10.17605/OSEIO/QUDXJ). A two (within-subject, pre- and post-intervention) by three (between-group; isometric contrast resistance training, dynamic contrast resistance training, and control group) study design was used to compare the effects of the training interventions on the physical performance of highly trained soccer players during the off-season period. The assessment sequence during baseline and post-intervention was kept the same, and conducted at similar times of the day, with ≥ 48 h of rest between testing sessions, and from the most recent training session.
Participants
The participants were explained the benefits and risks of the intervention, and the participants then signed informed consent forms.
The eligibility criteria for inclusion were (i) ≥ 2 years of experience as a highly trained/Tier 3 [20] soccer player, (ii) availability to attend all familiarisation, testing (i.e., pre- and post-intervention), and training sessions; (iii) aged ≥ 18 years; (iv) previous experience with resistance training. Participants were excluded if they (i) had any record of recent injuries that could limit their performance, (ii) did not attend ≥ 80% of the training sessions. Initially, 105 male soccer players were recruited for the study using a snowball sampling method. Thereafter, participants were randomly assigned to three different groups using a 1:1:1 allocation ratio. Eight participants were lost at follow-up, 3 from the isometric contrast resistance training group (injuries unrelated to the intervention), 1 from the dynamic contrast resistance training group (injury unrelated to the intervention), and 4 from the control group (involvement in resistance training during the intervention). Final analyses included 97 participants (age: 24.4 ± 3.3 y; body mass: 68.5 ± 6.5 kg; height: 1.70 ± 0.05 m). Figure 1 depicts the study flow diagram.
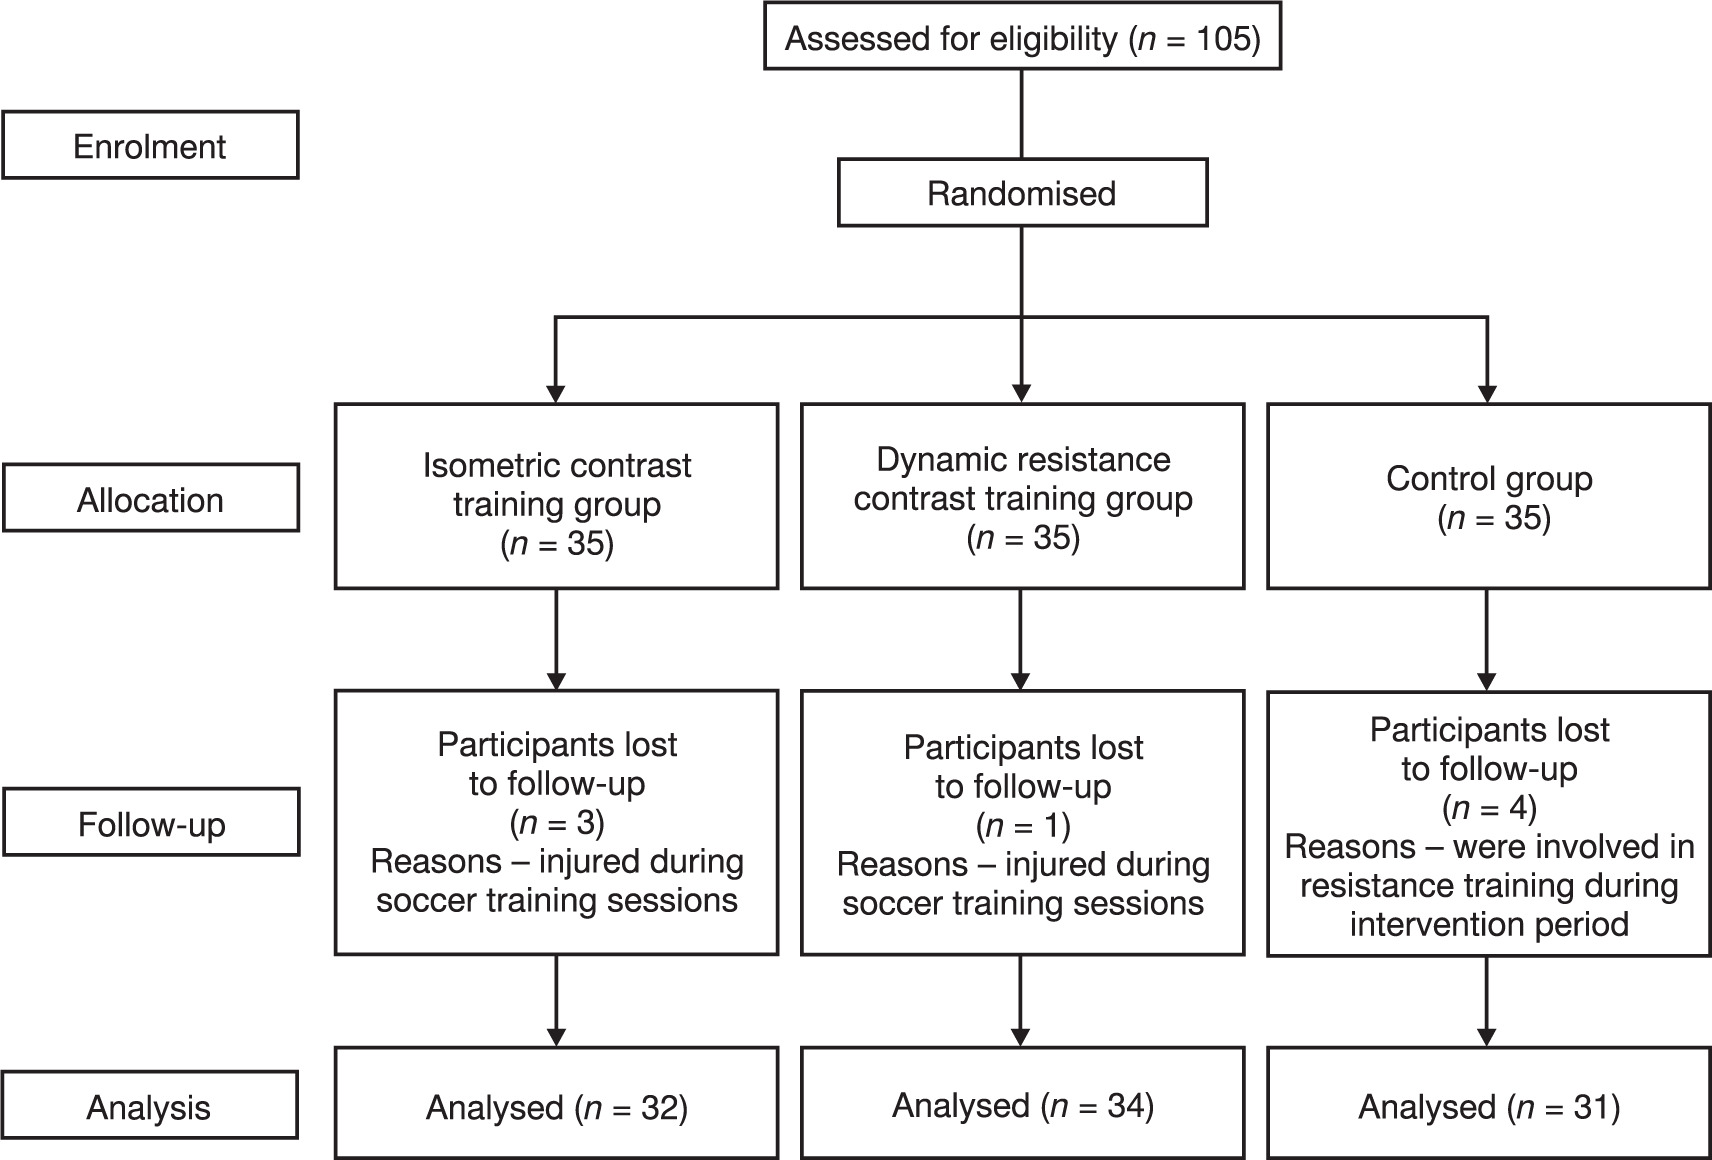
Table 1
Training protocols
Training intervention
The training intervention (see details in Table 1) was conducted during the off-season period, after the completion of the league. The intervention lasted 10 weeks, with 2 weekly sessions. Two contrasting pairs of exercises were selected with biomechanically similar characteristics (e.g., squat paired with vertical jumps) [2]. The intra-contrast rest period between the alternating load (i.e., between squat and vertical jumps) was < 30 s, and the between-set and between-contrast exercise recovery was 120 s. The isometric contrast training group performed 90° isometric squats paired with vertical jumps from a seated position and unilateral isometric quarter squats paired with repeated unilateral broad jumps. The isometric exercises were performed using push-isometric methods that involved pushing the immovable barbell with the maximally intended velocity [3]. Meanwhile, the dynamic contrast training group performed squats paired with vertical jumps from a seated position, and deadlifts were paired with repeated unilateral broad jumps. Progressive overload was applied using duration of contraction for isometric exercises, percentage of one-repetition maximum for dynamic resistance exercise, number of jumps for ballistic exercises, and number of contrast sets performed. All training sessions were conducted by accredited strength and conditioning coaches.
Performance assessments
Independent assessors, who were blinded to the participant’s group allocation, conducted the assessments. The tests were conducted between 11:00 am and 3:30 pm. Before testing, participants began with a general warm-up consisting of 5–10 min of light aerobic exercise, followed by different warm-up sets for each specific test. Day 1 consisted of the linear sprint, day 2 consisted of CODS and the 300-yard shuttle run, day 3 consisted of CMJ and the standing long jump, and days 4, 5, and 6 consisted of 1RM assessments.
One-repetition maximum squat
The maximal strength of the participants was assessed using the one-repetition maximum (1RM) squat, conducted according to international guidelines (e.g., National Strength and Conditioning Association). As part of the specific warm-up, the first squat set was performed with a moderate load for 10 repetitions, followed by progressively heavier sets of 5 repetitions, 2–3 repetitions, and one repetition. The starting weight was selected based on the estimated strength reported verbally by the participants. After each successful lift, the weight was increased by 5–10% with 2–4 min of rest between attempts. Testing continued until the participant could not complete a single repetition with proper technique, and the highest successfully completed weight was recorded as the 1RM. If failure occurred, participants were allowed to retry the previous successful weight. Accredited strength and conditioning coaches acted as spotters throughout the testing protocol to ensure safety.
Linear sprint times
The linear sprint times were assessed for 10 m and 40 m distances using a validated and reliable single-beam photocell timing system (Cronox-sports, Madrid, Spain) [21]. The photocells were placed 0.6 m above the ground level to match the torso of the participants. Participants stood 0.3 m behind the first photocell with a standing stance and were allowed to start the trial when they were ready. Three maximal effort trials were conducted with a rest period of 1 min allowed between the trials. The average of the three trials was selected for the analysis. The interclass correlation coefficient (ICC) with 95% confidence interval (CI) was 0.74 (0.67–0.80) and 0.95 (0.93–0.96) for the 10-m and 40-m linear sprints, respectively.
Countermovement jump height
The vertical jumping ability was assessed using the CMJ, which was performed on a valid and reliable portable contact mat (Chronojump Boscosystem) [22]. The participants were instructed to place their hands on the hips and jump maximally following a countermovement with a self-selected magnitude of knee flexion. Knee flexion or hand swings were not allowed during the flight phase of the jump, with trials being reconducted on failure. Three maximal effort trials were conducted with an inter-trial recovery of 1 min. The best trial was selected for analysis. The ICC with 95% CI was 0.95 (0.94–0.96).
Standing long jump distance
The horizontal jumping ability was assessed using the standing long jump test, which was performed on a firm surface in a gym. A measuring tape was attached to the ground, and a line was marked at the start of the tape. Participants were instructed to stand behind the marked line with a shoulder-width foot stance and jump as far as possible with arm swings allowed. The participants had to land on both feet without losing balance. The jump distance was measured from the take-off line to the nearest heel at landing. Three trials were conducted with an inter-trial recovery of 1 min. The average of the three trials was used for analysis. The ICC with 95% CI was 0.83 (0.78–0.86).
Change of direction speed time
The CODS was assessed using the pro-agility test. A stopwatch was used to record the time. The test setup consisted of three lines separated by 5 yards (4.6 m), with participants starting from the centre line in a three-point position using a shoulder-width foot stance placed equally on either side of the line. The test required participants to sprint 5 yards to one side and touch the line with their lead foot and hand, sprint 10 yards to the opposite line and touch the line with their lead foot and hand, and finish by sprinting 5 yards back to the starting line. The direction of the starting sprint was self-selected by the participants. Three trials were conducted with an inter-trial recovery of 1 min. The average of the three trials was used for the analysis. The ICC with 95% CI was 0.89 (0.87–0.92).
300-yard shuttle run test
The short-duration, high-intensity endurance was assessed using the 300-yard shuttle run test that involved repeated sprints with directional changes. The test setup included two saucer cones placed 25 yards (22.9 m) apart, and the participants started from one cone, sprinting to the opposite cone, touching the cone and sprinting back. A total of 300 yards distance was covered by completing 12 total lengths (6 round trips) as fast as possible. The time taken to cover the 300-yard distance was recorded by an experienced timekeeper using a handheld stopwatch. One sub-maximal practice trial was performed before the maximal effort trial. Only one maximal effort trial was conducted and used for analysis.
Statistical analysis
The normality of the distribution of the data was assessed using the Shapiro–Wilk test. For non-normally distributed data, a two-way transformation was applied to perform the parametric statistical analysis. A two [within-group (pre, post)] by three [between-group (control, isometric, dynamic)] mixed design analysis of variance was used to analyse the effects of the intervention on the performance variables. Further, an analysis of covariance using the baseline data as covariates was conducted to find the differences between groups at the post-test. The interpretation of the effect size of the magnitude of difference using partial eta squared (ηp2) was small (< 0.06), moderate (≥ 0.06–0.13), or large (≥ 0.14) [23], and for Hedge’s g was trivial (< 0.2), small (0.2–0.6), moderate (> 0.6–1.2), or large (> 1.2–2.0) [24]. Additionally, the reliability of the testing procedures was assessed using the ICC between trials and was interpreted as poor (< 0.5), moderate (0.5–0.75), good (0.75–0.9), and excellent (> 0.9) reliability based on the lower bound of the 95% CI [25]. The statistical significance was set at p ≤ 0.05.
Results
The final analysis included 97 participants (Table 2). The number of sessions completed was 18.8 ± 1.2 and 18.6 ± 1.3 sessions by participants in the isometric and dynamic resistance contrast training groups, respectively.
Within-group analyses
The within-group effect size changes from pre- to post-intervention are detailed in Table 3. The control group showed small magnitude improvements in 40-m linear sprint speed, CODS, and CMJ height, although with small magnitude detrimental changes in absolute and relative maximal strength. The isometric contrast training group obtained small-to-moderate magnitude improvements in the 10-m and 40-m linear sprint speed, CODS, CMJ height, and standing long jump distance. The dynamic contrast training group improved all performance variables with small-to-large magnitudes.
The post-test scores were adjusted using the pretest scores as covariates.
Table 2
Participants’ descriptive characteristics before intervention
Between-group analyses
The between-group analyses are detailed in Table 3. The covariate-adjusted post-test scores for the isometric contrast training, dynamic contrast training, and control groups are presented in Table 4. A difference at postintervention (using the pre-intervention scores as covariates) was observed for 10-m (F = 12.6, ηp2 = 0.22, p < 0.001) and 40-m linear sprint speed (F = 23.2, ηp2 = 0.34, p < 0.001), CODS (F = 19.1, ηp2 = 0.29, p = 0.001), CMJ height (F = 9.6, ηp2 = 0.17, p < 0.001), 300-yard shuttle run test time (F = 8.9, ηp2 = 0.16, p < 0.001), and absolute (F = 40.8, ηp2 = 0.47, p < 0.001) and relative maximal (F = 26.2, ηp2 = 0.36, p < 0.001) strength in 1R M squat.
Table 3
Physical performance variables before and after interventions
[i] CMJ – countermovement jump, SLJ – standing long jump, 1RM – one-repetition maximum
a difference between isometric and dynamic contrast training groups, b difference between isometric and control groups, c difference between dynamic and control groups, g – Hedge’s g, L large, M moderate, S small, T trivial Non-normally distributed data presented as median (interquartile range)
Table 4
Covariate-adjusted post-test scores after intervention
Post hoc analysis revealed that, compared to the control group, the isometric and dynamic contrast training groups improved (p < 0.001–0.002) the 10-m and 40-m linear sprint speed, CODS, 1RM squat absolute and relative maximal strength, and the dynamic contrast training group also improved the CMJ height and 300-yard shuttle run test time (p < 0.001–0.001). Additionally, compared to the isometric contrast training group, the dynamic contrast training group improved (p < 0.001–0.024) the CMJ height, 300-yard shuttle run test time, and absolute and relative 1RM squat maximal strength.
Discussion
This study compared the effects of high-load isometric versus high-load dynamic contrast resistance training on soccer players’ physical performance. As hypothesised, isometric high-load contrast resistance training improved soccer players’ physical performance, even when considering that physical performance assessments involved dynamic actions. Nonetheless, and in line with the specificity training principle, dynamic high-load contrast resistance training improved soccer players’ physical performance to a greater extent. A discussion of the findings follows.
Both the high-load isometric and high-load dynamic contrast resistance training groups improved the linear sprint speed, CODS, and CMJ when compared to controls, in line with previous studies in soccer players [5, 10, 26]. These improvements may be attributed to neuromuscular adaptations, including (but not limited to) inter- and intra-muscular coordination, motor unit recruitment, motor unit firing rate, and stretch-shortening tendon-muscle cycle function, which are common after both dynamic resistance training [27] and jump training [28], two components of contrast training [2]. Moreover, contrast training [29] and jump training alone [30] may preserve type II muscle fibres (i.e. fast twitch), helping physical performance, particularly during the off-season.
Although isometric resistance training can improve dynamic physical performance [16], the CMJ, absolute and relative 1RM squat improved more after high-load dynamic versus high-load isometric contrast resistance training. A possible reason is the limitation of isometric training in inducing force development at nontrained joint angles [16]. In the current study, the isometric squats were performed at a 90° knee joint angle, which may have limited the transference effect on CMJ compared to dynamic resistance contrast training. Indeed, similar reasons (i.e., the principle of specificity) may also apply to the greater improvements observed in 1RM squat and relative squat strength after dynamic resistance contrast training compared to isometric contrast training [31]. Furthermore, the 300-yard shuttle run performance improved more after high-load dynamic versus high-load isometric contrast resistance training. High-load (i.e., 85% 1RM) dynamic resistance training may enhance anaerobic power output and movement efficiency, thus improving the high-intensity anaerobic endurance required during the 300-yard shuttle run test [32]. Moreover, the 300-yard shuttle run test involves multiple rapid accelerations, decelerations, and change-of-direction, which require the application of high eccentric and concentric forces, which may be improved by performing high-load dynamic resistance training (e.g., squats) and ballistic exercise (e.g., jumps) [33]. If high-load isometric contrast resistance training was unable to induce similar adaptations, it is yet to be investigated.
It is noteworthy that the study was conducted on highly trained male soccer players during the off-season period. Therefore, future studies are needed before the current results can be extrapolated to other contexts (e.g., females, pre-season, in-season, greater/lower competitive-level players, non-soccer players). Future studies may also include force plates to collect jump data, as this would provide insights into changes in jump strategy after training interventions. Additionally, future studies may include isometric tests (e.g., isometric mid-thigh pull) to provide further insights regarding the specific training principle and its transference to soccer players’ performance. Lastly, how these training interventions can affect the performance of players based on their playing positions (e.g., defenders versus forwards) [34] and how they translate to overall physical performance during the match (e.g., total running distance, high-speed running, etc.) can be studied in the future.
Conclusions
In line with the specific training principle, dynamic high-load contrast resistance training improved soccer players’ physical performance (300-yard shuttle run endurance, CMJ, 1RM squat) to a greater extent when compared to isometric high-load contrast resistance training. Practitioners may choose the former training approach to elicit greater physical performance improvements during the off-season period. However, under certain scenarios (e.g., limited access to resistance training equipment), isometric high-load contrast resistance training may aid soccer players in improving linear sprint speed (10 m, 40 m), CODS, and maximal strength.