
Introduction
Functional asymmetries between the dominant and non-dominant limbs are a common phenomenon in sports that involve unilateral movement patterns, such as football [1]. Repetitive technical actions like kicking, cutting, and pivoting performed predominantly on one side of the body can lead to structural and functional imbalances over time [2]. Beyond absolute differences in strength or mobility, such inter-limb asymmetries may reflect altered sensorimotor integration and asymmetric neuromuscular control strategies, particularly in athletes exposed to long-term unilateral loading demands.
A substantial body of research has examined inter-and intra-limb strength asymmetries in football players, consistently linking muscular strength imbalances to performance outcomes and injury risk [3, 4]. However, while strength-based asymmetries have been extensively investigated, comparatively less attention has been directed towards asymmetries in joint flexibility [5]. In particular, the potential impact of bilateral flexibility asymmetries on explosive performance outcomes remains underexplored, especially in youth football populations.
During explosive tasks such as vertical jumping, coordinated force transmission across the kinetic chain depends in part on adequate and symmetrical joint mobility [6]. Even subtle inter-limb differences in range of motion may alter segmental timing and joint moment distribution, potentially contributing to compensatory movement strategies and reduced mechanical efficiency [7]. Unilateral lower-limb tasks are known to reveal meaningful asymmetries in thigh muscle function,and imbalances in agonist–antagonist behaviour have been shown to influence neuromuscular efficiency during single-leg and bilateral movements [8]. Such asymmetries may alter force–time characteristics and impair the ability to optimally utilise the stretch–shortening cycle, which is a key determinant of explosive performance. From a biomechanical perspective, symmetrical flexibility across both limbs facilitates balanced storage and release of elastic energy, whereas asymmetrical mobility may lead to unequal energy transfer and diminished propulsion during take-off phases of jumping tasks [9, 10].
Flexibility is widely recognised as a fundamental component of athletic performance and injury prevention [11]. Previous research has demonstrated positive associations between hamstring flexibility and vertical jump performance, as well as negative relationships between limited flexibility and injury incidence [12– 14]. Athletes with greater flexibility capacity appear better able to tolerate repetitive mechanical loading and to optimise force production through improved joint excursion and muscle–tendon interaction. However, most studies have focused on absolute flexibility levels rather than inter-limb differences, potentially overlooking the functional relevance of bilateral symmetry in mobility.
Adolescence represents a particularly sensitive developmental period characterised by rapid growth, neuromuscular reorganisation, and evolving inter-limb coordination. During this stage, repeated unilateral sport-specific demands may amplify flexibility asymmetries before neuromuscular maturity is fully established. Consequently, asymmetries that might be well tolerated in mature athletes could exert a disproportionate influence on movement efficiency and performance in youth populations. Despite this, bilateral flexibility asymmetries remain relatively underexplored in adolescent athletes, with the majority of existing research focusing on strength or power asymmetries in adult or elite cohorts [15, 16].
Moreover, few studies have directly examined whether bilateral flexibility differences translate into impairments in functional performance outcomes such as vertical and horizontal jumping, which are fundamental components of football-specific actions. Understanding this relationship is essential, as jump performance reflects the integrated function of multiple joints and muscle groups operating under high neuromuscular demands.
Therefore, the purpose of this study was to investigate the association between bilateral lower-limb flexibility asymmetries and both vertical and horizontal jump performance in adolescent male football players. It was hypothesised that greater inter-limb flexibility asymmetries would be negatively associated with jump performance outcomes, reflecting reduced neuromechanical efficiency during explosive tasks.
Material and methods
Experimental design and participants
This study employed a cross-sectional correlational design to assess the association between bilateral lower-extremity flexibility asymmetries and vertical and horizontal jump performance among adolescent male football players. An a priori power analysis was conducted using the G*Power software (version 3.1.9.3, Heinrich Heine University, Düsseldorf, Germany) for a two-tailed Pearson product–moment correlation (bivariate normal model), as the primary aim of the study was to examine associations between bilateral lower-limb flexibility asymmetries and jump performance variables. The expected effect size was set at r = 0.64 based on the correlation coefficient reported by Overmoyer and Reiser [17], who observed a significant association between ankle plantarflexion asymmetry and anterior reach asymmetry in the Y Balance Test (r = 0.636). With an alpha level of 0.05 and a desired statistical power of 0.85, the minimum required sample size was calculated as 18 participants. Accordingly, 20 adolescent male football players were recruited to ensure adequate statistical power.
Inclusion criteria were: (i) male football players aged 15–17 years; (ii) participation in structured football training for at least 75 min per session, a minimum of three times per week; (iii) at least two years of continuous football training experience; and (iv) absence of lower-limb injury or surgical intervention within the preceding six months. Players who did not meet these criteria or reported current musculoskeletal complaints at the time of testing were excluded from participation. Participants were recruited using a convenience sampling approach from a single local youth football academy. All players were actively training within the same club structure and followed a comparable weekly training schedule. Coaches were informed about the study procedures, and eligible players who met the predefined inclusion criteria volunteered to participate. Written informed consent was obtained from the parents or legal guardians prior to participation.
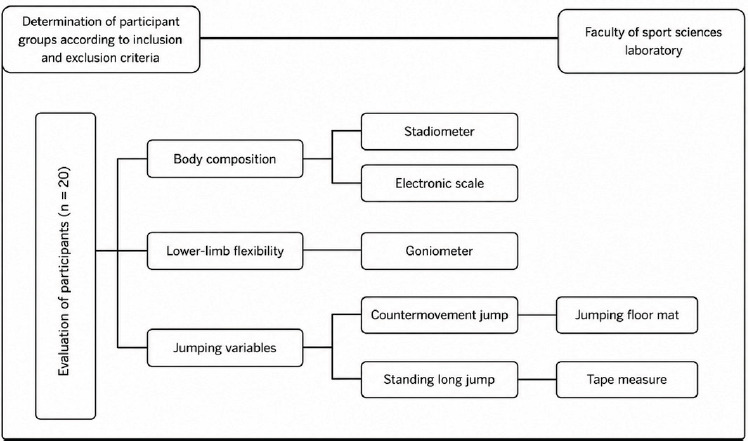
After a battery of 6 active range of motion measurements and 15 minutes of dynamic warm-up, counter-movement jump and standing long jump tests were performed. Subsequently, a battery of six active range of motion assessments was administered to evaluate bilateral lower-limb flexibility. Following the flexibility assessments, participants performed both vertical and horizontal jumps to evaluate performance. The flow of the experimental procedure is illustrated in Figure 1.
Body composition
Each participant’s height was measured barefoot in the anatomical position with the head in the Frankfort plane using a portable stadiometer (Seca Ltd., Bonn, Germany) with a sensitivity of 0.01 metres (m), and the body weight was measured barefoot and with minimal c with a sensitivity of 0.1 kilograms (kg).
Lower limb flexibility measurement
To assess bilateral lower-limb flexibility, a battery of six active range of motion tests was administered. All flexibility assessments were performed by the same experienced investigator to ensure procedural consistency. In order to prevent any confounding effects due to pre-activation or differential stress between limbs, participants were not allowed to warm-up prior to testing. All measurements were conducted manually using a standard universal goniometer while participants lay or sat on an examination table. Prior to assessment, anatomical landmarks were marked to ensure consistent goniometer alignment. During each test, participants were instructed to stabilise their hip and lumbar regions and hold the maximal range position for 5 s under gentle resistance. Each test was performed three times with a 1-minute rest between trials. To minimise potential learning effects, the first trial was considered a familiarisation trial, and the average of the second and third trials was recorded in degrees. Intra-rater reliability was evaluated using intraclass correlation coefficients (ICC; two-way mixed-effects model, absolute agreement). ICC values ranged from 0.91 to 0.96 across the six range-of-motion tests, indicating excellent reliability. Detailed descriptions of the active range of motion measurements are provided in Table 1. Flexibility asymmetry between limbs was calculated as a percentage difference using the following formula: Asymmetry: | (Xleft – Xright) / ((Xleft + Xright)/2) | × 100 [18].
Table 1
Lower-limb active range of motion flexibility tests and goniometer placement details
Vertical jump measurement
Vertical jump performance was evaluated through the countermovement jump, a widely used protocol to assess lower-body explosive power. A contact mat was used to record jump height in centimetres (Fusion Sport, Australia). Jump height was automatically calculated from flight time by the device software. Participants stood barefoot on the mat with their feet shoulder-width apart, knees fully extended, and hands placed firmly on the hips throughout the entire movement. They were instructed to perform a rapid downward movement (eccentric phase) by flexing their knees to approximately 90°, followed immediately by a maximal vertical jump (concentric phase). The hands remained fixed at the hips to eliminate upper-body momentum [19]. Each participant performed three trials, with a passive rest interval of 3 minutes between trials. The highest jump recorded across the trials was used for analysis.
Horizontal jump measurement
Horizontal jump performance was evaluated through the Standing Long Jump test, which is a widely accepted field-based assessment of lower-limb explosive power. Prior to testing, the ground was pre-marked at regular intervals using a standard tape measure to facilitate efficient and accurate data collection. Participants began each attempt by standing just behind the take-off line with their feet shoulder-width apart and arms relaxed at their sides. They were instructed to use a natural arm swing to enhance propulsion and to jump forward as far as possible. Upon landing, participants were required to remain stationary and keep their heels on the ground to ensure a valid measurement. Jump distance was defined as the horizontal distance from the starting line to the rearmost point of heel contact on landing, measured in centimetres using a calibrated tape measure [20]. Each participant performed three trials, with a passive rest interval of 3 min between trials. The longest jump among the three trials was retained for analysis.
Statistical analysis
All statistical analyses were performed using the IBM SPSS Statistics software (Version 27.0; IBM Corp., Armonk, NY, USA). Descriptive statistics were presented as mean ± standard deviation. The Shapiro– Wilk test was used to verify the normality of the data distribution, given that the sample size was less than 50. To examine side-to-side differences in flexibility between the dominant and non-dominant limbs, paired samples t-tests were conducted. Additionally, Cohen’s d values were calculated to interpret the effect sizes of these differences. Effect size interpretation followed standard thresholds: d < 0.2 = trivial, 0.2–0.49 = small, 0.5–0.79 = moderate, and 0.8 = large. To assess the relationships between bilateral flexibility asymmetries and jump performance variables, Pearson’s correlation coefficient was calculated with a 95% confidence interval. Correlation strength was interpreted as follows: r < 0.3 was considered trivial, 0.31 < r < 0.49 as moderate, 0.5 < r < 0.69 as high, 0.7 < r < 0.89 as very high, and 0.9 < r < 1 as excellent. The threshold for statistical significance was set at p < 0.05.
Results
Descriptive statistics for participants’ demographics are summarised in Table 2.
Table 2
Descriptive values of participants
Paired-samples analysis revealed distinct patterns of bilateral differences across the muscle groups (Table 3). Hamstring measurements showed a significant side-to-side difference, supported by a large effect size (p < 0.001, d = 0.95). Plantarflexor measures also demonstrated a significant bilateral difference (p = 0.001, d = 0.85). A moderate difference was also observed in hip adductor values (p = 0.030, d = 0.53). In contrast, the quadriceps (p = 0.209), hip abductor (p = 0.937), and dorsiflexor measures (p = 0.098) exhibited no significant side-to-side differences, with corresponding effect sizes ranging from negligible to small (d = –0.02 to 0.39).
Table 3
Descriptive values of lower limb bilateral flexibility variables
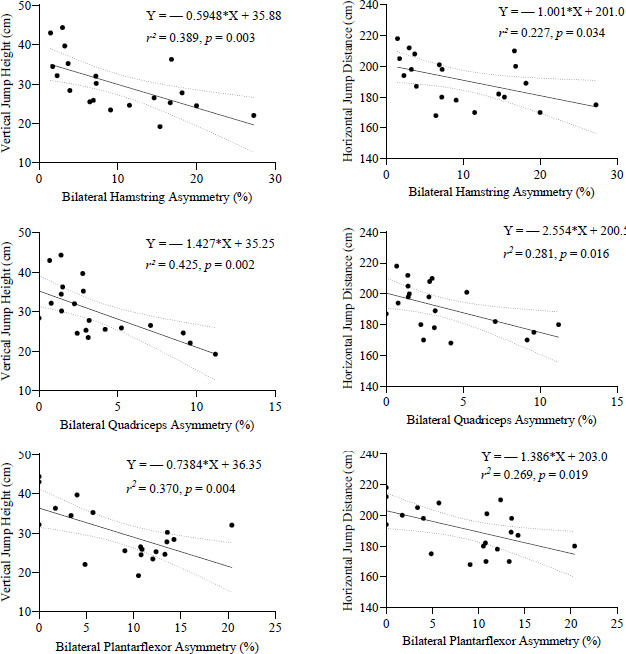
Correlation analysis revealed that lower-limb flexibility asymmetries were differentially associated with jump performance (Table 4). For vertical jump height, significant and negative correlations were identified with hamstring asymmetry (r = –0.624, p = 0.003), quadriceps asymmetry (r = –0.652, p = 0.002), and plantarflexor asymmetry (r = –0.608, p = 0.004), indicating that greater bilateral differences in these muscle groups were associated with reduced jump height. In contrast, hip abductor (r = –0.128, p = 0.591), hip adductor (r = –0.348, p = 0.133), and dorsiflexor asymmetry (r = –0.161, p = 0.496) showed no significant relationship with vertical jump height.
Table 4
Correlations between bilateral lower limb asymmetries and jumping variables
Regarding horizontal jump distance, quadriceps asymmetry demonstrated a significant negative correlation (r = –0.530, p = 0.016), followed by plantarflexor asymmetry (r = –0.518, p = 0.019) and ham-string asymmetry (r = –0.477, p = 0.034). These findings similarly indicate that greater asymmetry in these muscle groups adversely affects horizontal jump performance. No significant associations were observed for hip abductor (r = 0.033, p = 0.892), hip adductor (r = –0.196, p = 0.408), or dorsiflexor asymmetry (r = –0.184, p = 0.437) in relation to horizontal jump distance.
Simple linear regression analyses demonstrated that bilateral flexibility asymmetries were significant predictors of vertical jump performance. Specifically, ham-string asymmetry (R2 = 0.389, p = 0.003), quadriceps asymmetry (R2 = 0.425, p = 0.002), and plantarflexor asymmetry (R2 = 0.370, p = 0.004) each accounted for a meaningful proportion of the variance in countermovement jump height. Similarly, for horizontal jump performance, hamstring (R2 = 0.227, p = 0.034), quadriceps (R2 = 0.281, p = 0.016), and plantarflexor asymmetry (R2 = 0.269, p = 0.019) emerged as significant predictors of standing long jump distance, indicating that greater asymmetry in these muscle groups was associated with reduced jump distance (Figure 2).
Discussion
The present study examined the association between bilateral lower-limb flexibility asymmetries and jump performance outcomes in adolescent football players. The principal findings demonstrated that asymmetries in the hamstrings, quadriceps, and plan-tarflexors were moderately to strongly negatively associated with both vertical and horizontal jump performance. These results indicate that greater inter-limb discrepancies in mobility are linked to reductions in explosive performance capacity, supporting the hypothesis that flexibility symmetry plays a meaningful role in neuromechanical efficiency during high-intensity tasks.
Hamstring asymmetry demonstrated a moderate-to-strong negative association with jump performance, with simple linear regression models indicating that asymmetry accounted for approximately 23–39% of the variance in performance outcomes. Quadriceps asymmetry similarly accounted for 28–43% of the variance in jump outcomes, emphasising the importance of balanced mobility within the thigh musculature for optimal force transmission. These findings are consistent with previous evidence indicating that inter-limb asymmetries are associated with impairments in jump performance and horizontal propulsion tasks [21]. Furthermore, horizontal jump asymmetry exhibits strong agreement with reductions in mobility, jump performance, and change-of-direction ability, underscoring the functional relevance of bilateral symmetry [22]. Supporting this notion, young football players with greater hamstring flexibility achieved superior performance across sprinting, agility, and jumping tasks, with improvements of up to 10% in countermovement jump height [14].
Collectively, these findings suggest that bilateral flexibility asymmetries may impair neuromuscular efficiency by disrupting coordinated force production between limbs. Efficient explosive movement relies on synchronised activation and timing across joints and muscle groups; asymmetrical mobility may impose unequal mechanical constraints, prompting compensatory strategies such as altered joint sequencing, increased co-contraction, or delayed force application [23]. Over time, these compensations may reduce the maximal power output and increase the cumulative mechanical stress on the more mobile or dominant limb. Thus, even relatively modest flexibility asymmetries may translate into meaningful performance deficits during tasks that demand rapid and symmetrical force generation, such as jumping [24].
Among the examined variables, plantarflexor asymmetry emerged as a particularly influential factor, accounting for up to 37% of the variance in vertical jump performance. This finding highlights the critical role of ankle joint mobility symmetry in explosive performance. Previous biomechanical research using a work-energy approach has shown that muscles acting at the ankle joint contribute approximately 23% of the total positive work in maximal vertical jumping, highlighting the substantive role of the plantarflexor muscle group in propulsion [25]. Consistent with the present findings, previous research has demonstrated strong associations between ankle mobility and countermovement jump height [26], as well as significant relationships between plantarflexor-related mobility parameters and jump performance [27]. Collectively, these data suggest that side-to-side discrepancies in plantarflexor flexibility may impair elastic energy storage and release, thereby reducing propulsive efficiency during jumping tasks.
In contrast, flexibility asymmetries in the hip abductors, hip adductors, and dorsiflexors were not significantly associated with jump performance. Although bilateral differences exceeding 7–12% were observed in some participants, these asymmetries did not appear to influence explosive performance outcomes. This may be explained by the functional roles of these muscle groups, which are primarily involved in frontal-plane stabilisation and postural control rather than direct propulsion during sagittal-plane jumping tasks.Additionally, given the adolescent status of the participants, such asymmetries may reflect normal developmental variability or sport-specific adaptations that are not yet functionally limiting.
From an applied perspective, the present findings underscore the importance of monitoring bilateral flexibility asymmetries as part of routine athletic screening, particularly in youth football players. Identifying athletes with pronounced inter-limb mobility discrepancies may allow practitioners to implement targeted corrective interventions aimed at restoring symmetry and optimising movement efficiency. Given that explosive lower-body actions such as jumping, sprinting, and rapid accelerations are integral components of modern football performance, neuromechanical factors that influence force production and movement efficiency may have broader implications for physical output during competition. Recent evidence has highlighted the biological and physical fitness adaptations observed following jump-based training interventions in soccer players [28]. Furthermore, match-running performance analyses in professional soccer have demonstrated the importance of maintaining high-intensity running output and consistent physical performance across match phases, including during congested competitive periods and varying tactical contexts [29, 30]. In addition, contextual factors such as ball possession status have been shown to influence match-running demands and performance modelling in elite soccer [31]. Collectively, these findings suggest that factors influencing movement efficiency and inter-limb balance should be considered within broader performance development strategies. Beyond performance considerations, neuromuscular imbalances and workload fluctuations may also be relevant in the context of injury risk in football. Previous studies have shown that training and match load are important determinants of non-contact muscle injuries in elite soccer players and may influence return-to-performance metrics following injury [32, 33].
Several limitations should be acknowledged. The relatively small sample size may limit the generalis-ability of the findings and the stability of regression estimates. Furthermore, the cross-sectional design precludes causal inference regarding whether reducing flexibility asymmetries would lead to performance improvements. In addition, no indicator of biological maturation was assessed in this study. Given the adolescent age range of the participants (15–17 years), inter-individual differences in maturation status may have influenced both flexibility asymmetries and jump performance. Therefore, biological maturity should be considered a potential confounding factor when interpreting the present findings. Future studies employing longitudinal or interventional designs should examine whether targeted flexibility interventions can effectively reduce asymmetries and translate into measurable gains in performance or reductions in injury risk. Expanding outcome measures to include sprinting, change-of-direction performance, and injury incidence would also provide a more comprehensive understanding of the functional implications of flexibility asymmetry in adolescent athletes.
Conclusions
This study demonstrated that bilateral flexibility asymmetries in the hamstrings, quadriceps, and plan-tarflexors were negatively associated with vertical and horizontal jump performance in adolescent male football players, highlighting inter-limb mobility symmetry as a potentially relevant factor in explosive performance during youth development.
Among the examined variables, plantarflexor asymmetry showed one of the strongest associations with vertical jump performance, underscoring the functional relevance of symmetrical ankle mobility. From an applied perspective, routine bilateral flexibility screening using simple active range-of-motion assessments may assist in identifying mobility discrepancies and informing performance-monitoring strategies in adolescent football players. Future longitudinal and interventional studies are needed to clarify whether reducing flexibility asymmetries results in sustained performance improvements and reduced injury risk.