Introduction
Football is characterised by high-intensity, intermittent physical demands involving repeated short bursts of high-intensity actions interspersed with periods of lower-intensity activities such as walking [1, 2]. To cope with the high and specific demands of competitive football without injury, players must be properly conditioned. In this context, the monitoring of external training loads is essential for optimising performance and ensuring appropriate training load management [3].
Spanning applied and research settings, common metrics used to measure the external training load of football players include total distance covered, distance covered at high speeds, and the number of accelerations and decelerations [3–5]. Indeed, several studies have described external load in football training, with systematic reviews encompassing male and female players across youth and senior levels [6–8]. Studies investigating training load periodisation throughout the week typically schedule sessions using the ‘match day minus’ format, based on the available days before and after the match day (MD). For instance, with this format, MD–1 indicates one day before the match, and MD+2 represents two days after the game [9, 10].
According to tactical periodisation, the microcycle is organised using MD as the primary reference point with which to manage players’ conditioning and recovery status [8]. For example, in a week with one MD, MD+1 and MD+2 are often dedicated to recovering players who started the match, while balancing the load for those who played fewer minutes or did not participate. Further, MD–4, MD–3, and MD–2 often place the focus on enhancing physical performance, with primary emphasis on strength, endurance, and speed on these days, respectively. Finally, MD–1 is reserved for tapering to reduce the training load in preparation for the match day [11, 12].
When planning training loads, it is important to consider that external load can vary according to many factors, such as players’ age and position [9]. For instance, when comparing under-18 (U18) and first-team players, in a club from the Europa, U18 players covered greater total distances and performed a higher number of accelerations and decelerations, whereas first-team players accumulated greater sprint distances [13, 14]. In a sub-elite Portuguese football academy, under-17 (U17) players exhibited higher weekly external loads compared to their under-15 (U15) and under-19 (U19) counterparts [7]. Similarly, U19 and U17 players showed greater accumulated weekly external loads than under-16 (U16) and U15 players in an Italian Série A youth academy [9]. Regarding playing position, external defenders and wide midfielders have been reported to cover greater high-speed running and sprinting distances compared to other positions across European football academies [9, 15]. In elite youth soccer, central defenders cover the shortest distances, while wide players and centre forwards cover the longest high-intensity and sprinting distances, in addition to performing a greater number of accelerations [16]. Understanding such variations in training load, accounting for key moderators such as age and position, is critical for practitioners who seek to appropriately manage the training load, ensuring they have more granular insight into key variables impacting player development, injury risk and readiness to perform on match day.
Despite the growing number of studies, most available evidence originates from European football contexts, with limited information regarding other regions [9, 14]. To the best of our knowledge, no studies have been published on monitoring the weekly external training load of Brazilian elite academy football players according to different categories and ages. This gap may be partly due to the high cost of global navigation satellite systems (GNSS), which limits some clubs from investing in such technology. However, match running performance is known to vary across countries, competitive environments and contextual variables [17, 18], highlighting the importance of investigating Brazilian players to understand their unique training demands. For example, in the Brazilian elite academy, Brazilian academy players typically complete five training sessions per week, compared with four in many European academies [19, 20]. Therefore, the training needs and practices of Brazilian and South American academy players remain largely underexplored. Consequently, key contextual differences (e.g., climate, training frequency, and conditioning methods, etc.) may limit the practical relevance and applicability of the predominantly European research base for non-European practitioners who seek contextually relevant insight into professional practices.
Thus, in light of the current gaps in the available literature, the aim of this study was to describe the external training load demands of U15, U17, and U20 starter elite football players from a Brazilian club during an official season. Additionally, considering that the physical demands in football are highly position-specific, we compared the external loads across positions, training days, and weekly training loads for all age categories to identify any differences in load exposure.
Material and methods
Experimental approach to the problem
An observational, longitudinal, and retrospective design was considered to analyse youth football players (U15, U17, and U20) from an elite Brazilian national club (March to November 2023). Positional data were recorded using Global Positioning System (GPS) devices (STATSPORT, Apex, Newry, UK) during training sessions. Only athletes who played 60 minutes in non-congested weeks (i.e., when the reference team had only one match during the week) were considered for data analysis [21].
Four weeks were randomly selected for each age category during the competitive season, with each week comprising five training sessions and one official match on the weekend, resulting in a total of 60 training sessions analysed. This number of sessions was logistically possible because of the fixture congestion; many weeks of the year, the athletes played more than one match. All training sessions were selected per week in the competitive period. The training days before the match were considered for the analysis of the weekly distribution. The day following the match (MD+1) was scheduled as a day off for all teams. Training days were classified as: (i) two days after match (MD+2); (ii) four days before next match (MD–4); (iii) three days before next match (MD–3); (iv) two days before next match (MD–2); and (v) one day before next match (MD–1) [8]. The training sessions consisted of small-sided games in different formats: small, medium, and large. At the beginning of the week (MD+2) and (MD–4), the sessions consisted of technical drills and small-sided games in small formats. In the sessions (MD–3) and (MD–2), large formats of the games were used.
Participants
Forty-three male youth football players from a nationally competitive club participated in this study [U15 = 14 players (height: 177.5 ± 6.5 cm; body mass: 62.6 ± 6.2 kg; peak height velocity: 13.8 ± 0.4 years); U17 = 16 players (height: 179.4 ± 5.1 cm; body mass: 69.2 ± 9.0 kg; peak height velocity: 13.8 ± 0.5 years); U20 = 13 players (height: 177.4 ± 6.4 cm; body mass: 72.7 ± 6.7 kg; peak height velocity was not assessed in U20 players)]. All players were part of a team competing in the Rio de Janeiro State League, one of the top national-level youth competitions in Brazil. Participants were classified as external defenders (observations = 118), central defenders (observations = 94), external midfielders (observations = 86), central midfielders (observations = 157), and forwards (observations = 60). The analysis did not include goalkeepers due to their specific roles during match play.
Data collection was conducted as part of the club’s standard protocol, ensuring that all players were already familiar with the instruments. Upon signing their contracts with the club, players and their legal guardians provide consent to participate in scientific research involving data routinely collected during training sessions and matches.
Procedures
Anthropometric assessments for player characterisation were conducted at the beginning of the season. Standing height and body mass were measured, and for athletes from the under-15 and under-17 teams, sitting height was also assessed to calculate peak height velocity. Standing height was recorded to the nearest 0.1 cm using a stadiometer, and sitting height was measured with a 40 cm box. The body weight was measured to the nearest 0.1 kg using a digital scale.
The peak height velocity was determined by the Maturity Offset protocol [22].
Players’ movements during training sessions were tracked using GPS units (Viper pod, STATSports, Belfast, UK). The 10 Hz model includes a triaxial accelerometer, triaxial gyroscope, and triaxial magnetometer, each provided at sampling rates of 100 Hz. The previous study demonstrated high accuracy, validity, and inter-unit reliability at these rates [23]. The units were held in place using an appropriately sized vest specifically designed to reduce movement interference, which was positioned on the upper back between the scapulae. After the end of each session, tracking units were collected from players, ensuring each unit was working before placing them on the docking station. The players used the same device throughout the season to avoid inter-unit errors. The following variables were analysed: (i) total distance (TD; metres); (ii) total distance in high-speed running (HSR: 19.8–25.1 km • h–1, metres); (iii) total distance in sprinting (SPR: 25.2 km • h–1; metres); (iv) number of accelerations (ACC: > 3 m • s–2; number of actions); and (v) number of decelerations (DEC: < –3 m • s–2; number of actions) [24, 25].
Statistical analysis
Data were described as mean and confidence interval (95%). The Kolmogorov–Smirnov test and Q-Q plot inspection verified data normality. A mixed linear model was applied to compare the fixed effects: days of training (MD+2, MD–4, MD–3, MD–2, and MD–1), categories (U15, U17, and U20), position (external defenders, central defenders, external midfielders, central midfielders, and forwards), with ‘Athlete ID’ included as a random effect. In addition, multiple comparisons were adjusted using the Bonferroni method. The t-statistics from the mixed models were converted to effect size correlations. The effect size ES = 2 t/ df was used. In all cases, statistical significance was set at p < 0.05. The calculations were performed using the JASP 0.16.30 Software (Netherlands).
Results
Age categories
Table 1 shows the descriptive statistics of the weekly external training load according to age categories. U20 and U15 players covered significantly greater distances than U17 players (p = 0.01; t = 5.92; ES = 1.22 p < 0.01; t = 6.52; ES = 1.34, respectively). U20 players performed significantly more decelerations than U15 players (p < 0.03; t = 2.68; ES = 0.93).
Table 1
GPS variables across weekly microcycles by age category (mean and IC95%)
Player’s position
Descriptive statistics of the weekly training load according to the player’s position and training days are presented in Table 2. No statistical differences existed between positions for the total distance, accelerations, or decelerations (p > 0.05). However, we observed that the external defenders covered higher distances at higher speeds than the central defenders (p = 0.02; t = 2.34; ES = 0.79). They also covered significantly greater sprinting distances than the central defenders, midfielders, and attackers (all p < 0.05).
Table 2
GPS variables across the weekly microcycle according to training session and position (mean and IC95%)
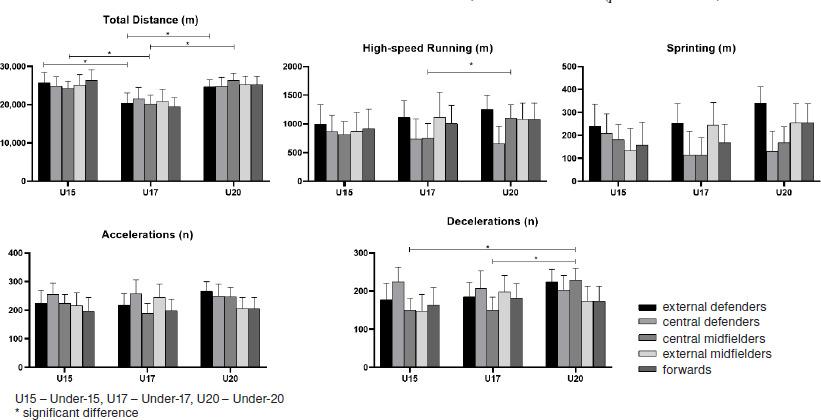
Figure 1 presents the external load variable comparisons between categories according to positions. We found that U15 and U20 external defenders covered significantly higher total distances than their U17 counterparts (p = 0.001 to p = 0.01; t = 2.73 to 7.67; ES = 0.59 to 0.62). Similarly, central midfielders in the U15 and U20 categories covered higher total distances than their U17 category counterparts (p = 0.001 to p = 0.01; t = 2.60 to 30.52; ES = 0.57 to 6.73) and when compared to U15 and U20 forwards (p < 0.01 to p = 0.01; t = 3.51 to 3.68; ES = 0.77 to 0.79). In relation to the distances covered at high speed, the U20 central mid-fielders showed higher values than U17 (p = 0.04; t = 1.99; ES = 0.69). Further, U20 central midfielders performed significantly more decelerations than their U15 and U17 central midfield counterparts (p < 0.01 to p = 0.02; t = 3.37 to 3.54; ES = 1.23 to 1.44).
Day-to-Day variation
Concerning training days comparisons, significantly lower total distances were covered during the recovery (MD+2) and tapering (MD–1) days when compared with the other days for all categories (p = 0.01 to 0.02; t = 8.81 to 14.89; ES = 0.06 to 14.31), except for MD–3 in the U20 category (showing a similar total distance covered compared with MD+2 and MD–1 (Table 3). Players from the U15 category covered significantly higher distances during MD–4, MD–3, and MD–2 when compared to MD+2 and MD–1 (p = 0.01 to 0.02; t = 10.04 to 13.4; ES = 0.40 to 3.15) (Table 3). In the U17 category, players covered significantly higher total distances on MD–3 than on all other days (p < 0.01; t = 6.02 to 13.2; ES = 6.19 to 6.37). In addition, players from the U20 category covered significantly higher total distances on MD–4 than on the other days (p = 0.01; t = 9.51 to 17.36; ES= 0.15 to 4.98) (Table 3).
Table 3
GPS variables across the weekly microcycle according to training session and age category (mean and IC95%)
Significantly higher distances were covered at high speed on MD–3 and MD–2 compared with the other days in the U15 (p < 0.01 to 0.02; t = 4.51 to 8.24; ES = 1.08 to 3.15) and U17 (p = 0.01 to 0.04; t = 2.76 to 12.24; ES = 4.15 to 6.19) categories. In the U17 category, players also covered significantly higher distances at high speed during MD–4 compared with MD+2 and MD–1 (p = 0.04; t = 2.76; ES = 1.51). For the U20 category, MD–4 was the day with the greatest distances covered at high speed when compared with MD+2, MD–3, MD–2 and MD–1 (p = 0.01 to 0.02; t = 4.51 to 15.9; ES = 6.5 to 4.8). In addition, MD–2 is the second day with higher speed distances covered compared with MD+2, MD–3 and MD–1 (Table 3).
Regarding sprinting distances covered, players from the U15 category covered significantly higher distances during MD–4, MD–3, and MD–2, when compared with MD–1 and MD+2 (p < 0.01; t = 4.51 to 5.66; ES = 0.63 to 1.37) (Table 3). There were no significant differences between MD–4, MD–3, and MD–2 (p > 0.05). Players from the U17 category covered significantly higher distances during MD–3 and MD–2 when compared with all other days (p = 0.01 to 0.02; t = 5.04 to 7.30; ES = 0.09 to 3.2). Players in the U20 category covered significantly greater distances on MD–4 compared to any other day (p < 0.01 at 0.02; t = 5.71 to 8.26; ES = 2.92 to 3.21), followed by MD–2 (p < 0.01 to 0.04; t = 3.42 to 4.77; ES = 1.84 to 1.88) (Table 3).
In the U15 category, players performed significantly more accelerations and decelerations demands on MD–4 when compared with MD+2, MD–3, MD–2 and MD–1 (p = 0.01; t = 6.28 to 12.13 and p = 0.01 to 0.04; t = 3.50 to 12.02; ES = 2.6 to 7.2). In the U17 category, players performed significantly more accelerations (p < 0.01 to 0.03; t = 4.80 to 13.01; d =1.03 to 2.66) and decelerations (p < 0.01 to 0.03; t = 3.52 to 9.29; ES =1.2 to 4.7) during MD–4 and MD–3 when compared with MD+2, MD–2 and MD–1. In contrast to the U15 and U17 categories, players from the U20 category performed significantly more accelerations on all days compared with MD–1 (p = 0.01 to 0.04; t = 2.98 to 4.97; ES = 0.80 to 2.91). They also performed significantly more accelerations on MD–2 compared with MD+2, MD–1, and MD–3 (p = 0.01 to 0.03; t = 4.80 to 7.04; ES = 1.18 to 2.91). Finally, players from the U20 category performed more decelerations during MD–4 and MD–2 when compared with MD+2, MD–1, and MD–3 (p < 0.01 to 0.03; t = 3.88 to 12.35; ES = 2.76 to 4.38) (Table 3).
Discussion
The present study aimed to describe the external training load demands of U15, U17, and U20 starter elite football players from a Brazilian club during an official season. Foremost, a key finding with regard to microcycle load periodisation indicated structured patterns of progressive loading and tapering across the week, with peak external loads typically occurring on MD–2 to MD–4 and tapering occurring on MD–1 and MD+2 (p < 0.05). Other primary findings of the study were as follows: (i) Weekly deceleration load was higher for the U20 category compared to U15 and U17; (ii) external defenders covered greater distances at high speed and sprinting than central-defenders, central midfielders, and forwards; (iii) U15 external-defenders covered greater weekly distances than U17 and U20 external-defenders, U15 and U20 midfielders demonstrated greater distances than U17 midfielders, while U20 midfielders performed more decelerations than U15 midfielders; (iv) MD+2 and MD–1 were the days of the week with the lowest distance covered for all categories; and (v) Modifications in the organisation of weekly load were observed when considering the categories and positions.
In relation to the accumulated load, a greater weekly total distance for U20 athletes was observed, as may be expected, given that the players in this category are more mature and have physical capacities closer to the final stages of development [26, 27]. Contrary to expectations, U15 players accumulated more distance than U17. This outcome may be partly explained by differences in coaching behaviours, session design, and training methodology, such as greater reliance on longer or more frequent large-area drills and continuous small-, medium-, or large-sided games, which are known to increase movement demands compared with other activities [28]. Notably, deceleration counts were significantly higher for U20 compared to the other categories (Figure 1). Deceleration involves the ability to rapidly reduce speed or stop the body within a short distance, principally relying on eccentric horizontal force capacities and neuromuscular coordination [29]. In this sense, more mature and/or physiologically developed players with superior neuromuscular qualities may be able to express these actions more frequently, both in training and during matches [30, 31]. This premise and the current results corroborate those of Teixeira et al. [32], who demonstrated higher accumulated load measures, including decelerations for players in the post-peak growth velocity stage when compared to players in the pre- and during peak growth stages.
Concerning positional differences across all categories, external defenders exhibited higher values for high-intensity running and sprinting compared to central defenders, midfielders, and forwards. However, no differences were found when compared to external midfielders. The tactical demands placed on external defenders during matches and training sessions are associated with overlapping runs and recovery sprints; actions that depend on high-speed running (> 19.8 km/h) [26]. Therefore, it is plausible that external defenders experience higher weekly loads compared to other positions [33]. Exposure to sufficient training stressors with similar demands to match-play is recommended in the literature as a strategy to prevent muscle injuries and maintain performance [4, 34]. In support of this, team sport athletes (Gaelic football) with well-developed physiological attributes (e.g. running economy, relative squat strength, VO2max) were found to exhibit lower biochemical, perceptual and neuromuscular fatigue and muscle damage markers post-match, as well as accelerated recovery, even when undertaking larger loads [35]. These collective findings underline the importance of physical conditioning attributes for load tolerance.
Furthermore, central midfielders in the U15 and U20 categories covered greater distances when observing weekly load differences according to category and position. The U15 external defenders also covered greater distances compared to the other categories. Indeed, other work in Europe found contrasting findings, where U15 players undertook less work than older young players (U17 and U18) [9]. The differences observed across categories, as well as between the Brazilian and European contexts, may be influenced by factors such as coaches’ training methods, session design, and playing style [36]. Coaches typically adapt the weekly microcycles based on tactical ideas that guide on-field activities, such as small-sided games and technical drills [37]. Studies have demonstrated the influence of coaches on the physical demands of both games and training [5, 28]. However, it was expected that U15 athletes would cover shorter distances compared to older categories due to their lower chronological age and/or maturity status.
Regarding daily planning, sessions on MD+2 and MD–1 days generally exhibited lower training loads (Figure 1). These results are similar to those observed in young athletes from the Premier League and the Portuguese Championship [38]. The weekly organisation described in the scientific literature suggests that athletes generally achieve recovery to pre-match levels on the second day after a match for most psychophysiological measures [39]. Studies indicate that up to 48 hours post-match, players may show elevated levels of creatine kinase (an indirect marker of muscle damage), reduced muscle glycogen, and decreased neuro-muscular capacity [2, 40]. Furthermore, the weekly load is typically reduced in the days leading up to matches (MD–1). This approach may reflect typical tapering strategies, wherein coaches tend to prioritise lower-demand tactical/technical-based activities, such as focusing on set-piece refinement, tactical organisation, and rehearsed plays [11, 12].
The weekly training load structure revealed significant differences across age groups. Younger athletes (U15 and U17) covered greater total distances and high-speed distances on MD–3, while U20 athletes recorded their highest values on MD–4 (Figure 1). Regarding accelerations and decelerations, MD–4 was the session with the highest mechanical demand for U15 and U17, while for U20 athletes, this demand was observed on MD–2. The activities selected by the coaches can influence variations in the external load during the microcycles. Recently, the organisation of the weekly training has been influenced by the tactical periodisation approach, which recommends using small-sided games in smaller areas with fewer players on MD–4, promoting the expression of higher mechanical demands, such as accelerations, decelerations, and direction changes [21].
On the other hand, on MD–3, training activities are conducted in larger games and spaces, allowing greater distances to be covered [41, 42]. It is possible this may explain why the U15 and U17 coaches opted for this structure. In the case of the U20 team, the structuring of activities chosen by the coach may have followed a different approach, which explains the discrepancies observed in the results presented in this study. However, it is important to note that the specific training tasks designed and implemented by each coach were not directly recorded in this study, and this remains a limitation.
This study is the first, to the authors’ knowledge, to analyse training load data from professional Brazilian male youth players across age categories (U15, U17 and U20) and positions, all of whom compete in national and international competitions. The findings provide novel insights into professional practice in top-level Brazilian football, conferring many practical implications for training prescription and load management in elite youth development settings. However, several limitations inherent to the study should be considered. While the athletes represent different age categories, the small sample size within each category and the fact that all the participants belonged to the same club may limit the generalisability of the findings. Additionally, only four weeks of training were analysed, and a longer-term dataset may have provided deeper insights, but it was logistically challenging to collect more than four weeks of data because of the fixture congestion – many weeks of the year, the athletes played more than one match. Future research should (i) extend beyond physical metrics to include the technical-tactical content covered by coaches during the training weeks, (ii) examine similar outcomes in female developmental players, and (iii) examine the effects of different microcycle structures on acute match readiness and long-term physical conditioning development.
These findings have a valuable impact in practice and provide important information for coaches and sports scientists working in the development of youth football players on the distribution of the load in relation to the day of the microcycle, position-specific differences, and age differences. Indeed, this information contributes to the current understanding of how training loads are structured in elite youth football, providing valuable reference points for coaches who seek to align their planning with current professional practices. Finally, this information can be used in the long-term planning of developing players when considering category changes.
Conclusions
In conclusion, with regard to position-specific differences, external defenders exhibit the highest exposure to high-intensity actions and sprinting during the microcycles, regardless of the age category, and U20 players accumulated higher weekly loads. Training sessions on MD–4, MD–3, and MD–2 imposed the greatest external loads, whereas MD+2 and MD–1 exhibited reduced loads. This periodisation approach conforms with common tapering strategies, likely aiming to balance ongoing physical development/maintenance with readiness to perform immediately preceding matches.