Introduction
Considering the increasing popularity of ultramarathon running during the last decades, an increasing number of studies have been conducted on several aspects, such as physiology, psychology, nutrition, and pathophysiology [1–3]. Ultramarathon races are often held as distance-limited events with 50 km as the shortest distance [4]. Furthermore, time-limited races are also held with the 6-hour run as the shortest duration [5]. Time-limited races are mainly held as 6-hour, 12-hour, 24-hour, 48-hour, 72-hour, 6-day, and 10-day races [6].
The 6-day race, as the second longest regularly held time-limited ultramarathon, is in 4th place regarding the popularity of the time-limited races [6]. This relatively low popularity among athletes is also represented in the relatively low scientific output for this specific race format. To date, a few studies have investigated 6-day races and/or 6-day runners regarding their metabolic aspects [7], musculoskeletal injuries [8], the effect on the cardiac system [9], the aspect of thermoregulation [10], the age of peak performance [4], and the sex difference in running performance [11, 12].
The USA has the longest tradition with 6-day races. The first ‘New York 6-day race’ was held in 1874 with one runner and continued until 1891 [13]. In 1875, the first 6-day race was held in Chicago, and in 1876, the first 6-day race was held in San Francisco [13]. In 1876, the first 6-day race was held in the UK in Liverpool, and in 1877, the first 6-day race took place in Edinburgh [13]. From 1876 to 1881, the ‘Long Distance Championship of England’ was held [13]. After these first ultramarathons in the 19th century, a new start of the 6-day runs occurred in the USA in 1980 with the ‘Spirit of ‘80 6-Day track race’ and the ‘Edward Payson Weston Six Day track race’ [13]. After the development of the running scene in the USA, soon, ‘Les Six Jours de La rochelle’ started in France in 1982 and continued until 1994 [13]. In the early 80s, several 6-day races were inaugurated in the USA, Great Britain, and Australia [13]. In 1985, the ‘Sri Chinmoy 1000 Mile race’ started, where a 6-day split was held [13]. Later, a 6-day split was recorded for the ‘700 Mile race’, the ‘1000 Mile race’, the ‘1300 Mile race’, and the ‘7 Day race’ [13]. Since 1996, the ‘Sri Chinmoy Marathon team’ has held a 6-day race in New York. In South Africa, the 6-day races started in the 90s with the ‘Six Day Circuit race’ and the ‘Six Day Circuit race ruimsig’ held from 1995 to 2010 [13].
Regarding the locations of these specific races, between 1991 and 1997, the ‘6 Day Stadium Run Odessa’ was held in Ukraine [13]. In 1995, the ‘1000 Mile Stadium Run Odessa’ was held, where a 6-day split was recorded [13]. Regarding the best athletes by country, rimantas Jakelaitis from Lithuania competed in 146-day runs between 1999 and 2017 with a personal best performance of 965 km [13]. He mainly competed in the ‘Sri Chinmoy 6 Day race’ in the USA. Dusan Mravlje from Slovenia finished 76-day runs, mainly in Australia, Great Britain, and France, with a personal best performance of 914 km [13].
There is knowledge about specific topics in the 6-day race format regarding sex difference, nutrition, fluid metabolism and age [7–12], but we have no knowledge about the origin of the best 6-day runners or the locations of the fastest race courses. This knowledge might encourage ultramarathoners to join running groups or running communities with specific experience in this specific race format in order to improve their personal best performance. Since only a few runners compete in this race format [6], it would be interesting to know where the fastest 6-day ultramarathoners originate. Such information could aid coaches and fitness trainers in understanding their opponents in the races better and in choosing optimal races to compete in.
Little is known about the origin of time-limited ultramarathoners [14]. Thus, the current study’s main aim was to investigate where these runners originate and where the fastest races are held. Previous studies have reported that 6-hour [14] and 12-hour [15] runners mainly originated from Europe. A very new study investigating 100-mile ultramarathons found that Eastern European countries such as Lithuania, Latvia, Ukraine, Finland, Russia, Hungary, and Slovakia had the fastest runners [16]. And another recent study investigating 72-hour ultramarathons reported that athletes from Ireland, Japan, and Ukraine were the fastest [17]. Based on these reports that European runners dominate longer ultra-running distances, we hypothesised that the fastest 6-day runners might also originate from Europe. This study investigates one specific kind of ultramarathon race and for this reason, it may have limited practical impact on all runners. However, it is reasonable to assume that the investigation is justified and provides real motivation in this specific running scene.
Material and methods
Data analysis
Data download
All race data was downloaded from the official web-site of Deutsche Ultramarathon Vereinigung – DUV (https://statistik.d-u-v.org) – using a Python script. Each race record included the athlete’s first and last name, age group, sex, country of origin, race location and year, race duration, distance achieved in km, and mean running speed in km/h. The age group variable is encoded in 5-year age groups (i.e., groups 20, 25, 30, 25…) except age group 18, which represents runners under 20 years, and age group 75, which represents 75 years and older. Country names are represented by their ISo3 code. In constructing an algorithm to predict the performance of elite ultramarathon runners, incorporating factors such as age group, sex, country of origin, race location, race duration, distance achieved in km, and running speed in km/h becomes crucial [18]. Age, sex, country of origin and race location can provide essential demographic information that can influence physiological and environmental factors affecting performance. Race location and year capture variations in terrain, climate, and competitive conditions, impacting overall race dynamics. Duration, distance achieved, and running speed offer quantitative metrics reflecting the athlete’s endurance, pace, and efficiency. Integrating these diverse parameters allows the algorithm to discern patterns, correlations, and performance trends, providing a comprehensive and nuanced approach to predicting the success of elite ultramarathon runners.
Data pre-processing
The data was checked for consistency, removing any incomplete or impossible records. Countries of origin and events were then ranked by the number of race records, for which the dataset was aggregated by the values in the athlete country (or event country) column and then sorted by participation (i.e., number of records). In both cases, running speed descriptive stats (mean, std, max, min), the number of race records, and the number of unique runners were calculated and presented for each country in two large ranking tables. In order to reduce noise and obtain representative results, any race records from athlete countries with fewer than three records were removed. While these measures will allow for an easier interpretation of the results, we must acknowledge, however, that in doing so, relevant results from some countries/runners may have been unwittingly omitted. After all the necessary processing, a total of 8,889 race records (6,737 from men and 2,162 from women) from 3,226 unique runners (2,413 men and 813 women) were identified in the 6-day race category. The runners originated from 54 different countries and participated in 141 races held in 25 countries between 1874 and 2022.
XGBoost regression model
The algorithm used is the popular XGBoost in its regression mode. The full 6-day sample of 8,889 race records was used to build, evaluate, and interpret the XGBoost regression model. The following variables were used as predictors or inputs to the model: Athlete_sex_ID, Age_group_ID, Athlete_country_ID, and Event_country_ID. The predicted variable, or algorithm output, was running speed (km/h). Two evaluation metrics, mean absolute error (MAE) and the coefficient of determination (r2), were calculated along with the model’s relative feature importances.
Numerical encoding of categorical variables
Before the XGBoost model could be trained, the values of the predictors had to be converted (encoded) into numerical data. The Athlete sex variable was encoded as female = 0 and male = 1. The Age group variable was used in its current encoding (18, 20, 25, 30…75). The Athlete country and Event country variables were encoded based on their position in the respective rankings tables, with the countries with the highest participation first.
Model training and evaluation strategy
The model training and evaluation strategy employed a hold-out approach to fine-tune the model. This involved iteratively training and evaluating various models using different test splits, along with exploring different combinations of the number of estimators and learning rates. After multiple iterations and tests, the optimal model parameters were determined to be 500 estimators and 0.5 for the learning rate, and this best model obtained an r2 score of 0.46 during in-sample testing with an MAE of 0.65 km/h. This strategy allows for a robust assessment of model performance, enabling the identification of optimal hyper-parameters that contribute to a balanced trade-off between model complexity and predictive accuracy. The reported r2 score and MAE provide insights into the model’s ability to explain variance and the average prediction error, respectively, offering a comprehensive evaluation of its predictive capabilities.
Model interpretation
The model accuracy value of r2 = 0.46 indicates the model can explain 46% of the variability of the target (running speed). Partial dependence plots (PDP) and prediction distribution plots were computed and compared to the descriptive charts for easy analysis. All computations and analyses were done using a Jupyter notebook (Google Colab) and running Python and associated libraries (pandas, numpy, xgboost, pdpbox, sklearn, matplotlib, sns).
Results
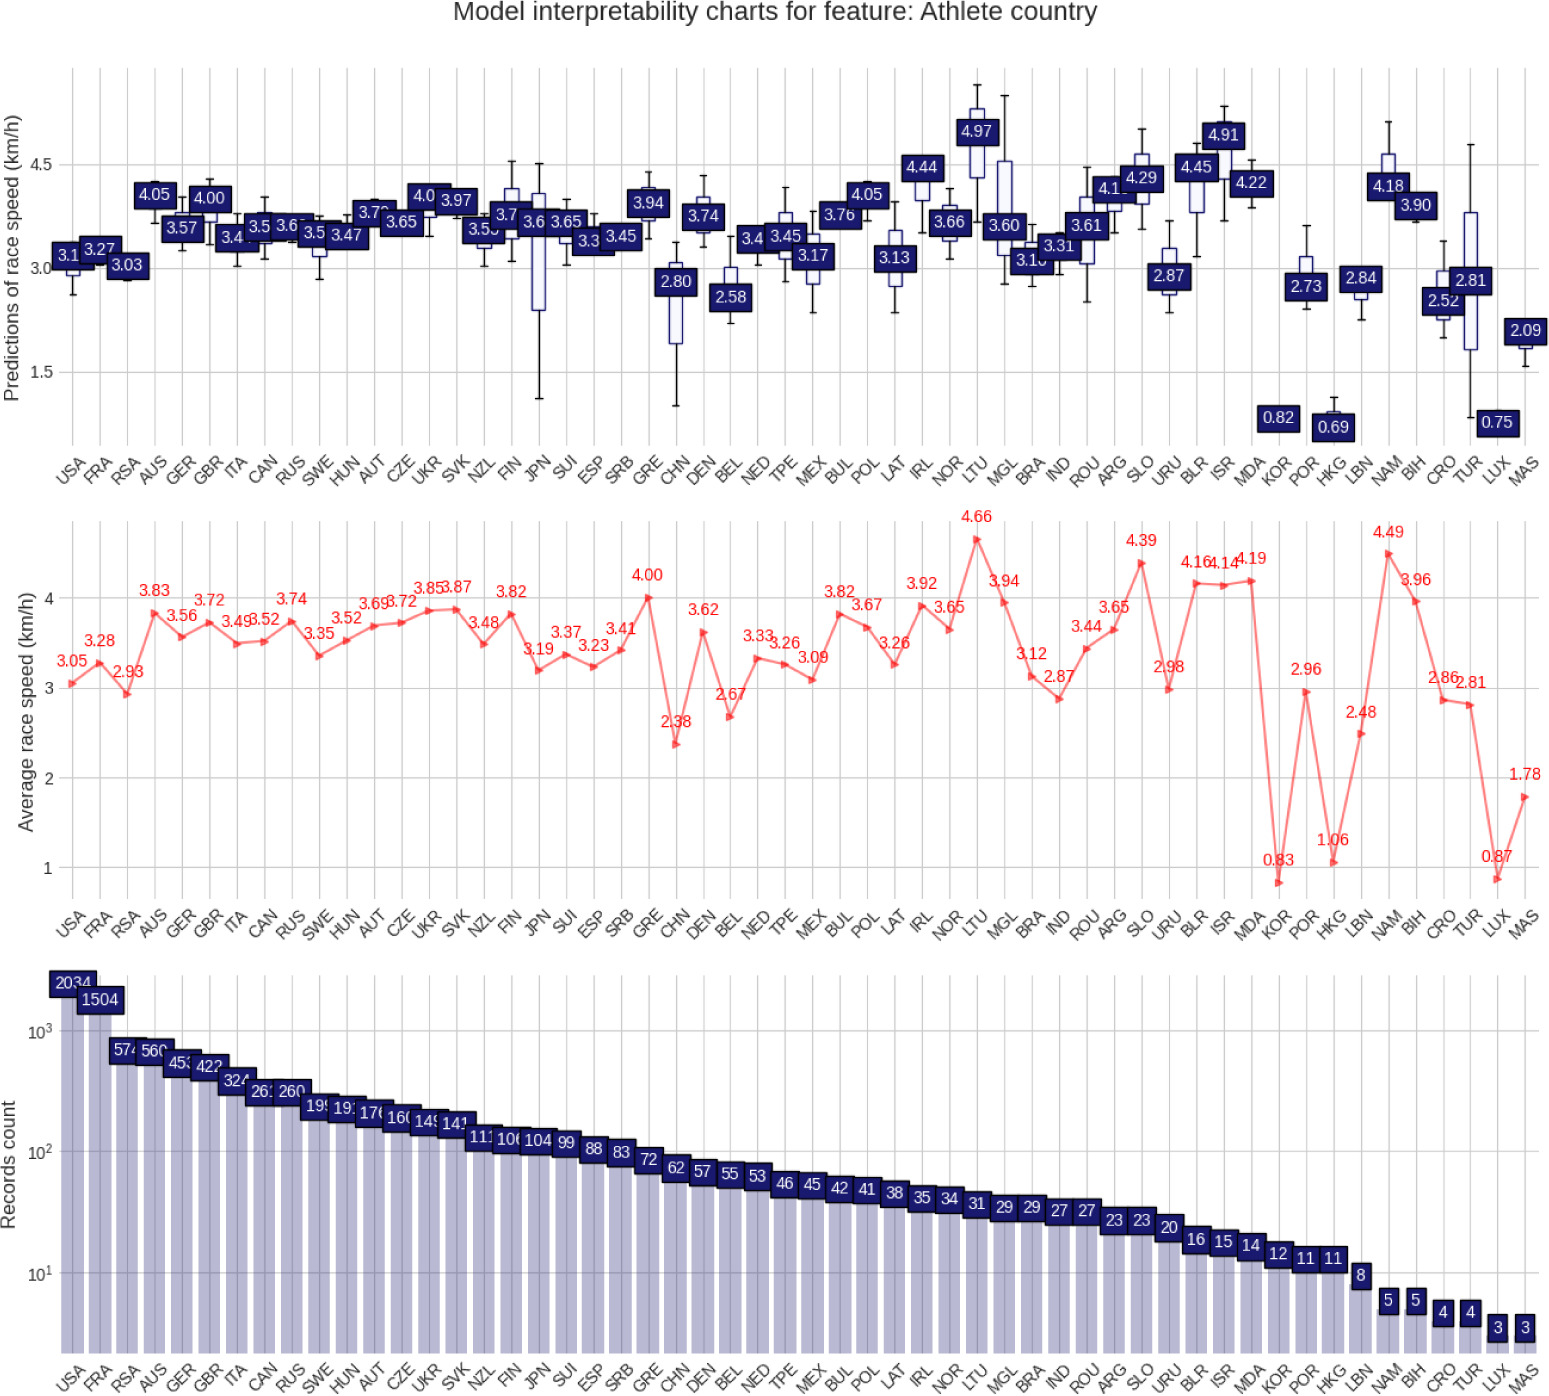
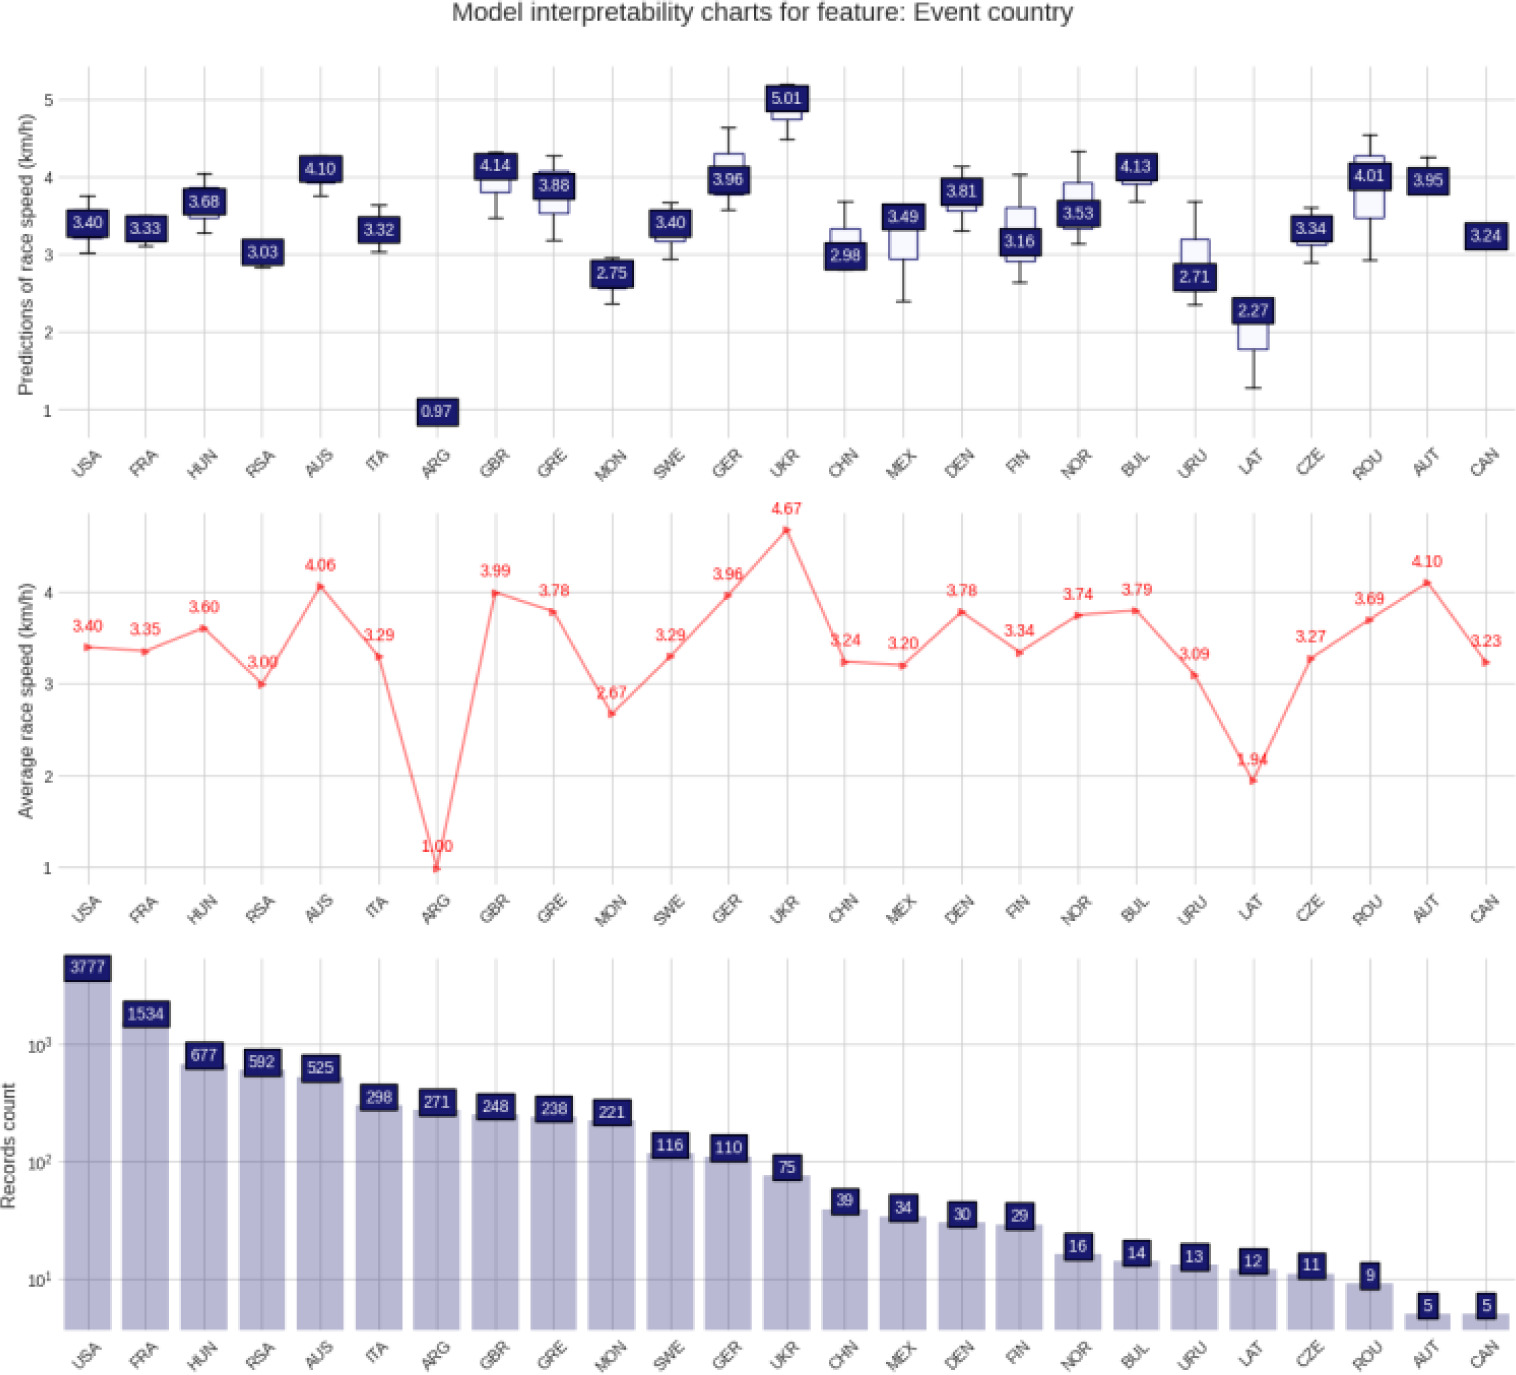
After all the necessary processing, the final sample consisted of 8,889 race records (6,737 from males and 2,162 from females) from 3,226 unique runners (2,413 men and 813 women) from 54 countries participating in 141 races held in 25 countries. Athletes from the USA, France, South Africa, Australia, Germany, and the UK accounted for ~62.5% of the sample size, and ~60% of the 6-day races took place in the USA and France (Table 1). Athletes from Lithuania, Slovenia, and Namibia (all with small sample sizes) led in the athlete country rankings, while the slowest runners originated from Asian countries (i.e., Korea, Hong Kong, and Malaysia) (Table 1). Ukraine holds the fastest 6-day races (albeit having held only two), with Austria and Australia following distantly (Table 2). The only 6-day race ever held in Argentina was the slowest. The mean running speed in the ranking tables is colour-coded, with darker colours corresponding to higher values (i.e., faster running speeds).
Table 1
Athlete country ranking
Table 2
Event country ranking
XGBoost regression model
Evaluation metrics and features relative importances
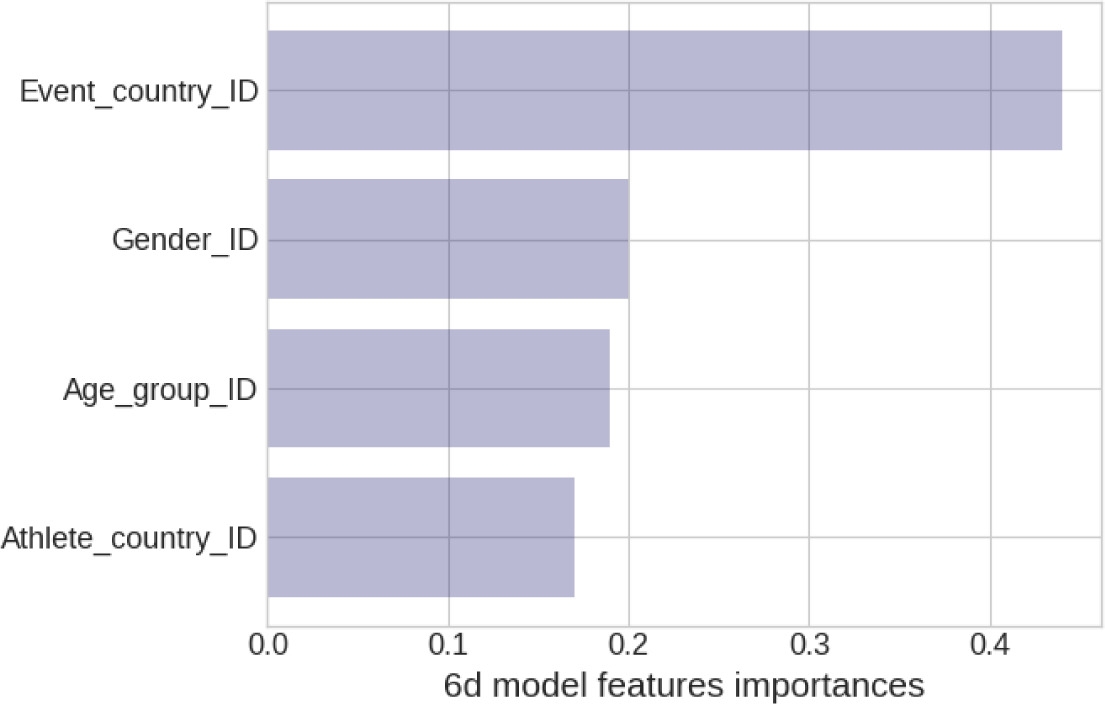
The model (Figure 1) rates the Country of event (0.44) as the most important predictor (based on data’s entropy reduction) followed by Sex (0.20) and Age group (0.19), and in last place the Athlete country of origin (0.17).
Partial dependence plots (PDP)
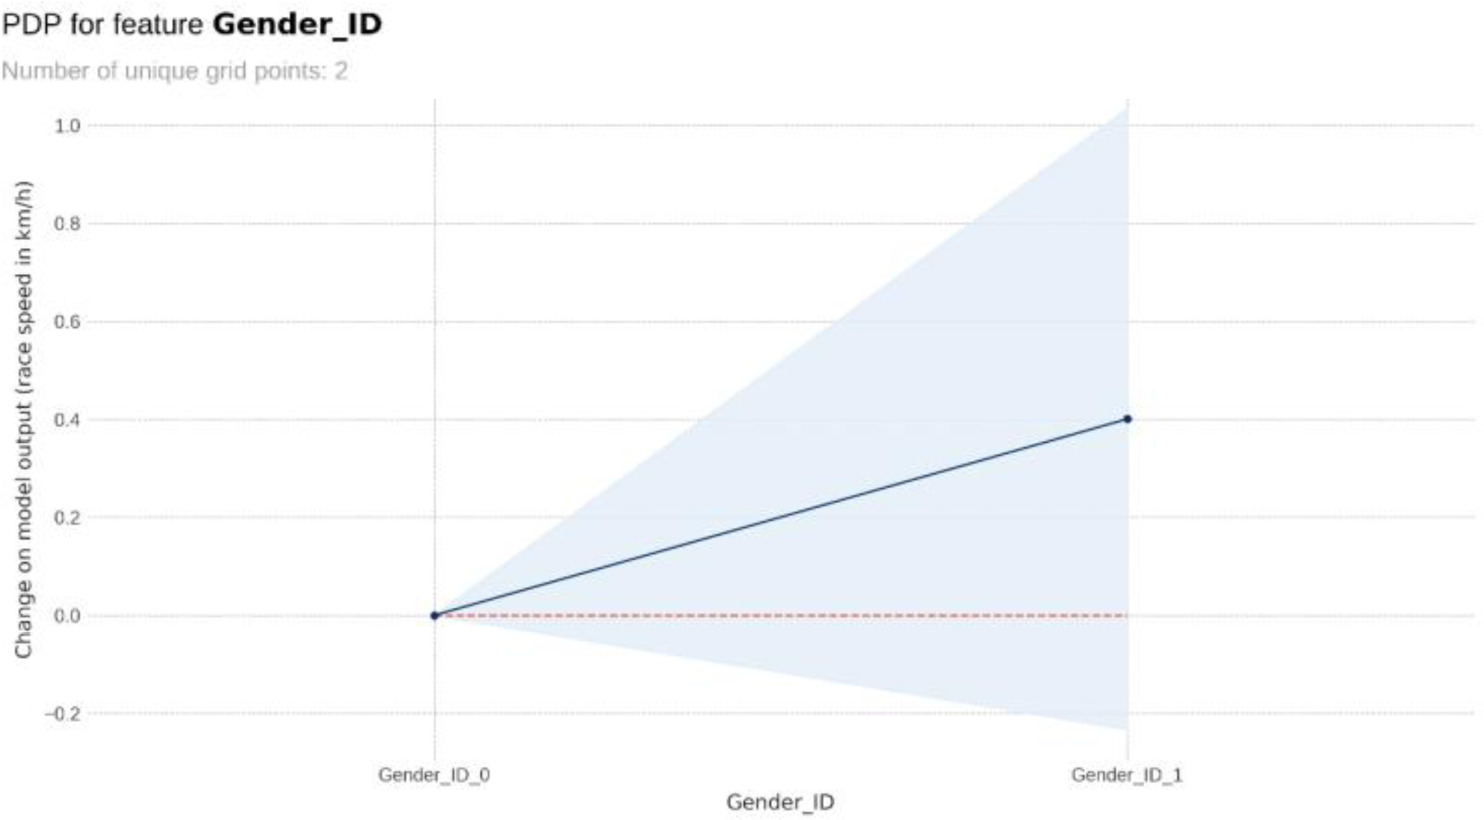
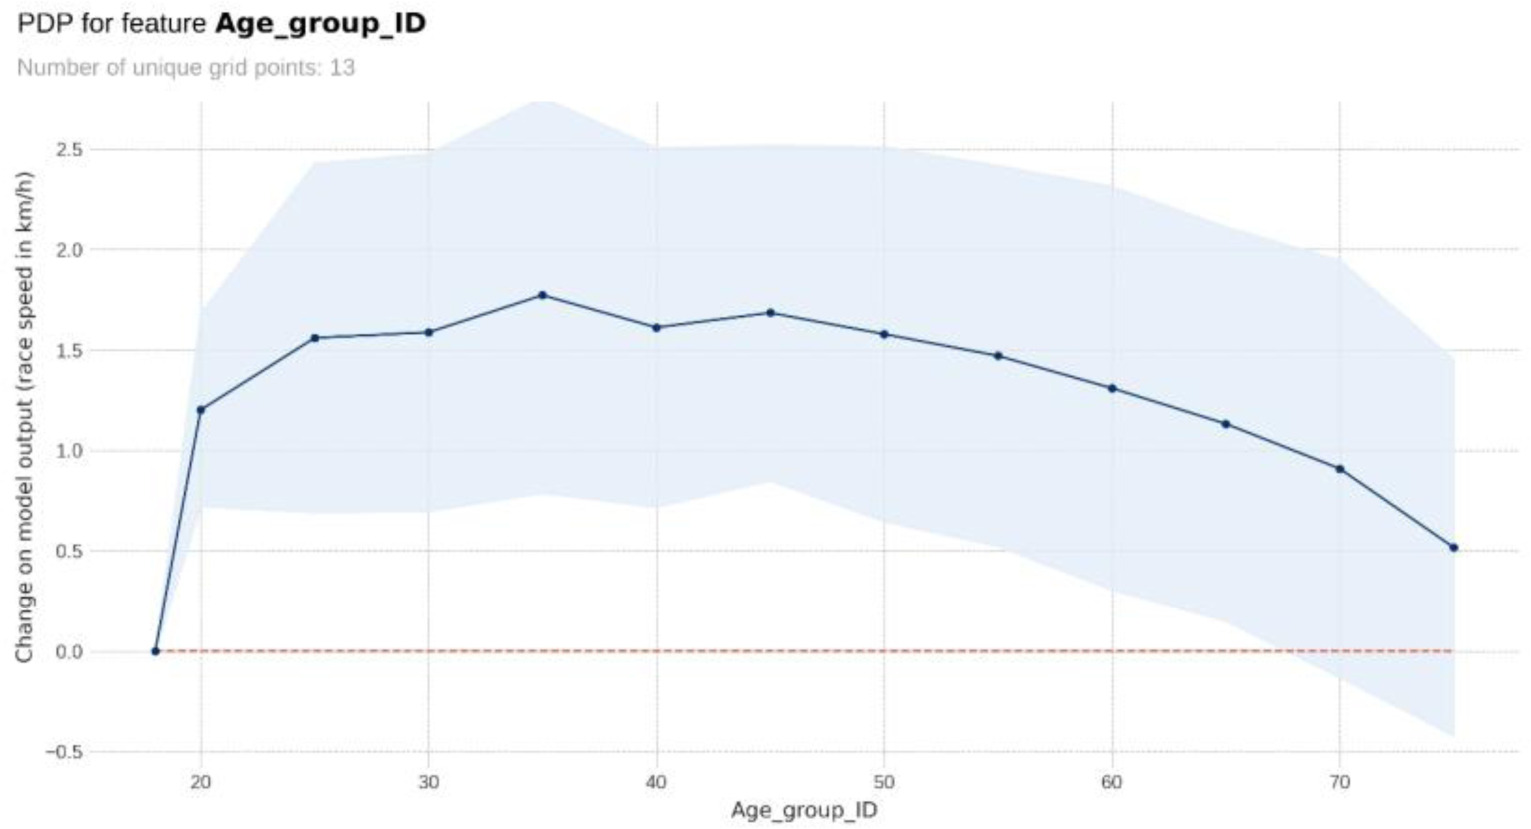
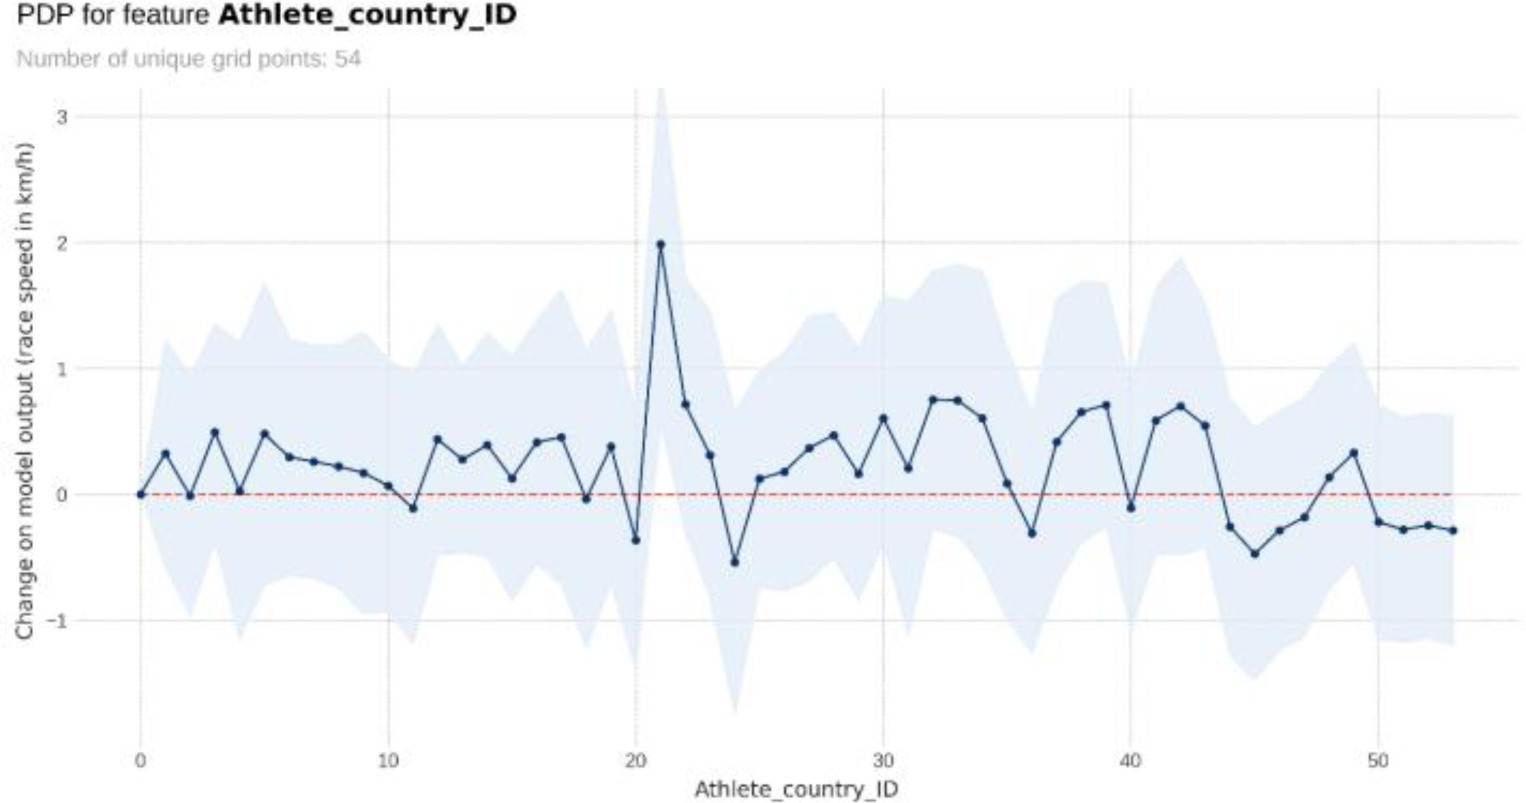
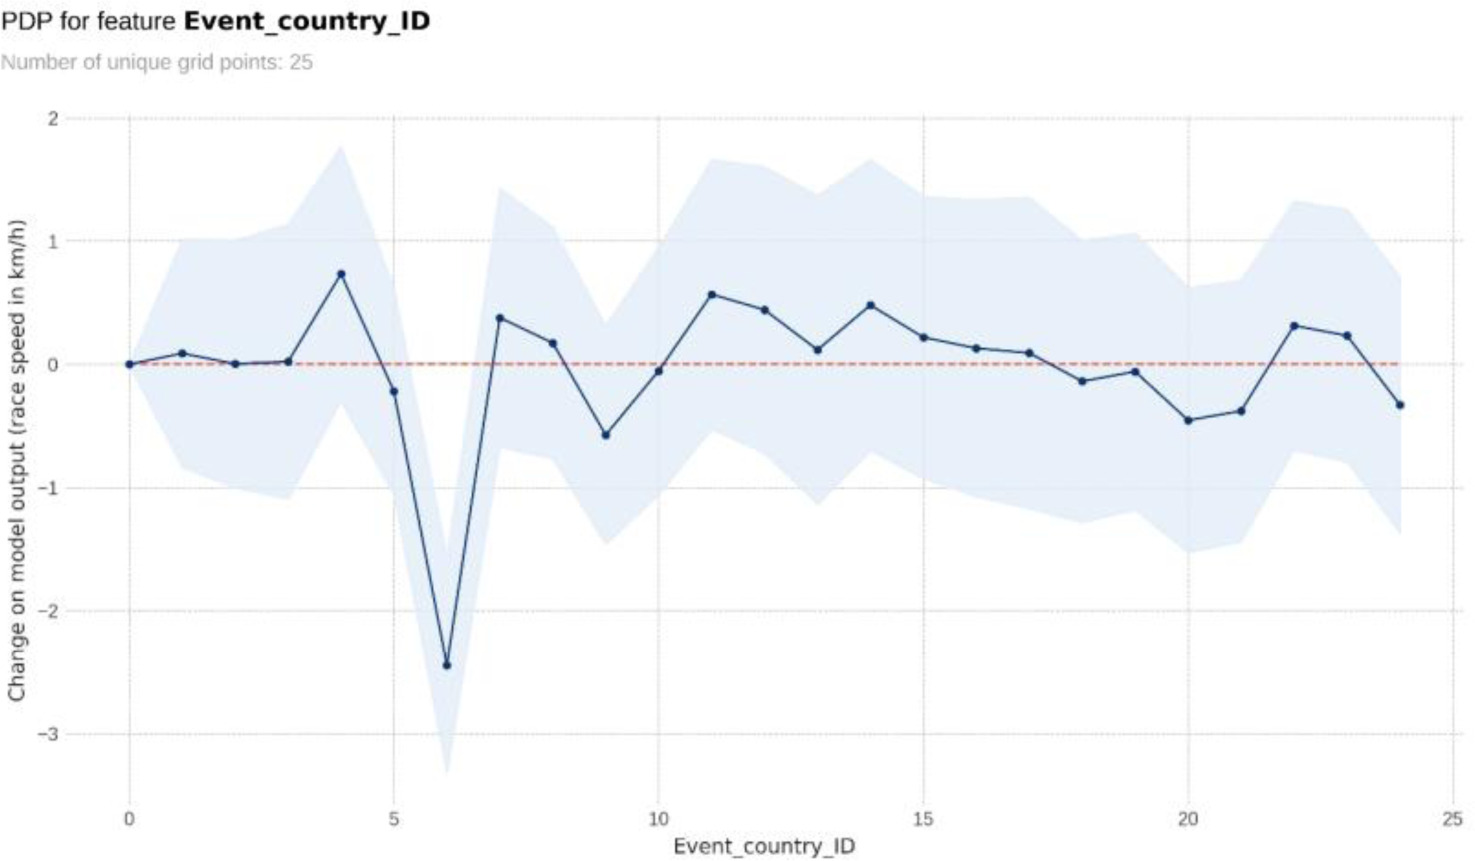
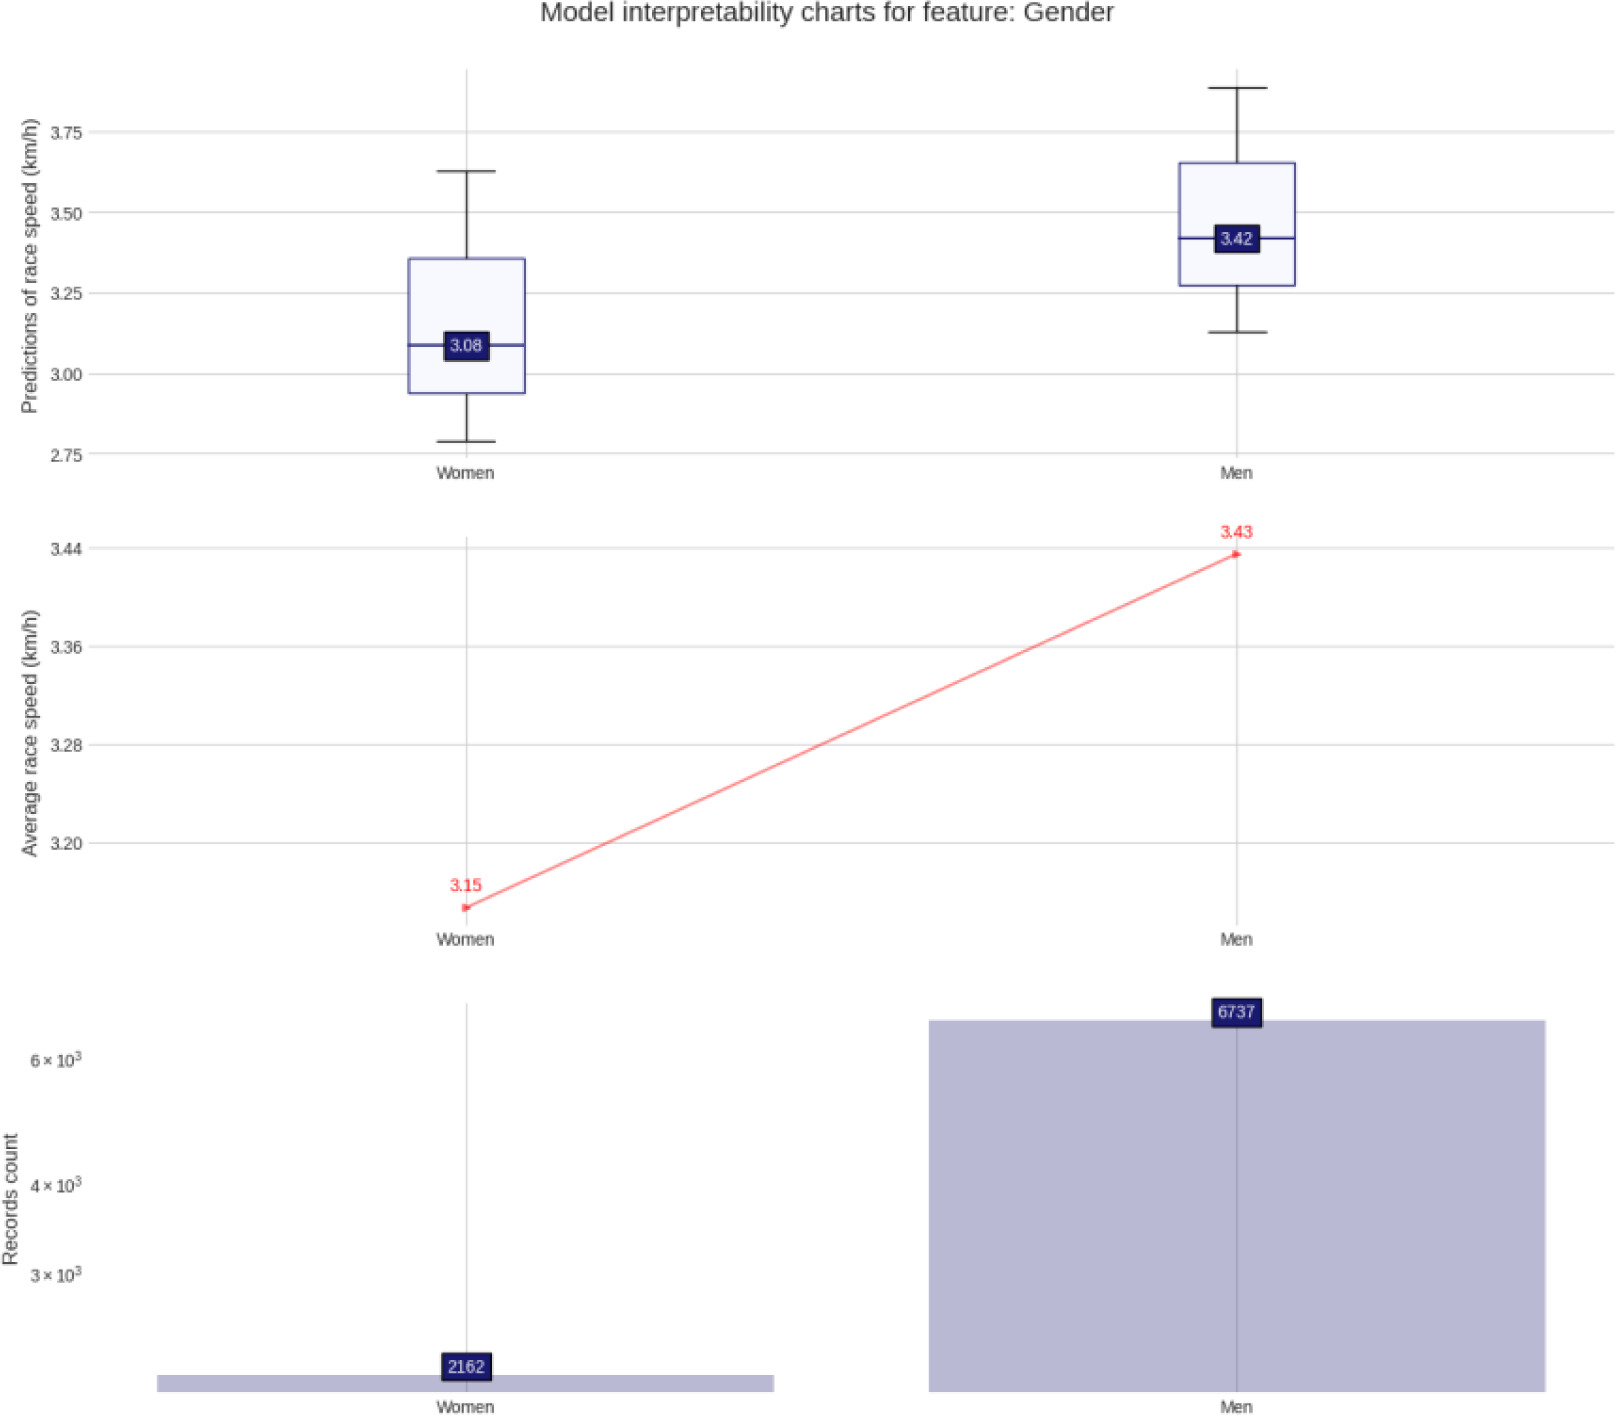
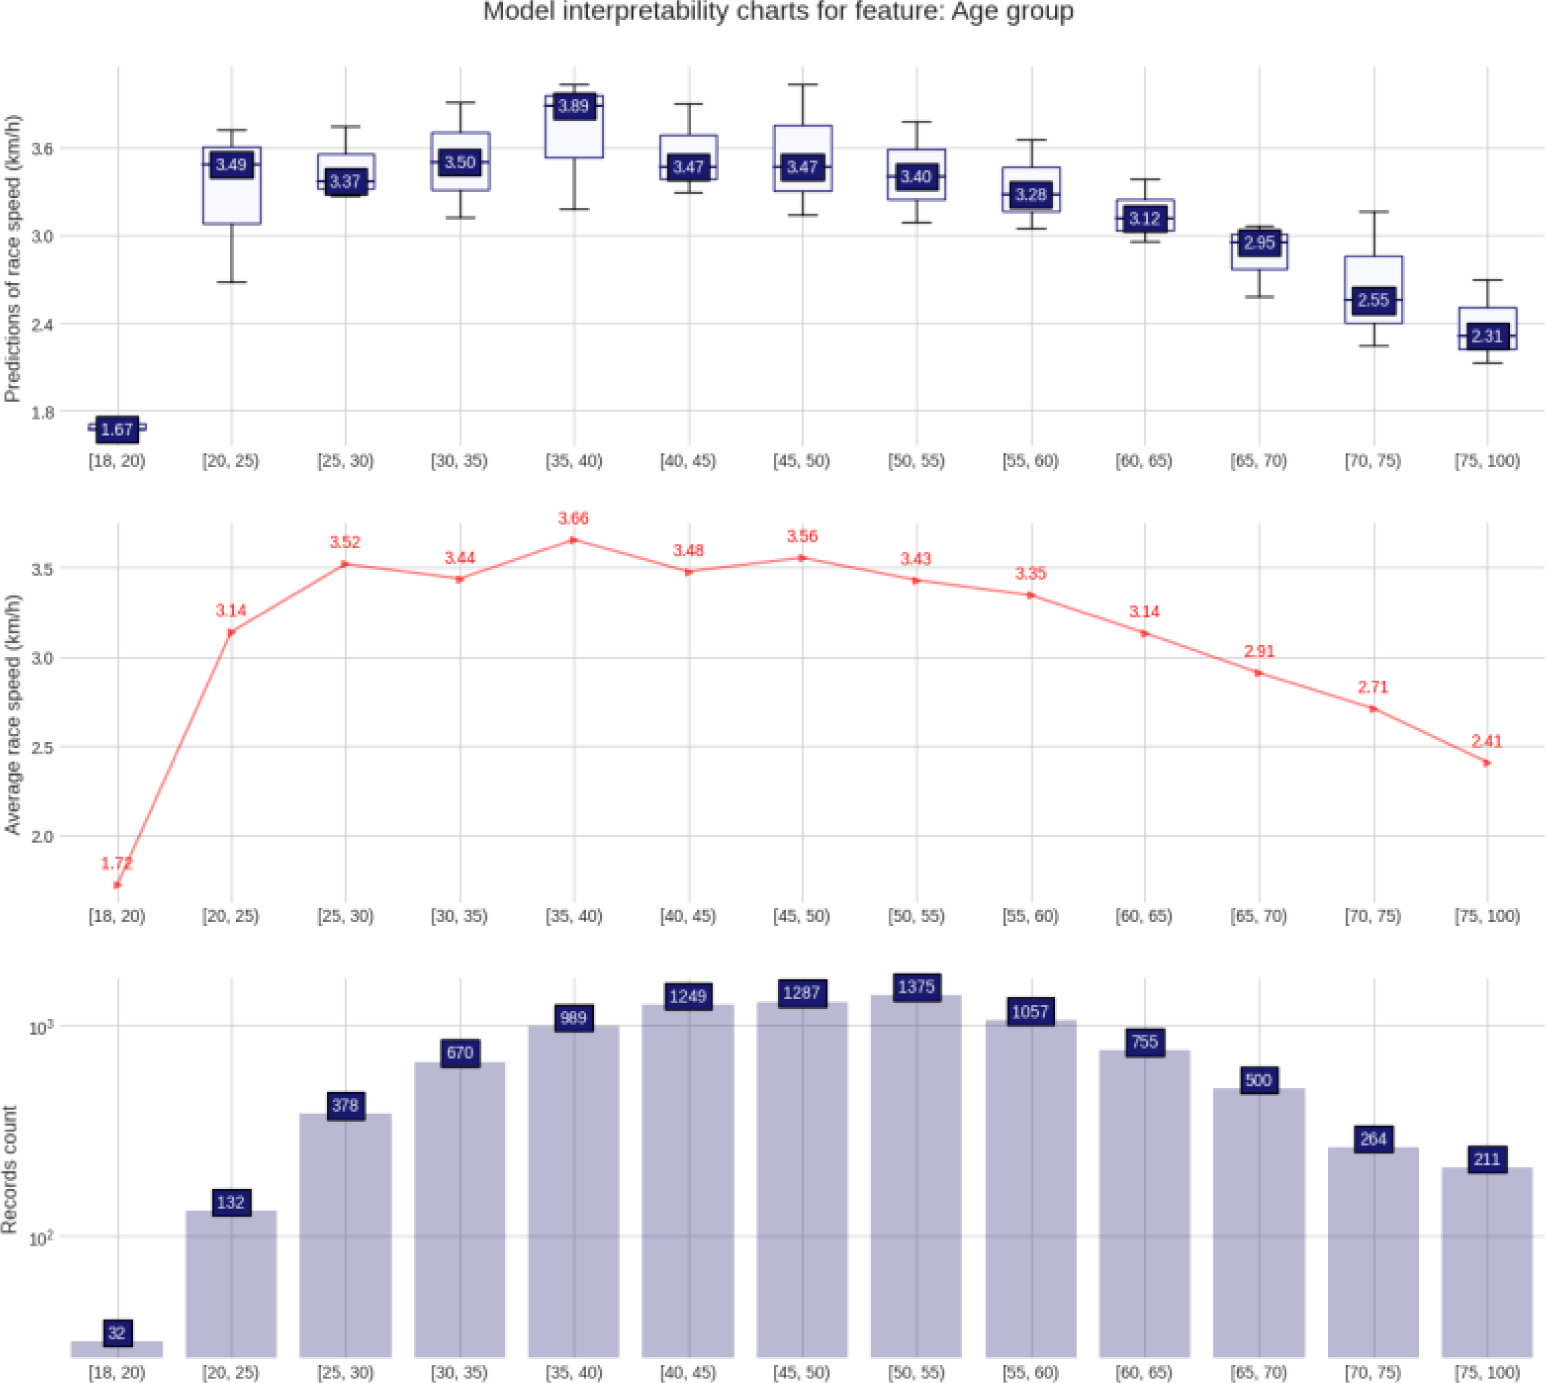
The PDP plots show the relative amount of change on the model output for the different values of each predicting variable in respect of a reference value (value 0). Regarding sex (Figure 2), men were ~0.4 km/h faster than women. The fastest running speeds were achieved by runners in the age group 35–39 years (Figure 3). Outputs by athlete country peak at ID 21 (Greece), mostly influenced by the maximum running speed values in the sample (Figure 4). Outputs by event country are fairly flat in the positive half, with a sharp negative peak at ID 6 (Argentina), corresponding to a comparatively very low average running speed (Figure 5).
Prediction distributions and target plots
The model prediction distribution is plotted with boxplots and against the average speed. The average difference between the male and female predictions is ~0.35 km/h (Figure 6). The 35 years age group leads in performance (Figure 7). The rest of the results are quite consistent with the descriptive results from the ranking tables, with Lithuania, Slovenia, and Namibia being the fastest countries of origin (with slow runners coming from Asian countries) (Figure 8), and Ukraine holding the fastest 6-day races and Argentina the slowest (both with very small samples) (Figure 9).
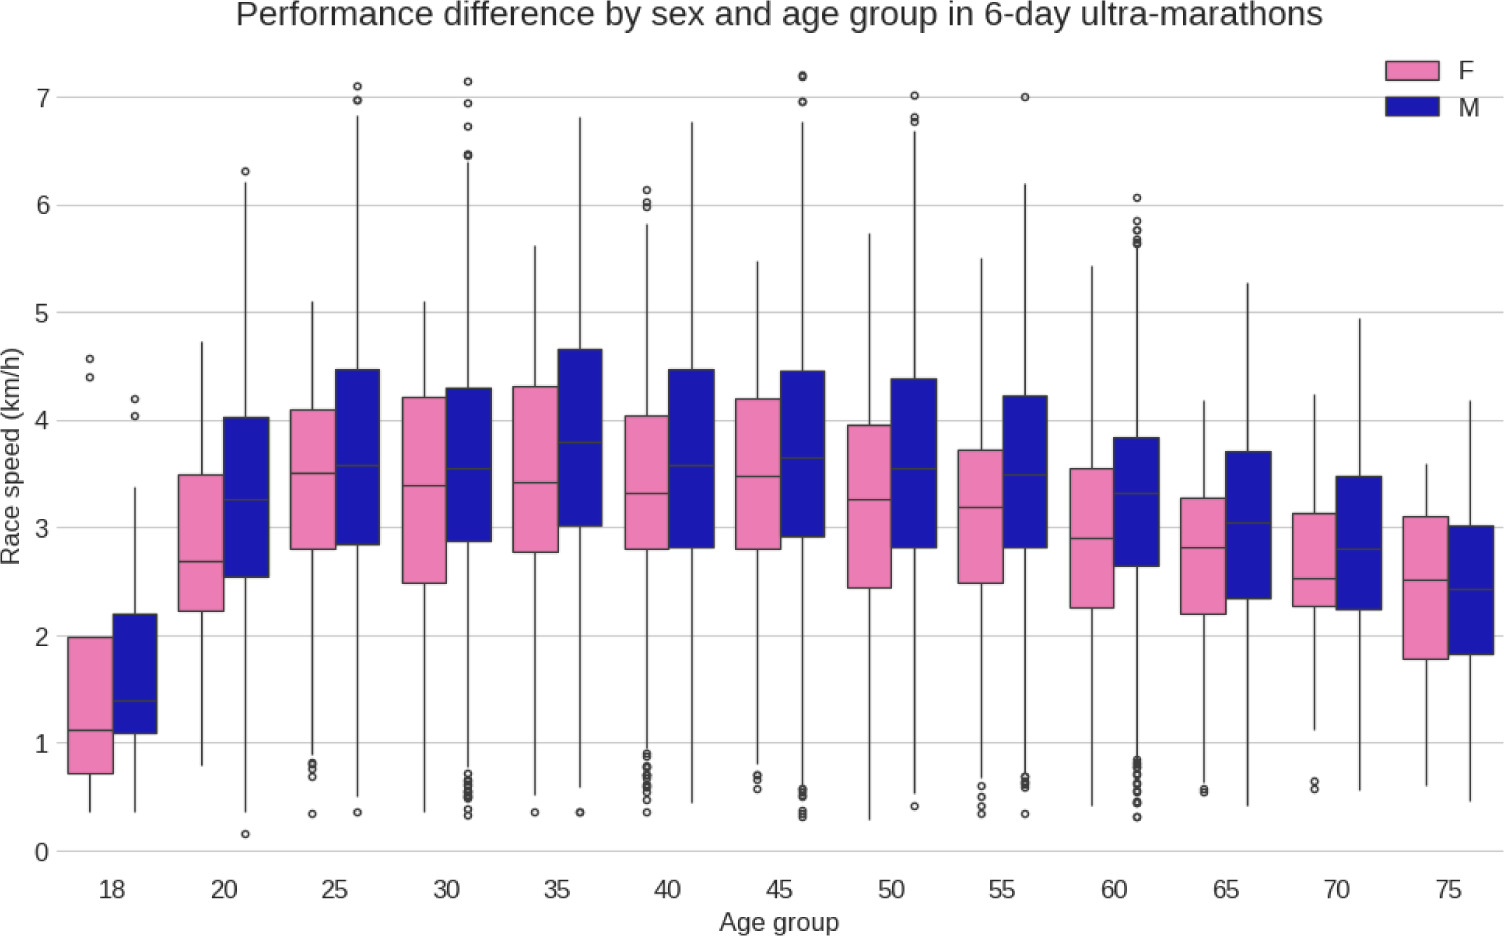
Performance difference by sex and age group
Figure 10 presents the sex difference in performance between women and men for each age group. Men were faster than women in all age groups, except the 75 years age group.
Discussion
In this study, we investigated where the fastest 6-day runners originate and where the fastest 6-day race courses are located. Based on existing findings that the fastest 6-hour, 12-hour, 72-hour, and 100-mile ultra-marathoners originated from Europe, we hypothesised that the fastest 6-day runners would also originate from Europe. We can confirm our hypothesis since the fastest runners originated from European countries, and more specifically from Eastern Europe (i.e., Lithuania and Slovenia). Other important findings were that the model rated the race location as the most important predictor of performance, where Ukraine holds the fastest 6-day races, with Austria and Australia in second and third place, respectively; most athletes (62.5%) were from the USA, France, South Africa, Australia, Germany, and the UK; ~60% of the 6-day races took place in the USA and France; men were ~0.4 km/h faster than women, and the fastest runners were in the 35–39 years age group.
Origin of the athletes
We found that more than 60% of the 6-day runners were from the USA, France, South Africa, Australia, Germany, and the UK, and ~60% of the 6-day races took place in the USA and France. It should be highlighted that among these six countries of origin, four were listed in the top seven economies in the world by gross domestic product [19], which indicates the importance of economic resources in this race. This result can be explained by the significant representation of runners from the USA, France, South Africa, Australia, Germany, and the United Kingdom, comprising more than 60% of the total participants in the 6-day races. Additionally, the concentration of ~60% of the 6-day races in the United States and France further contributes to this distribution, where an important participation of local runners was noticed. Factors such as the popularity of ultramarathon events in these countries, the presence of established running communities, and the cultural enthusiasm for endurance sports could all contribute to the observed patterns [20]. Furthermore, logistical considerations and the availability of suitable race venues may influence the geographic distribution of these events, favouring certain countries over others [21].
Europeans are the fastest in 6-day races
Athletes from Lithuania, Slovenia, and Namibia were the fastest, and Ukraine held the fastest 6-day races. Most importantly, the model rated the race location as the most important predictor. This finding was not expected since we set our focus on the origin of the fastest runners with the hypothesis that they originate from Europe. Based on existing findings that the fastest runners of shorter time-limited ultramarathons originate from Europe, we might expect that the fastest race locations might also be located in Europe. Also, European dominance has been reported in other ultra-race formats. Regarding ultramarathon running, a recent study investigating the 24-hour ultra-marathon race format showed that most 24-hour runners originated from European countries (France, Germany, Great Britain, Italy, Russia, and Austria) apart from runners from the USA, Japan, Australia, and Canada. Also, the fastest race courses were found in European countries such as Romania, The Netherlands, and Russia, apart from Israel, Korea, and Taiwan. The fastest 24-hour races are recorded in Israel, Romania, Korea, The Netherlands, Russia, and Taiwan. Regarding performance, however, mainly East European runners from Russia, Latvia, Lithuania, Croatia, and Slovenia were the fastest apart from runners from Tunisia, Iceland, and Israel [22]. In long-distance triathlons such as the IroNMAN® triathlon, the fastest race times were achieved in European races such as IroNMAN® Copenhagen, IroNMAN® Barcelona, IroNMAN® Frankfurt, and IroNMAN® Kalmar, apart from IroNMAN® Hawaii (USA) and IroNMAN® Florianópolis (Brazil). Regarding performance, European athletes from Belgium, Denmark, Switzerland, Austria, Finland, and Germany were the fastest [23].
The observation that athletes from Lithuania, Slovenia, and Namibia were the fastest suggests that individual athlete performance from these countries may be influenced by various factors such as training regimens [24], genetic predispositions [25, 26], or sociocultural attitudes towards long-distance running [27]. Considering Lithuania, its runners might have great potential in ultramarathon running. In 2022, Aleksandr Sorokin from Lithuania broke his own world record in 24-hour running to set the new world record at 319.614 km [28]. In 2023, he broke his own world record in 100-km ultramarathon running to set the new world record at 06:05:35 h:mm:ss [29]. Slovenia has a long tradition beginning in 2001, with different trail runs in the Alps, such as the SAM (Slowenischer Alpen Marathon) [30], and the ‘trans Slovenia ultra run’ [31]. Namibia offers different desert runs such as the ‘Sahara race Namibia’ [32], the ‘Desert Ultra 250 km Stage race’ [33], and ‘the Namib race’ [34].
The finding that the fastest 6-day races are found in Ukraine could be attributed to the specific race conditions, terrain, or overall organisation of events in that country [35]. Geographic and environmental factors and the elevation profile of the race routes could play a role in determining the race speeds [36]. Most notably, the model highlighting race location as the most crucial predictor indicates that the location of the race itself has a substantial impact on the overall performance [37]. This could encompass a range of factors, including climate, altitude, terrain, and logistical aspects, which can significantly influence the runners’ ability to maintain high speeds over an extended period [38].
Little is known regarding the European dominance in running. A recent study investigating European senior runners from 10 to 42 km showed that most runners were from the United Kingdom, Spain, and Germany [39]. Also, over longer race distances, European athletes seem to dominate. A study investigating master IroNMAN® triathletes showed that the fastest age group of IroNMAN® athletes are from Europe [23].
The fastest 6-day races
Ukraine holds the fastest 6-day races (with only two races), with Austria and Australia following distantly. This result can be explained by the historical context and specific characteristics of the 6-day races held in Ukraine. Apart from historic aspects, interest in participation, better training options and more suitable terrain (i.e. Running surface) might also have an influence [40]. In Ukraine, the ‘6 Day Stadium Run Odessa’ was held from 1991 to 1997 as a track race with a course record of 877 km from Aleksandr Glebov [13]. The ‘1000 Mile Stadium Run Odessa’ recorded a 6-day split from 1995 to 1997 with the best performance of 846 km by Petras (Piotr) Silkinas [13]. This race was also held as a track race. The mention of the ‘6 Day Stadium Run Odessa’ and the ‘1000 Mile Stadium Run Odessa’ provides insights into the nature of these events, which took place on a track in odessa during the specified time periods. The fact that the best 6-day performances are achieved in Ukraine may be attributed to several factors, such as track running.
The events mentioned, particularly the ‘6 Day Stadium Run Odessa’ and the ‘1000 Mile Stadium Run Odessa’, were held on a track [13]. Track races often provide a controlled environment, allowing for consistent conditions and enabling athletes to maintain a steady pace [41]. The specific records mentioned, such as Aleksandr Glebov’s 877 km in the ‘6 Day Stadium Run Odessa’ and Petras (Piotr) Silkinas’ 846 km in the ‘1000 Mile Stadium Run Odessa’, highlight exceptional individual performances during those events. These records may have contributed significantly to Ukraine’s reputation for hosting fast 6-day races.
Regarding the historical perspective, the reference to races held from 1991 to 1997 indicates a historical period when these events took place. Historical data, race traditions, and the athletic culture during that time may have influenced the competitiveness and speed of these races [42]. In Austria, a 6-day split was recorded with the ‘Self-transcendence 3100 Mile race’ [13]. In Australia, the ‘Colac Ultra Marathon’ started in 1984 and was held until 2005 as a track race [13]. Yiannis Kouros from Greece set the course record in 2005 with 1036 km [13]. In 1988, the ‘Campbelltown Australian 6 Day race’ started with a course record of 902 km [13]. Between 1994 and 2000, the ‘Nanango 1000 Mile track race’ was held as a track race and recorded a 6-day split time [13]. And in 2018, the ‘Adelaide 6 day’ started as a road race [13].
The sex difference in performance
The average difference between male and female predictions is ~0.4 km/h. Generally, men are faster than women in time-limited ultramarathons such as the 6-hour, 12-hour, and 24-hour [11, 42, 43]. The age of an athlete and the distance/duration of a race, however, have an influence on the sex difference. It has been shown that the sex difference in performance decreased with the increasing race distance /duration [11] and increased age of the athletes [44]. Overall, the difference of ~0.4 km/h is very small. It is well-known that the gap between men and women shrinks when the running distance increases, demonstrating that endurance is greater in women. However, although women narrow the performance gap with men by increasing the race distance, the top men still outperform the top women [11]. The performance disparity between male and female ultramarathoners can be attributed to physiological [3] and biomechanical [45] differences. On average, men generally possess greater muscle mass, higher levels of haemoglobin, and a higher aerobic capacity compared to women [46, 47]. These factors contribute to enhanced oxygen-carrying capacity and improved endurance, allowing male runners to sustain higher speeds for longer durations [48]. Additionally, hormonal variations, such as higher testosterone levels in men, can contribute to increased muscle strength and power [49]. While individual variations exist, these biological differences collectively contribute to the observed performance gap in ultramarathons [47]. It is important to note that this explanation focuses on general trends and does not discount the remarkable achievements and capabilities of individual female ultramarathon runners who have excelled in the sport. Differences in the performance between female and male ultramarathoners might also be due to participation [50], previous experience [51], psychological differences [52], training [53], nutrition [54, 55], or supplement intake [56].
We found that women in the 75 years age group were faster than men in the same age group. This specific finding confirms recent findings in a very large data set investigating over 1,100,000 race records from Switzerland over two decades (1999–2019), where female ultramarathoners of 75 years and older showed a sex difference in performance of less than 4% compared to male ultramarathoners. It was assumed that this finding was due to the presence of highly selected outstanding female runners and the small sample size in this age group [44].
The age of peak performance
We found that athletes in the 35–39 years age group were the fastest, which is in line with other studies in marathon running [57–59]. It has been reported that master runners (i.e., athletes of 35 years and older) dominate ultramarathons such as time-limited races, where runners in their forties often dominate long-distance ultramarathons [60]. While we found the age of peak performance in 6-day races is the 35–39 years age group, an older study investigating the age of peak ultramarathon performance for runners competing in time-limited ultramarathons held from 6 to 240 h (i.e., 10 days) over 1975–2013 reported a peak of ~44.8 years [6]. The difference might be due to the different periods of time, where the present study considered a longer time frame, and also because the training methodologies and technologies have improved [61–63].
Overall, it is interesting to note that master runners are the best in ultramarathon running. This might be due to training experience [64] and participation in running events [64]. Also, motivational reasons might play an important role [65]. The ageing process can significantly influence various factors that impact sports performance, potentially influencing the predictive capacity of algorithms [66]. Factors such as muscle mass, aerobic capacity, recovery times, and injury susceptibility undergo notable changes with age, influencing overall athletic performance [67]. The impact of ageing on athletic performance is not uniform across different sports disciplines. While certain physical attributes may decline with age, older athletes’ accrued experience and mental maturity could endow them with strategic advantages in specific competitive scenarios [68]. This intricate relationship between physiological factors and ageing in shorter competitions not only underscores the complexity of athletic performance but also underscores the necessity of a multidisciplinary approach in analysing athletes’ performance in diverse competitive contexts [69].
A nuanced understanding of these factors can inform more effective training strategies, challenging stereotypes associated with age in the sporting realm and recognising the diversity of athletic performance trajectories [70]. Furthermore, it was noticed that the age of peak performance in 6-day races (35 years) was older than the age of peak of characteristics related to ultra-endurance performance, such as maximal oxygen uptake (Vo2max) [6], which indicates that the other abovementioned factors (e.g., training, participation in events, motivation, and mental maturity) were more important than biological characteristics such as Vo2max.
Sociodemographic aspects
Athletes competing in this race format do not need to finish a race within in certain time limit; they can take their time to achieve their personal goal. Athletes without a specific goal who run for pleasure, company, atmosphere, participation, etc. Might experience the same level of satisfaction as athletes who intend to achieve their personal goal [71]. These athletes who only participate with no specific aim might rather experience strong emotions related to the participation, the desire to feel unity and the integration with other people, and the desire to test themselves [72]. Such ultramarathons are – in contrast to shorter running races such as half-marathons or marathons – not mass events [72]. Nonetheless, organisers need to take care of the financing of the race, organisation of the event, contact with the local community, etc. [73, 74]. However, athletes and their support crews will also be engaged in consumption before, during and after the event [75] leading to publicity for the race directors, in turn leading to more participants in the following editions. Furthermore, such an event might have a positive impact on the host city’s image [76] and may also contribute to the sustainable development of tourist regions [76] since both athletes and support crews are also tourists apart from supporting the event with their presence [77].
Limitations and implications
The results were a summary of the observations across both descriptive charts (i.e. Target plots) and model interpretability charts (PDP and prediction plots). Some countries with small sample sizes but with faster runners might have been excluded from the analysis due to the methodology used. We also excluded athletes with missing first names, last names, and ages. Another important aspect to be considered was the reliability of the data. Since we were using secondary data from the official results of the events, we can guarantee the accuracy of the information. Athletes could have changed their country of residence/nationality over the years and started in or for another country, which was not considered in the present study. Similarly, qualitative information (i.e., trail, track, road, surface, etc.) regarding the event location was not considered. A very recent study showed that flat race courses led to faster running speeds than hilly courses in 72-hour ultramarathons [17]. This was an important limitation because it impairs the generalisation of the findings regarding the environmental characteristics that had a positive impact on athletes’ performance. A further limitation is that we have not considered athletes with several race finishes. On the other hand, a strength of the present study is its novel methodological approach since it is the first time that a machine learning model was used to predict 6-day running performance from age, sex, country of origin, and event country. Furthermore, our findings provide practical information for professionals working with ultramarathon runners to set optimal performance goals depending on the event country. Future studies might separately investigate the type of race (i.e., trail, track, road, etc.).
The current model presents an intriguing perspective but is susceptible to potential biases and selection bias due to the predominant representation of runners from a few specific locations. To address this limitation, an engaging avenue for research involves examining the performance of these athletes specifically on the first day of competition, and conducting a comparative analysis with athletes from diverse nationalities participating in the same race distance. By scrutinising these athletes’ 10, 15 and 42 km times on a global scale, the study could yield valuable insights into the variations in performance across different populations. This expanded dataset, incorporating athletes from multiple countries, not only enhances the algorithm’s reliability but also fosters a more comprehensive understanding of the factors influencing elite ultramarathon performance. In essence, the potential lies in developing an algorithm that draws from a diverse range of athlete demographics, thereby mitigating inherent biases associated with a more localised focus. Future studies also might investigate the genetic potential of these athletes, their training conditions, and their previous race experience.
Conclusions
Primarily East-European runners, specifically from Lithuania and Slovenia, were the fastest in 6-day ultra-marathons. Most of the races took place in the USA and France. The fastest 6-day races were held in Ukraine. The format of the races in Ukraine was mainly track races. Any ultramarathoner intending to achieve a fast personal best performance in 6-day running should select a 6-day race held as a track race.