Introduction
Breaststroke is, apart from butterfly, backstroke, and freestyle, one of the four swimming strokes where elite and age group swimmers compete at distances of 50, 100, and 200 m [1-3]. Together with the other strokes, breaststroke is also part of the individual medley [4, 5].
Scientific research on breaststroke swimming focuses primarily on elite swimmers [6, 7], investigating technical aspects like race kinematics [3], stroke kinematics [8, 9], arm-leg coordination [2, 10-12], breaststroke kick [13], anthropometric characteristics [14], critical velocity [15], and physical and physiological parameters related to the energetic cost of swimming [16]. Furthermore, the influence of maximal strength performance of the upper and lower extremities and trunk muscles on different sprint swimming performances in adolescent swimmers has been investigated [16-19].
Examining the effects of age and sex on swimming performance in elite age group breaststroke swimmers involves delving into the scientific literature. Research indicates that age-related changes impact crucial physiological factors for swimming performance, such as muscle mass, strength, and cardiovascular endurance [20]. Older athletes may experience a decrease in muscle mass and strength, which could affect the force generation required for efficient breaststroke movements [21]. Additionally, age-related changes in joint flexibility and function can influence the range of motion during arm and leg movements inherent to breaststroke [22]. Sex differences also contribute to performance variations, as studies suggest that males often exhibit greater muscle mass and strength than females [23]. Hormonal influences, especially during adolescence, can play a role in developing physical attributes relevant to swimming performance [24]. Understanding these age and sex-related factors is essential for coaches and athletes to tailor training programs, emphasise strength and flexibility for older swimmers, and recognise the unique physiological considerations associated with each sex. This evidence-based approach facilitates a more nuanced understanding of the intricate interplay between age, sex, and elite breaststroke performance in age group swimmers.
Few studies have investigated the age of peak breaststroke swimming performance [25, 26], and there is very limited scientific knowledge regarding age group (master) breaststroke swimmers [27]. For this specific swimming population, studies have investigated swimming performance [28], performance trends in age group breaststroke swimmers [29, 30], pacing in 100 and 200 m age group breaststroke swimmers [31], and the sex difference in performance [32]. The present study investigated the effects of age and sex on swimming performance in elite age group breaststroke swimmers competing in the World Aquatics Master Championships from 1986 to 2024.
Material and methods
Data set and data preparation
Race data were obtained from the official World Aquatics website (www.worldaquatics.com). We manually downloaded the data from the archives section and included a total of 17 World Masters Championships held between 1986 and 2024 in Tokyo (1986), Brisbane (1988), Rio de Janeiro (1990), Indianapolis (1992), Montreal (1994), Sheffield (1996), Casablanca (1998), Munich (2000), Christchurch (2002), Riccione (2004), Stanford (2006), Perth (2008), Gothenburg (2010), Riccione (2012), Montreal (2014), Kazan (2015), Budapest (2017), Gwangju (2019), Kyushu (2023), and Doha (2024). It is important to note that no men’s data were available for 2008. From each swimmer, the year of competition, first name, last name, age, age group, stroke, and distance were recorded. Although all available data were included, the dataset did not provide unique identifiers for swimmers. As such, it was not possible to determine whether some individuals participated in multiple age groups across different years (editions). Age groups were formed by grouping individuals every five years, ranging from 25-29, 30-34, 35-39, 40-44, 45-49, 50-54, 55-59, 60-64, 65-69, 70-74, 75-79, 80-84, 85-89, to 90 years or older (90+). All records were from 50 m pools. No exclusion based on the performance of the swimmers was applied, and all available data were included except for those with missing information. To ensure data integrity, additional analyses were conducted to identify inconsistent times, excessively high records, duplicates, and missing data. Entries with incomplete or incorrect information, such as missing age or event data, were excluded. other inclusion and exclusion factors considered were the completeness and accuracy of the recorded information, ensuring that each entry met the criteria for age groups and event categories.
Statistical analysis
Descriptive data were presented using mean, standard deviation, and maximum and minimum values. Generalised linear models (GLMs) with a gamma probability distribution and a log link function were used to assess the effects of age groups, sex, and their interactions on swimming time. Post hoc Bonferroni tests were applied to investigate significant differences. The Akaike Information Criterion (AIC) was used to choose the distribution of the dependent variable and the model link function based on its lowest value [33]. The Omnibus test was also used to ensure that the model outperformed the null model. The significance level was established at 0.05, and SPSS version 26.0 (IBM Corp., NY, USA) was used for all statistical analyses.
Results
Most of the swimmers (40.7%) competed in the 50 m event (n = 17,575; 7,911 women and 9,664 men; women to men participation ratio = 0.82), followed by the 100 m event (35.2%, n = 15,211; 7,158 women and 8,053 men; women to men participation ratio = 0.89), and the 200 m event (24.0%, n = 10,373; 4,934 women and 5,439 men; women to men participation ratio = 0.91). A participation ratio was calculated between the number of women and men competing in each swimming distance and age group for descriptive purposes, which is presented in Table 1.
Table 1
The participation ratio of women to men in each age group and distance
Table 2 provides a detailed overview of the swimming performance metrics for each sex across different distances. Specifically, it includes the mean time, standard deviation, minimum, and maximum values for each swimming distance, offering a comprehensive comparison between male and female swimmers. This allows for a clear understanding of performance variations and the range of times recorded within each group.
Table 2
Mean times (seconds) for all distances in the breaststroke
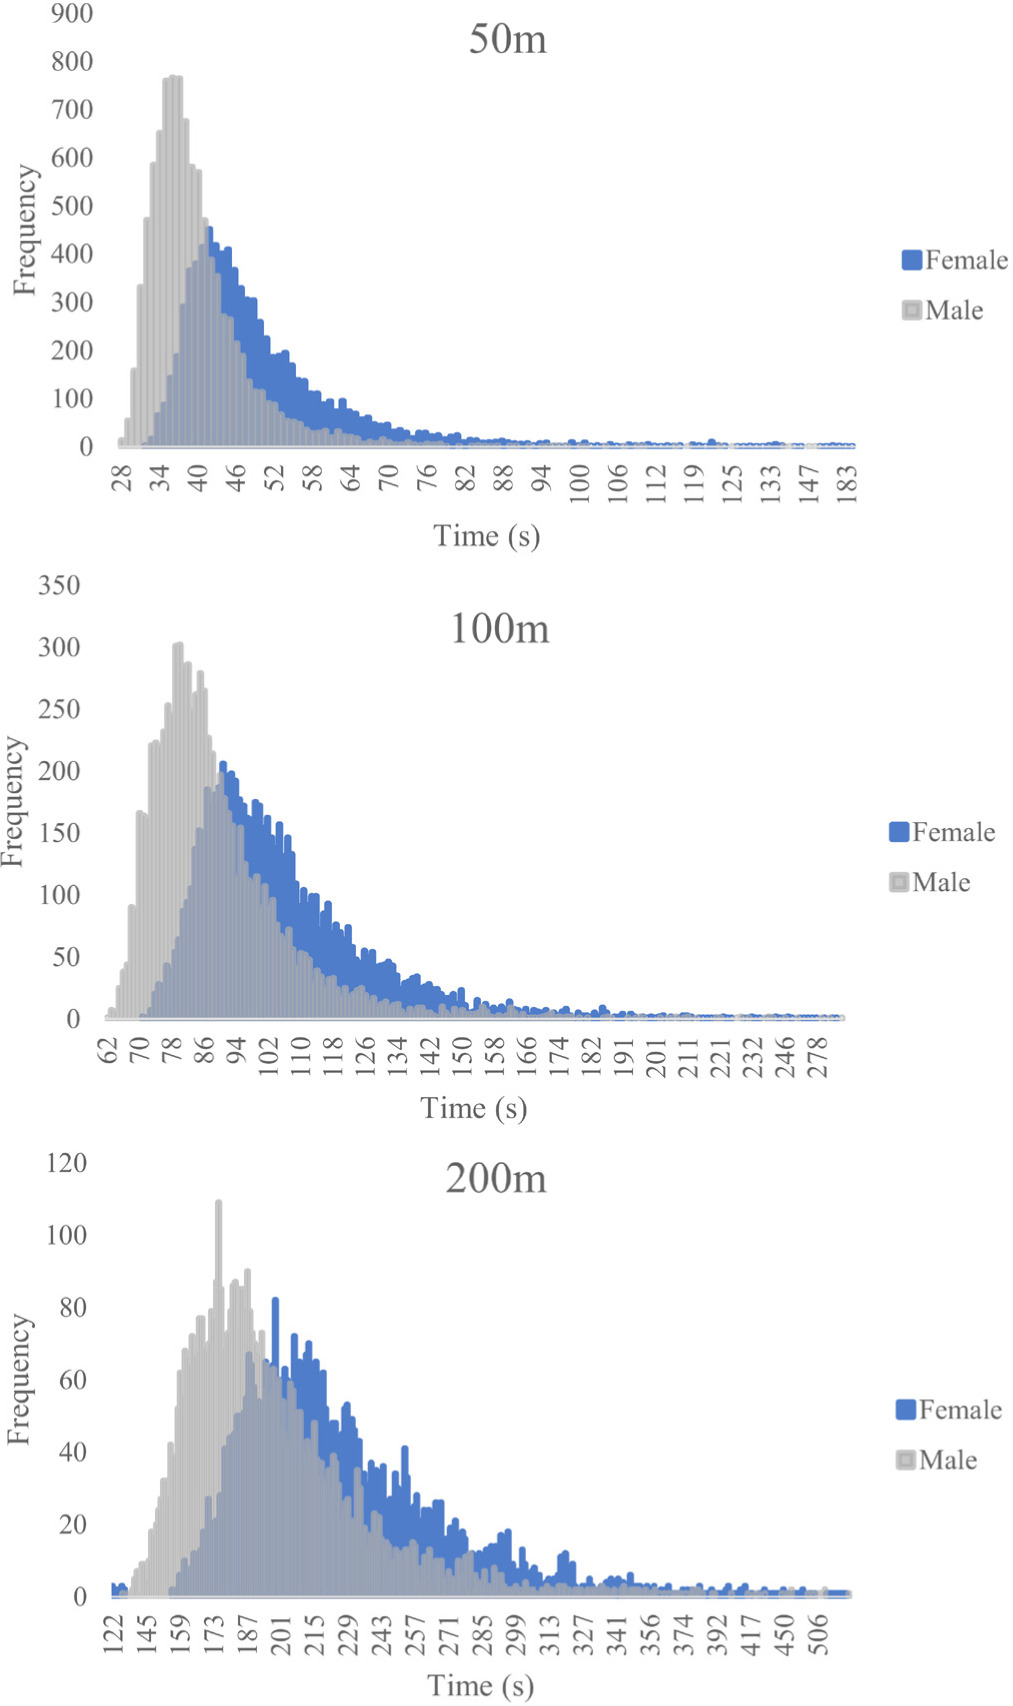
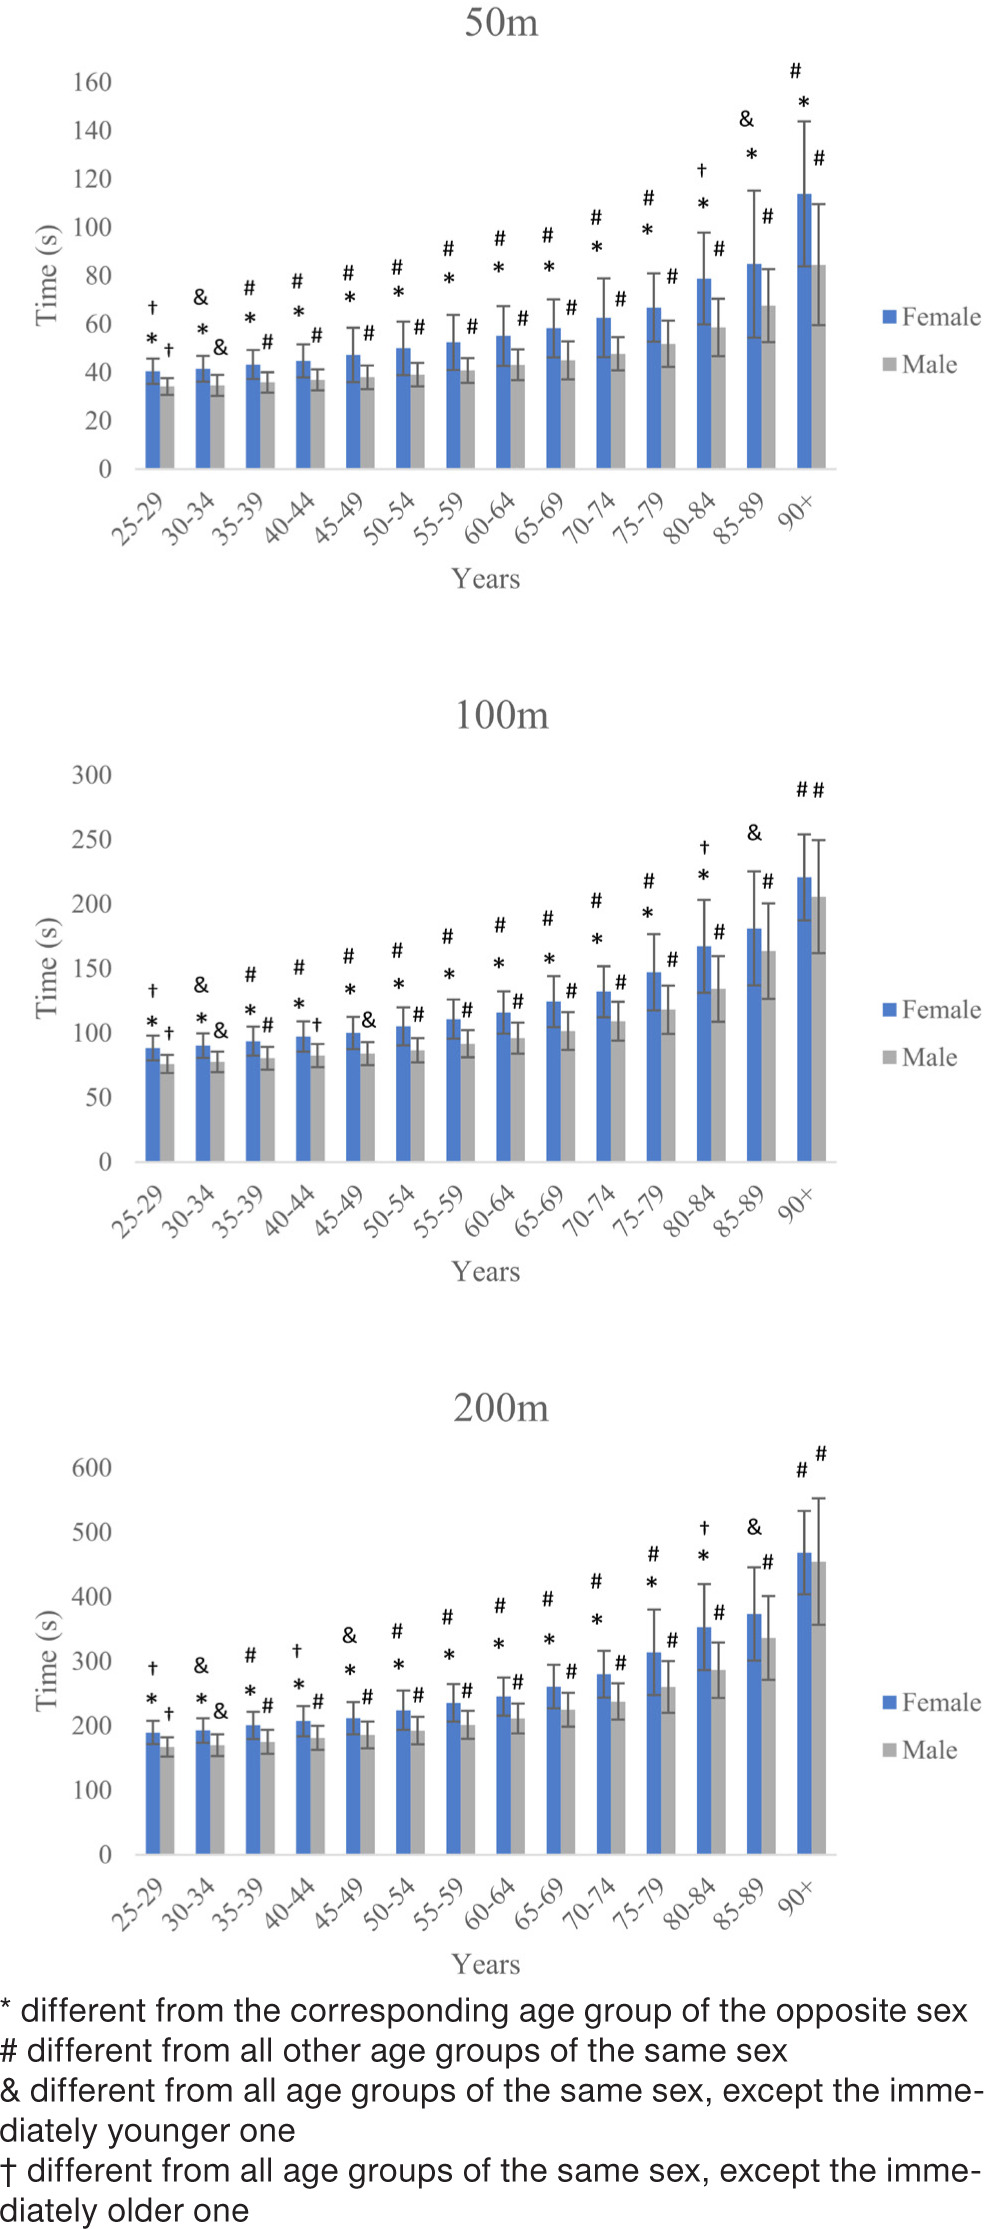
Figure 1 shows histograms of race times for women and men in all swimming distances, indicating the number of athletes who completed the race within specific time intervals. The results of the GLMs indicated that sex, age group and the interaction between sex and age group all had significant effects on the 50, 100, and 200 m races. Specifically, for 50 m races, the effect of sex was significant (£ (1) = 2662.669,p < 0.001), as was the effect of age group (χ2 (13) = 16407.620, p < 0.001), and the interaction between sex and age group (13) = 233.234, p < 0.001). The quality of the model was evaluated using the Omnibus test (p < 0.001) and the AIC (AIC = 115192.550). Similar results were observed for the 100 m races, with a significant effect of sex (χ2 (1) = 1485.325, p < 0.001), age group (χ2 (13) = 21167.191, p < 0.001), and interaction between sex and age group (£ (13) = 117.328, p < 0.001). The model was superior to the null model according to the Omnibus test (p < 0.001), and its quality was evaluated using AIC (AIC = 117354.521). Finally, for the 200 m races, sex (£ (1) = 932.450, p < 0.001), age group (£ (13) = 16321.679, p < 0.001), and the interaction between sex and age group (13) = 63.633, p < 0.001) all had significant effects. The model was again superior to the null model according to the Omnibus test (p < 0.001), and its quality was assessed using AIC (AIC = 94878.614). Differences between age groups of the same sex and between sexes for each swimming distance are presented in Figure 2.
Discussion
The purpose of this study was to explore trends in participation and performance among age group breaststroke swimmers competing in 50, 100, and 200 m races held at the World Aquatics Master Championships between 1986 and 2024, broken down by sex and age groups. The main findings indicated that men were faster than women for all distances and all age groups, except for the age group 90+ in the 100 and 200 m events.
The results confirm a study investigating performance trends in age group breaststroke swimmers competing between 1986 and 2014 at the World Aquatics Master Championships, which reported that men were faster than women from 25 to 89 years but not from 90 to 99 years [30]. Men were also faster than women at 25 m than 200 m for all strokes and water temperatures in the multiple stages of the Winter Swimming World Cup [34]. In this context, our study extends these findings and suggests that researchers interested in master swimmers could focus future studies on older master swimmers.
Men were faster than women, except for the 90+ age group in the 100 and 200 m
Generally, men are faster than women in elite sports [35, 36]. For instance, Senefeld et al. [36] found a sex difference of 12-17% in elite swimmers (World’s top 10), depending on style. The discrepancy is primarily due to differences in anthropometry and physiology, where men have longer limbs, higher muscle mass, and a higher aerobic capacity [37]. In this context, Reis et al. [38] found 15% higher maximal oxygen consumption (V02 max) in men than in women swimmers. However, although the sex difference in elite performance is around 8-12%, women reduced the gap between men, especially in ultra-swimming, to less than 5% [35].
We also found that swimmers in younger age groups were faster than swimmers in older age groups. When master swimmers were compared to younger elite swimmers, it was reported that master swimmers spent significantly less time per week on training for competition, and their training focused on endurance, not strength. Younger swimmers trained for endurance, strength, speed, and power. Furthermore, increasing declines in performance start at ~60 years of age [39].
Age-related changes in physiological and biomechanical factors, such as the decline in functional fitness, affect swimming performance [40, 41]. Interestingly, Brustio et al. [42] observed that most elite junior swimmers in all 50 and 100 m distances did not maintain their performance in adulthood, highlighting the variability of age-related differences. However, we must be aware that the age of maximum breaststroke swimming performance is relatively low (< 25 years in most studies), below the youngest age group in the present study [43, 44].
The effects of ageing become more pronounced, particularly beyond the age of 70 years, largely due to the cumulative nature of losses throughout the ageing process. In the categorisation of age groups, there comes a point where individuals at the upper limit of a category may find it challenging to compete and win medals. This phenomenon can be attributed to the aggregation of age-related declines in physiological functions, including muscle mass, cardiovascular capacity, and bone density [45]. Additionally, the biological age of an individual becomes a crucial factor, reflecting the impact of lifestyle choices on the ageing path [46]. The interplay between genetics, environmental factors, and lifestyle significantly influences how the ageing process unfolds [47]. Recognising the complex relationship between chronological age, biological age, and lifestyle factors is essential to understand why, at a certain point, people may face increased challenges in competitive settings [46]. This acknowledgement underscores the importance of adopting a holistic approach to healthy ageing, encompassing both physical and lifestyle aspects to promote overall well-being in the later stages of life.
Throughout history, the physical and training profile of swimming athletes has changed a lot. Currently, we have stronger and longer-lived athletes compared to the 1980s. In contrast to the 1980s, the present era witnesses athletes achieving extended sporting careers and clinching medals in significant competitions over multiple olympic Games [48, 49]. A notable shift is evident when comparing athletes from different eras, exemplified by the contrast between Matt Biondi and Michael Phelps. Unlike the past, where athletes often peaked in a single olympic event, Michael Phelps exemplifies a trajectory of continuous growth and success throughout multiple olympic cycles, while Bion- di experienced a gradual decline. This transformation is likely linked to evolving training methodologies. In the past, swimming training heavily emphasised volume, whereas contemporary approaches prioritise strength and power training with reduced volume [50, 51]. The shift reflects a more nuanced understanding of optimal training strategies, highlighting the importance of tailored workouts that improve power and efficiency over time. This evolution in training techniques has played a pivotal role in shaping the longevity and success of modern athletes, allowing them to compete at the highest level over long periods.
Age-related performance decline
It is well-known that athletic performance declines with increasing age. It is also known that age group (master) athletes have improved performance in recent decades. However, a recent study showed that the relative progression of the best performance of athletes in the age group has decreased with respect to range and frequency. This suggests that maximum age-related performance has reached physiological limits in age- group athletes [52].
Regarding swimming, data from the U.S. Masters swim programme showed that swimming performance declined in male freestyle swimmers by ~1% per year over the ages of 27.5 to 57.5 years, though there seem to be differences for the different strokes. The decline in swimming performance for breaststroke and backstroke was similar to freestyle but rose to ~1.5% per year in the butterfly. Furthermore, the performance decline was ~20-50% greater in women than men [53].
Involuntary loss of muscle mass, strength, and function, known as sarcopenia [54], is a striking effect of age. Breaststroke is one of the most powerful swimming techniques, along with butterfly stroke. The decline in muscle mass, which occurs at a rate of approximately 3 to 8% per decade after the age of 30 years and even faster after the age of 60 [55], leads to a noticeable systematic regression of results in age groups, particularly among older individuals who exhibit greater dynamism. A study investigating the reduction of swimming speed in relation to age in male master breaststroke swimmers competing in 50, 100, and 200 m events showed that swimming speed decreases reached ~80- 60% of the maximum speed in swimmers aged 60-69, and 80% of the maximum value at 70 to 84. After the age of 85 years, swimming speed decreased up to 30 to 58% of the maximum speed [56].
The abovementioned involuntary loss may be more associated with cachexia than sarcopenia [57]. Sarco- penia, characterised by age-related decline in muscle mass, is influenced by age and lifestyle factors [58], and is not entirely involuntary, as lifestyle choices such as physical activity and nutrition play a crucial role in its onset and progression. on the other hand, cachexia, a condition marked by severe weight loss and muscle wasting, often seen in chronic illnesses such as cancer or heart failure, is more inherently involuntary. Cachexia is driven by systemic inflammation and metabolic changes associated with the underlying disease, leading to rapid and involuntary depletion of muscle mass and total body weight [59]. Recognising the distinction between sarcopenia and cachexia is essential to implementing targeted interventions [57]. Addressing sarcopenia requires lifestyle modifications, including exercise and proper nutrition, while managing cachexia requires a holistic approach targeting the underlying disease and its associated inflammatory processes. By understanding the nuanced differences between these conditions, healthcare professionals can tailor interventions to effectively mitigate involuntary muscle loss, promoting overall well-being in individuals facing these challenges.
When addressing physical preparation and the interaction of age with athletic longevity, it is crucial to consider the effects of the ageing process. Athletes aged 60 years and older should tailor their training regimens, acknowledging the specific challenges that come with ageing. The physiological changes associated with ageing, such as reduced muscle mass, decreased bone density, and a decrease in overall cardiovascular function, require a more nuanced approach to training [60]. It becomes imperative to focus on exercises that not only enhance strength and flexibility but also prioritise joint health and balance [61]. Additionally, incorporating recovery strategies and a comprehensive warmup routine becomes vital to mitigating the risk of inj uries [62]. Striking a balance between intensity and the body’s ability to recover becomes paramount for older athletes seeking to prolong their sporting careers [63]. Therefore, embracing age-appropriate training methodologies ensures not only physical well-being but also contributes to overall longevity and enjoyment of sports [64].
Limitations
Using a secondary data set restricted the generalisation of the findings regarding environmental factors that explain the increased participation and performance of athletes from specific countries. Furthermore, using countries as the unit of analysis hindered our understanding of whether athletes were equally distributed across countries or from specific places (cities, states, communities) within these countries. The methodological approach also limited the generalisation of these findings, as the data only covered the last 40 years and the top 10 countries, and different results could be obtained using alternative strategies. However, the strengths of this study include the analysis of a large dataset and the consideration of a temporal frame.
Conclusions
The study demonstrated a consistent trend for male athletes to exhibit a greater swimming speed compared to their female counterparts at various distances and age categories, with a notable exception observed in the 90+ age group for the 100 and 200 m events. The suggestion for future research to explore alternative strokes and distances underscores the need for a comprehensive understanding of performance dynamics.