Introduction
Breaststroke is a swimming style characterised by specific biomechanical features that set it apart from other strokes. Breaststroke involves a gliding phase after the arm action, resulting in a relative loss of speed in each cycle, along with distinctive underwater recoveries [1]. Elite breaststroke swimmers optimise their propulsion by reducing the glide phase and ensuring continuous timing between arm and leg coordination [2]. The stroke includes a unique arm-pull and kicking pattern, which tends to be more complex but more predictable than the full-body stroke [2]. Vilas-Boas et al. [2] noted that the glide phase can represent a substantial portion of the total swimming time during breaststroke events, accounting for up to 44%. This finding suggests that there may be variability in glide phase duration among different swimmers, including masters. Gonjo and olstad [4] found that elite swimmers exhibited a faster velocity during the glide phase after turns than sub-elite swimmers, indicating increased push-off velocity in the elite group.
Despite the raised interest in understanding performance among elite athletes and using an athlete- centred approach, in which individual attributes are considered the most significant predictors of performance, it is important to advance the field and understand the role of environmental factors on performance. Previous studies addressing the topic highlighted that a country’s economics, history, and demographics increase the rate of success at the international level [5, 6]. However, it is essential to identify the specificities of the sports modalities to provide specific advice.
Identifying the origin of records may allow for case studies into why swimmers have better results [7]. In addition, ascertaining the nationality of swimmers may permit the exploration of how training methods and policies impact performance. Little is known regarding the nationality of breaststroke swimmers in general [8], especially where the best master swimmers originate from, though data exists for cold-water swimmers [8] and long-distance open-water swimmers [10, 11]. However, no scientific data are available on where the best pool swimmers originate. When considering the number of Olympic gold medals in elite pool swimming, the United States of America (USA) is ahead of Australia, Great Britain, Canada, and China (www.worldaquat- ics.com). Furthermore, the USA leads Germany, China, Australia, Russia, and Hungary in the number of international swimming titles (www.worldaquatics.com).
For master swimmers, one study investigated the origin of open-water athletes [12], several assessed different aspects of master swimmers from the USA [13, 14], and recent research evaluated the origin of butterfly swimmers [15] [15]. Since we do not know where the best master breaststroke swimmers originate, this study aimed to examine the origins of top-performing master breaststroke swimmers competing in 50, 100, and 200 m races at the Federation Internationale de Natation (FINA) World Championships from 1986 to 2019. Based on the studies investigating US master swimmers and the number of medals and titles, we hypothesised that the USA would produce the fastest master breaststroke swimmers. Understanding the origins of the fastest master swimmers may give insights into the characteristics of countries that contribute to this dominance.
Material and methods
Data set and data preparation
Race data were obtained from the official World Aquatics website, formerly known as FINA (wwwworld aquatics.com), and included comprehensive data from all World Masters Championships held between 1986 and 2024 (www.worldaquatics.com/masters/archives/ masters-archives). Records retrieved for each swimmer included the year of competition, first name, last name, age, age group, stroke, and distance. Age groups were formed by categorising individuals every five years, starting from 25 and spanning 25-29, 30-34, 35-39, 40-44, 45-49, 50-54, 55-59, 60-64, 65-69, 70-74, 75-79, 80-84, 85-89, and 90 years or older (90+). All records were from 50 m pools. No exclusions were made based on the performance of the swimmers, with all available data included, except for those with missing information. Additional analyses ensured data integrity, such as checking for times inconsistent with historical records, excessively high times, missing data, and duplicates. Only 14 records were excluded due to time errors, specifically times shorter than the respective world records for distance and sex. Other inclusion and exclusion factors were the completeness and accuracy of the recorded information, ensuring each entry met the criteria for age group and event categories. Nationalities were then grouped into six categories, including the top five nationalities with the most appearances in the top 10 fastest times in breaststroke swimming by distance each year, and one group consisting of all other nationalities. It is important to note that the top 10 times for 1988 were excluded due to the unavailability of information in the database. Additionally, there was no men’s data available for 2008.
Statistical analysis
Descriptive data were presented using mean, standard deviation, maximum and minimum values, and/ or confidence intervals. The top 10 race times for each swimming distance and sex were identified for descriptive purposes. Subsequently, we analysed the fastest athletes by averaging the swimming times of those who consistently ranked in the top 10 each year. This allowed us to assess nationality performance consistency over time instead of solely focusing on individual records. The data did not follow a normal distribution or exhibit homogeneity of variance, as determined by Shapiro-Wilk and Levene’s tests, respectively. Therefore, the Kruskal-Wallis H test compared differences between nationalities, and multiple pairwise comparisons adjusted by Bonferroni corrections identified differences. The significance level was set at 0.05, and all statistical analyses employed SPSS version 26.0 (SPSS, Inc., IL, USA).
Results
In the breaststroke, most swimmers (40.7%) competed in the 50 m event (n = 17,575; 7,911 women and 9,664 men; women and men participation ratio = 0.82), followed by the 100 m event (35.2%, n = 15,211; 7,158 women and 8,053 men; women and men participation ratio = 0.89), and the 200 m event (24.0%, n = 10,373; 4,934 women and 5,439 men; women and men participation ratio = 0.91). A ratio between the number of women and men competitors in each swim distance and age group was calculated for descriptive purposes, which are presented in Table 1.
Table 1
The participation ratio of women to men in each age group and distance
Table 2 provides a detailed overview of the swimming performance metrics for each sex across different distances. Specifically, it includes the mean time, standard deviation, minimum, and maximum values for each swimming distance, offering a comprehensive comparison between male and female swimmers. The data provides a clear understanding of performance variations and the range of times recorded within each group.
Table 2
Mean overall time for all breaststroke distances
Figure 1 displays histograms of race times for women and men in all swimming distances, indicating the number of athletes who completed the race within specific time intervals in seconds.
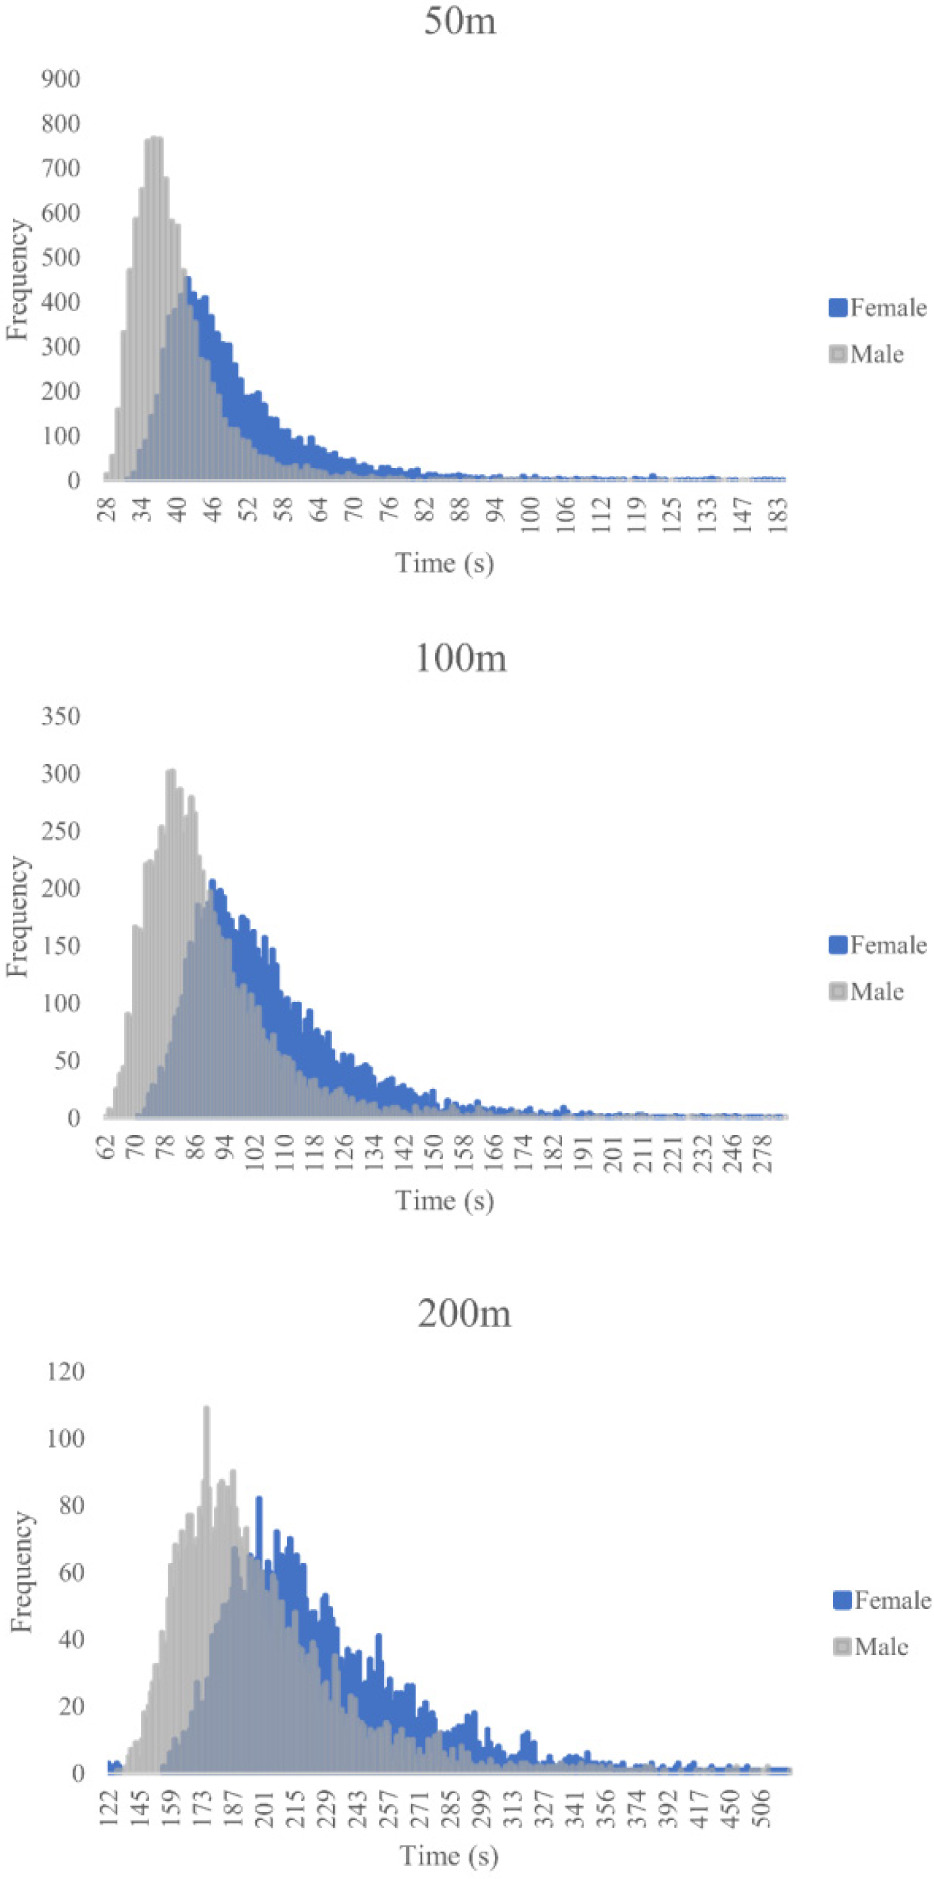
Figure 2 presents the mean time for each swimming distance for men and women and the overall group and the mean times achieved by the top 10 athletes annually. To compare the performance of the countries that participated in each swimming distance event, the five nationalities with the highest number of participants in the top 10 times by year for each sex were selected. The other countries were grouped into a single category called “others”. The mean time of all top 10 swimmers for each sex, year, and country were compared and are displayed in Table 3 (women) and Table 4 (men).
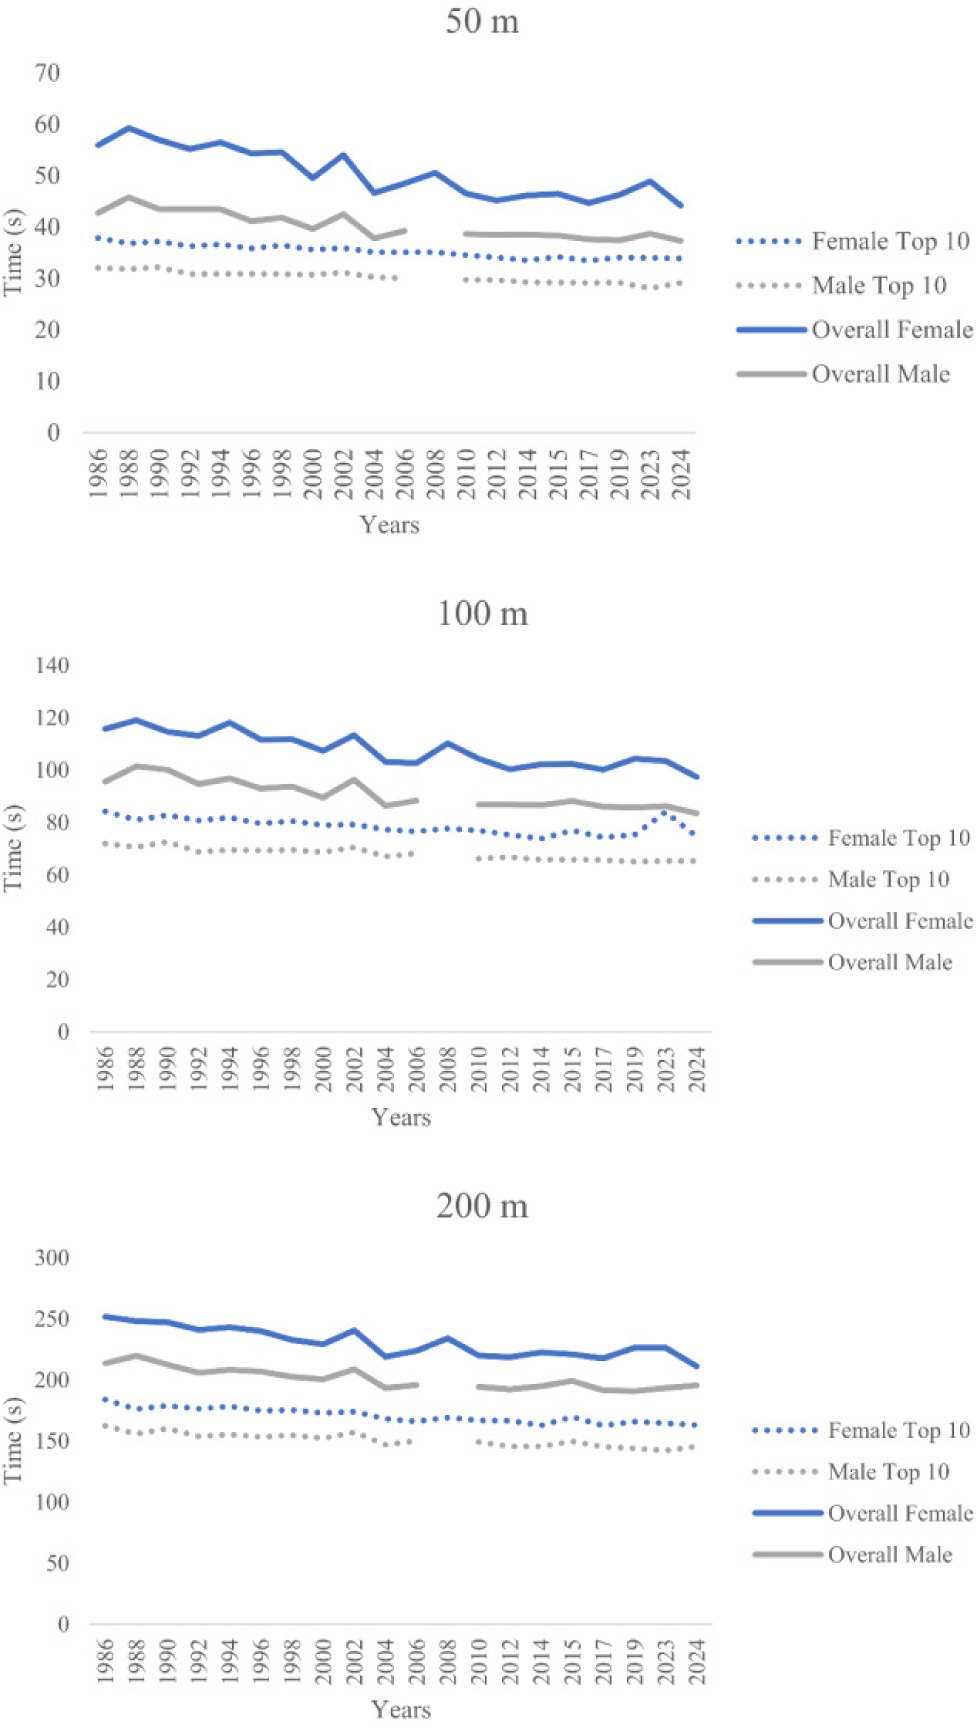
Table 3
Differences between nationalities in mean swimming time for the top 10 female athletes in all breaststroke distances
|
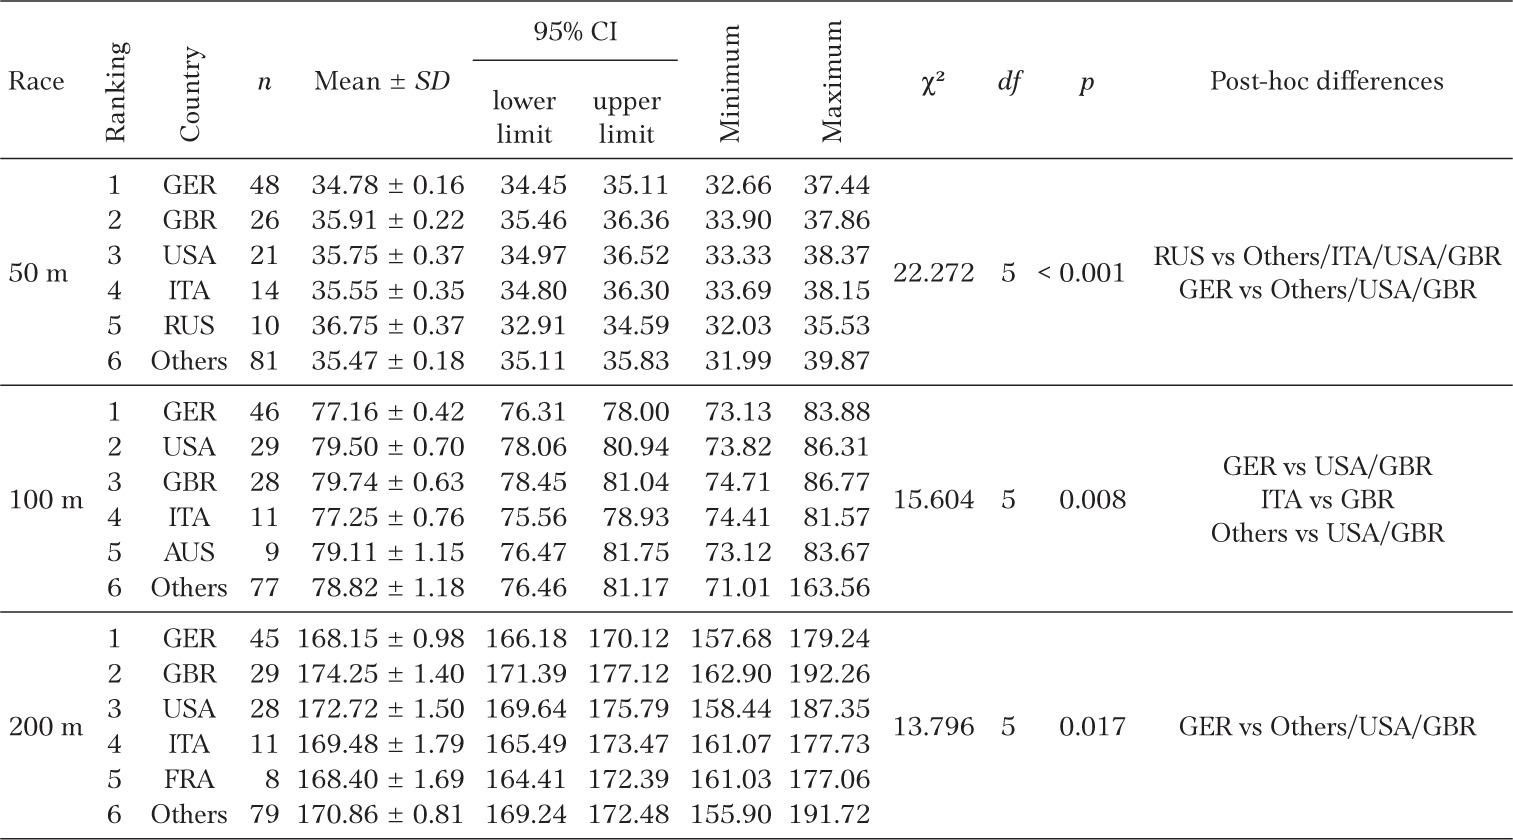
Table 4
Differences between nationalities in mean swimming times for the top 10 male athletes in all breaststroke distances
|
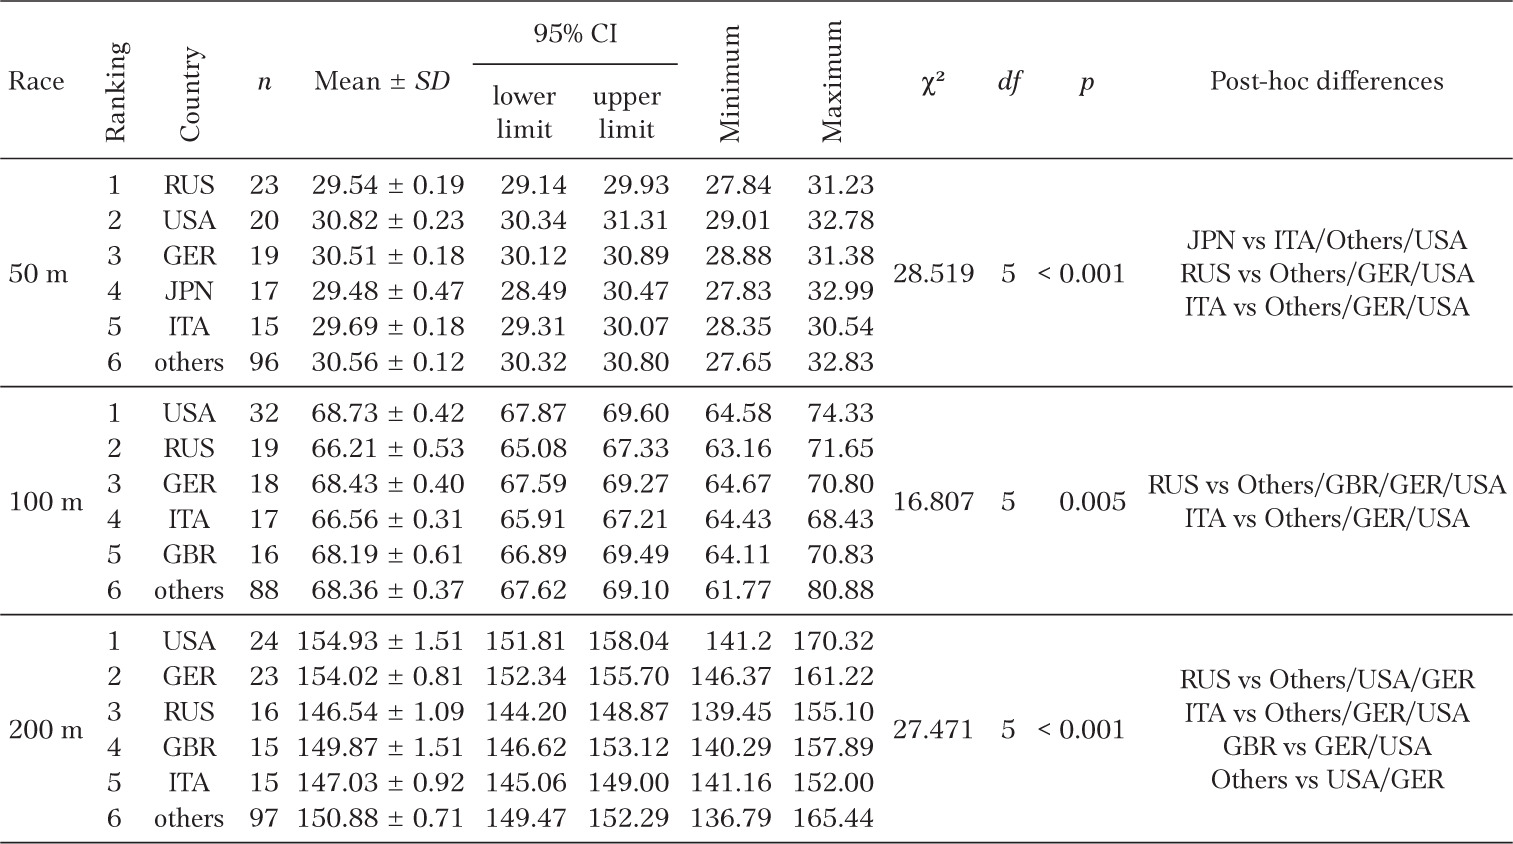
The country with the highest number of women swimmers (Table 3) in the top 10 times by year for all breaststroke distances was Germany. Meanwhile, the USA had the most male swimmers (Table 4) among the top 10 times per year in the 100 m and 200 m breaststroke, and Russia led in the 50 m. In addition to and Italy were among the countries that most frequently reached the top 10 by year in all women’s breaststroke distances (50 m, 100 m, and 200 m) (Table 3). Conversely, the USA, Russia, Germany, and Italy were among the top 10 countries in all men’s breaststroke distances, while Japan was in the 50 m and Great Britain was in the 100 m and 200 m (Table 4).
For the women’s sample, there were differences in performance between countries in the 50 m breaststroke, including Russia vs others, Italy, the USA, and Great Britain, and Germany vs others, the USA, and Great Britain. In the 100 m, there were differences between Germany vs the USA and Great Britain, Italy vs Great Britain, and others vs the USA and Great Britain. In the 200 m breaststroke, Germany outperformed Others, the USA, and Great Britain (Table 3). The men’s sample showed between-country differences at all distances analysed. In the 50 m breaststroke, Japan performed better than Italy, Others, and the USA, Russia outperformed Others, Germany, and the USA, and Italy performed better than Others, Germany, and the USA. In the 100 m breaststroke, Russia performed better than Others, Great Britain, Germany, and the USA, and Italy outperformed Others, Germany, and the USA. In the 200 m breaststroke, Russia performed better than Others, the USA, and Germany; Italy outperformed Others, Germany, and the USA; Great Britain performed better than Germany and the USA, and Others outperformed the USA and Germany (Table 4).
Discussion
The study explored the trends in participation and performance among master breaststroke swimmers competing in 50, 100, and 200 m races at the FINA World Championships between 1986 and 2019, broke down data by nationality, sex, and age group, and hypothesised that the fastest master athletes would originate from the USA. However, the findings showed that male master swimmers from the USA were among the fastest, but not females. Indeed, swimmers from Russia, Germany, Brazil, Great Britain, Australia, France, and Italy also ranked among the top master breaststroke swimmers.
Despite the lack of studies assessing country-specific characteristics that could explain why they produced some of the best swimmers, no unique factor can account for our results. Instead, interactions between economic, social, cultural, and historical factors may be involved. Furthermore, a strong infrastructure for master swimmers, a culture that values swimming, access to financial resources, and programmes of development covering different stages of life (i.e., childhood, adolescence, and adulthood) could also be critical factors [16].
Previous studies have shown a relationship between performance at junior world events and senior world championships [17, 18], similar to the successful master swimmers who were elite swimmers in their earlier careers as elite juniors [19]. However, a study investigating the successful junior-to-senior transition rate in sprint swimming events in elite European performers showed that most elite junior athletes did not maintain the elite level in adulthood [20], with some differences between their country of origin and sex.
A study of potential associations between success at the junior and senior levels in British swimmers showed that female British swimmers participating in junior and senior World Championships were more likely to reach a top position in the senior category after winning in the junior category [21]. These findings suggest that the country is interested in promoting the sport among the population through the provision of infrastructure and opportunities to participate in competition during an athlete’s development.
Considering national characteristics (e.g., economic and social variables), different strategies are expected to achieve similar outcomes (e.g., performance or participation). For example, in Russia, the main focus in swimming is on elite swimmers and the support and promotion of youth athletes (https://russwimming.ru/), while Germany has several clubs and swimming races for master swimmers (www.dsv.de/masterssport). In Great Britain, Swim England Masters offers an extensive list of different races and links to the master’s community, technique tips, and nutrition advice (www. swimming.org/masters/home-of-masters-swim- ming). Increasing access to such information could be considered an important determinant of participation. In the USA, the U.S. Masters Swimming has a wide- ranging calendar of events, assists in finding a swimming club, provides articles and videos to improve swimming performance, and has an extensive library of workouts for a variety of training styles (www.usms. org). Meanwhile, the Federazione Italiana Nuoto has a section dedicated to master swimmers with an extensive list of races (www.federnuoto.it/home/master.html). Brazil focuses on pool swimming, open-water swimming, artistic swimming, water polo, and diving, with master swimming a lower priority (https://www.cbda. org.br/), which might have a considerable impact on their master swimmers.
Additional factors, such as social and economic development, should be considered. Over the last few years, the interest in understanding the influence of a country’s characteristics on athletic development and performance in the international context has increased. Indeed, the “Sports arms race” reinforced the strategies used to promote sports and increase national success on the international stage [22]. Previous studies found that the best sports performers originated from countries that are current global political leaders or have been in their history [23]. In this context, Guillaume et al. [24] showed how elite sports performances are strong indicators of the economic development of a country or region and how countries holding world records and Olympic medals are or have been world political leaders and strong economic forces. Some key pillars, such as financial resources, athletic and post-career support, training facilities, and coach development, seem to be important in explaining international athletic success regarding the nationality of athletes [25].
Another important aspect is the connection between mass sports participation and athlete performance, which was previously named the “pyramid effect”. In this sense, a higher number of athletes competing could not only influence the results but also increase the competitiveness within the country and reflect higher national interest in the sport. However, based on the analysis performed, we cannot make any conclusions about the influence of the number of athletes. As such, future research should investigate how culture, infrastructure, and economic factors directly influence participation and performance among master swimmers. Furthermore, it is important to understand if the differences between sexes are based on variability in training methods or investments in competitive swimming.
A study limitation was the use of a secondary dataset, which restricts the generalisation of the findings regarding environmental factors that explain the higher participation and performance of athletes from specific countries. Furthermore, using countries as the unit of analysis hinders our understanding of whether athletes are equally distributed across countries or from specific places (cities, states, and communities) within these countries. The methodological approach also limits the generalisation of these findings, as the data only covers the last 40 years and the top 10 countries, and different results could be obtained using alternative strategies. Nonetheless, the strengths of this study include the analysis of a large dataset and the consideration of a temporal frame. Based on these findings, stakeholders can deepen their understanding of the environmental factors associated with higher participation and performance and use this knowledge to expand or develop swimming culture in these countries.
Conclusions
Performance differences were observed among various countries across all breaststroke distances for both men and women, with certain countries consistently outperforming others in specific events. Germany had the most women swimmers in the top 10 times yearly, whereas the country with the highest number of men swimmers in the top 10 times per year was the USA. Germany, Great Britain, the USA, and Italy were the most frequent nationalities among the top 10 countries yearly in all women’s breaststroke distances. For men, the USA, Russia, Germany, and Italy were the nationalities that were among the top 10 countries in all men’s breaststroke distances. Germany tended to have better performances for women, while Russia excelled in the men’s events. Future studies could investigate other strokes and distances. Coaches and sports scientists might use the findings to improve the preparation of their athletes, while master swimmers could move to a country with high-performance master breaststroke swimmers to improve their performance.