Introduction
Population ageing is a global phenomenon that leads to longer life expectancy without necessarily more years of autonomous life [1]. According to the WHO, by 2050, approximately 65% of older people will live in low- and middle-income countries, meaning that we face significant challenges in ensuring that health systems are prepared to cope with this demographic change [2]. Muscle weakness, defined as decreased muscle strength, has been linked in older adults to physical disability, falls, functional decline, and mortality. It is also one of the main characteristics of sarcopenia and a risk factor for frailty, which is a challenging medical syndrome with multiple causes characterised by a decrease in strength, endurance, and physiological function under stress [3, 4]. As a consequence, it is often necessary to consider measurement tools and data analysis methods that can accurately quantify and track the health/physical status of older adults.
Walking speed is an important criterion for classifying frailty because of its demonstrated robustness in primary care [5, 6]. Walking speed below 0.8 m/s is one of the possible criteria to classify older adults as frail. Despite its robustness, its measurement can be challenging due to the limited environment and functional decline caused by ageing [7–9]. Recent research has demonstrated that gait parameters beyond simple walking speed, including gait variability measures, provide additional insights into frailty assessment and functional decline in older adults [10]. Therefore, evaluating surrogate markers of frailty is of interest. On the other hand, grip strength is a reliable and easy-to-measure indicator of overall muscle strength; it is largely an explanatory factor for concurrent overall strength, upper extremity function, bone mineral density, fractures, falls, malnutrition, and multimorbidity, among other factors [11]. Grip strength can be used as a simple and inexpensive risk screening tool that is easily implemented in outpatient clinics and overcomes the potential limitations of walking speed-based measures [12, 13].
When clinically classifying older adults as frail, Duchowny et al. [9], using classification and regression trees (CARTs), estimated cutoff points below 16 kgF and 26 kgF for females and males, respectively. Fried et al. [14] stratified the cutoff points of grip strength by sex and quartiles of body mass index (BMI). Thus, when the CART is used, the cutoff points for grip strength considering a healthy BMI are 17 kgF and 29 kgF for females and males, respectively [14]. Neither of the described studies has assessed the uncertainty of the estimated cutoff points, nor considered that the prevalence and incidence rates of frailty vary widely depending on location and population subgroup [15]. In this sense, one alternative may be the Bayesian inference strategy. Such a method may potentially help geriatricians determine a patient’s frailty status and recommend appropriate therapy to address frailty or prevention strategies to mitigate it, particularly when datasets are too small or have limited diversity to establish population-specific classifications of clinical variables. Therefore, in the current study, the main purpose was to implement Bayesian models with credibility intervals to assist in identifying grip strength cut-off points to measure frailty.
Material and methods
Study population
Data from the Peruvian population were collected via convenience sampling among older adults who received treatment for non-life-threatening ailments at the Day Hospital Unit of the Hospital Militar Geriatrico in Lima, Peru, between April 2016 and August 2019. Data from the Mexican population were obtained from a prior study (see below). The ethical aspects were reviewed and approved by the Institutional Research Board of the Pontificia Universidad Católica del Perú (ID #0189-2015). Using the G*Power program (Franz Faul, Universität Kiel, Germany) [16] with input parameters (OR = 2, Pr(Y = 1 | X = 1) H0 = 0.115, R2 = 0.50, X dist. = 0.12 – two-tailed, = 0.05 and = 0.80) considering the worst-case of the results derived from two previous literature studies [7, 13], the calculated required minimum sample size was 2218 subjects.
The Peruvian patients screened had either served in the army or were close relatives of military personnel. Patients with sensory deprivation (visual or auditory), sequelae of cerebrovascular accidents in the upper or lower limbs, chronic degenerative diseases affecting the neurological system, or musculoskeletal disease affecting the musculoskeletal system were excluded from the study. Data from the open-data repository of the Multi-Country Study on Global Aging and Adult Health 2009/10, which is run by the World Health Organization’s Multi-Country Studies unit [17], were also retrieved and used in the present analysis.
For each dataset, we collected and retained data for age, sex, grip strength, walking speed, and walking speed classification. First, we filtered out missing values and then selected data from people older than sixty years old according to the definition of older adults during the time of ageing of the Peruvian population, and those younger than eighty years old to focus on older adults only. The filtered Mexican dataset contained 2062 records, and the filtered Peruvian data-set consisted of 450 entries. The starting filtered and integrated dataset of this representative dataset included 2512 records.
Measurements
Dependent metrics in the present study included measures of grip strength and walking speed. Grip strength was computed as the maximum value of four attempts (two per hand) to measure the force (kgF) exerted when a mechanical dynamometer (CAMRY Mod EH101, General Asde S.A., Valencia, Spain) was held while standing [18–20]. Walking speed was calculated by measuring with a stopwatch the time (in seconds) to walk four metres (i.e., the 4MWT [21, 22]) and dividing the four metres by the time in seconds. Similar procedures for obtaining the same dependent variables were adopted for the Mexican samples and have been described elsewhere in [23]. Patients with walking speeds lower than 0.8 m/s were classified as slow walkers [24, 25]. The other variables included were the age and sex of the included subjects; the latter was used to stratify the participants [26].
Mathematical analysis
Given a binary random variable that takes a value of 1 if an adult has a slow walking speed (less than 0.8 m/s) and takes a value of 0 otherwise, we propose the following logistic regression model for the probability of slow walking speed: where X is the transformed grip strength to the unit interval, 0 < α1 and α 2 < 1 (with 0 < α1 + α 2 < 1) are grip strength cutoff point parameters, and β0, β1 and β2 are regression parameters. The practical advantage of this model lies in the possibility of classifying the frailty condition of an adult given a simple three-level grip strength classification determined by the cutoff points α1 and α1 + α2. The JAGS code used to perform the estimation of the proposed model is as follows:
model {
for (i in 1:n){
y[i] ~ dbern(p[i])
logit(p[i])<-beta[1]+beta[2]*step(x[i]-delta[1])+
beta[3]*step(x[i]-delta[1]-delta[2])
}
for(j in 1:3){
beta[j] ~ dnorm(0,1)
}
delta ~ ddirch(alpha) delta.1<-qnorm(delta[1],m,t)
delta.2<-qnorm(delta[1]+delta[2],m,t)
}
The prior distributions for the regression parameters were assumed to be a weakly informative prior βj N(0, 1), j = 0, 1, and 2, and for , we assumed the symmetric Dirichlet distribution = ( α1, α2,α1 – α 1 – α2) Dirichlet(Ѡ), with Ѡ = 10/3. To estimate the model for both the male and female datasets, we consider four chains, each with a burn-in period of 20,000 iterations and 100,000 iterations for inference. To assess the convergence of the Gibbs sampling algorithm, we used the Gelman-Rubin statistic [27]. For all parameters in both models, the resulting values ranged between 1.00 and 1.02, indicating satisfactory convergence of the algorithm. The deviance information criterion was used to compare models with different numbers of cutoff points.
The results obtained from the proposed model will be compared with those derived from Classification and Regression Tree (CART) models, which are commonly used to identify grip-strength cutoff points associated with slow walking speed, as previously reported elsewhere in [9, 13, 28]. The proposed model was estimated using R, version 3.1.2[29], and JAGS, version 4.3.0 [30]. The CART models were estimated using R, version 3.1.2 [29], in particular with the ‘rpart’ package [31], specifying a maximum tree depth of 3 and a complexity parameter of 0 to ensure the estimation of two cut points. Finally, GraphPad Prism version 10.0.0 for Windows (GraphPad Software, Boston, Massachusetts, USA; www.graphpad.com) was used to obtain the plots for some of the results.
Results
Table 1 shows the results for the 2512 participants from the integrated dataset, with 1137 (45%) males and 1375 (55%) females. Each variable is described as the mean (SD, range). Table 2 shows the demographic characteristics of each of the datasets used.
Table 1
Descriptive values for the integrated dataset from Mexican and Peruvian older adult males and females
Table 2
Demographic characteristics of the study sample by country
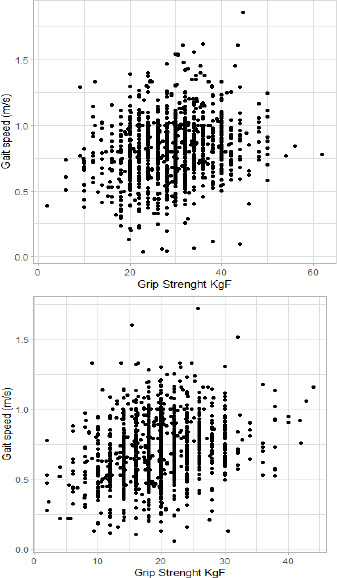
Figure 1 shows the distribution of all samples based on walking speed (m/s) versus grip strength (kgF), i.e. scatterplots of all the data from males and females comparing walking speed, a well-established method to assess frailty, with grip strength, and the proposed alternative or complementary method to assess frailty in older adults with limited mobility.
Assuming that there are two cutoff points to classify our data based on grip strength, we first used CART analyses to obtain values of 18.75 kgF and 30.05 kgF for males, and 11 kgF and 24.05 kgF for females. With a Bayesian approach, we estimated that the estimated cutoff points were 22.20 kgF (95% CI: 16.83–30.33) and 30.84 kgF (95% CI: 30.00–35.96) for males, and 15.18 kgF (95% CI: 14.02–18.66) and 22.88 kgF (95% CI: 18.72–25.41) for females.
We determined low, intermediate, and high grip strength values for males (Figure 2A) and females (Figure 2B) with the 95% CI provided by the Bayesian results, unlike methods such as CART, which provide cutoff points without CIs.
Figure 2
Cutoff point values for (A) males and (B) females obtained from the literature (Alley et al. [13] and Barbosa et al. [32]) and the values obtained with the CART and Bayesian approach using our integrated dataset
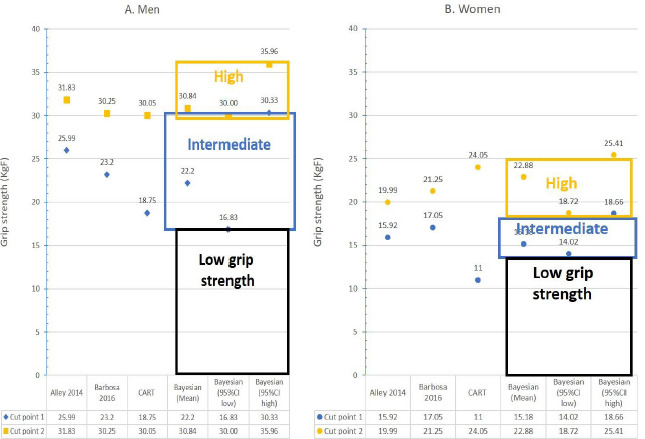
Table 3 summarises the distribution clustering based on grip strength for an integrated Mexican and Peruvian dataset via the Bayesian and CART methodologies. We also ran the same models over the Mexican data alone (Table 4) since it represents approximately 82% of the integrated database. Our results indicate that the relative percentages of older adults with low, intermediate, and high grip strength are similar when the Bayesian model is used for both males and females.
Table 3
Classification of grip strength via two cutoff points for the Bayesian and CART approaches
| Mexico + Peru (Bayesian model) n (%) | Mexico + Peru (CART) n (%) | |||
|---|---|---|---|---|
| males | females | males | females | |
| Low | 234(21) | 303 (22) | 19 (2) | 602(44) |
| Intermedi ate | 452 (40) | 721 (52) | 653 (57) | 552 (40) |
| High | 451 (40) | 351 (26) | 465 (41) | 221 (16) |
Table 4
Classification using two cutoff points to assess robustness, pre-frailty or frailty for the Bayesian and CART approaches for the Mexican population alone
| Mexico (Bayesian model) n (%) | Mexico (Bayesian model) n (%) | |||
|---|---|---|---|---|
| males | females | males | females | |
| Low | 193 (21) | 235 (21) | 16 (2) | 461 (41) |
| Intermediate | 374 (40) | 582 (52) | 551 (59) | 470 (42) |
| High | 368 (40) | 310 (28) | 368 (39) | 196 (17) |
Finally, in Table 5, the difference in deviance information criterion in males between the model with one and the model with two cutoff points is only 2, which indicates no significant difference between the models.
Discussion
The primary objective of the current study was to implement Bayesian models to attempt to find grip strength cut-off points to measure frailty, with credibility intervals to account for the diversity of older adults between 60 and 80 years. To the extent of the authors’ knowledge, this was the first study to explore the applicability of Bayesian models applied to grip strength data to test multiple cut-off points to measure frailty. According to the main results encountered from the mathematical modelling, the approach implemented here suggests that the grip strength data can be described with two cutoff points instead of one point using a Bayesian analysis when analysed by sex within the reported Latin American (i.e., Mexican/Peruvian) population. In the following paragraphs, we will first compare our data with existing literature and then offer interpretations of the findings and highlight the recommendations and associated limits of the present work.
Comparing the results reported in the current study with cutoff points available in the literature [4, 9] for different populations of American older adults, it is possible to state that previous published data fell within the 95% CI of our analysis. Overall, the data (e.g., raw ranges) were also compatible with those of previous large studies [33–35]. Our Bayesian approach provided cutoff point estimates and a value to assess their uncertainty, showing that our estimates are consistent with those reported in the literature. Furthermore, the present study addresses the previously stated limitations of precision by implementing a Bayesian model approach to establish cutoff points for grip strength that include credibility intervals to quantify the variability of the measurements. The Bayesian methodology is widely used in other implementations, and CART is used to analyse data from observational studies [36]. Compared with previously reported studies [9, 13, 17, 25, 36], our results represent a generalisation of the model within the credibility intervals, where the specific cutoff points for each dataset represent the particularities of each population.
Of note, grip strength was proposed as a biomarker since it can be recommended for routine use as a stan-dalone measurement or as part of a suite of measurements to identify older adults at risk for poor health status [11]. Specifically, grip strength is a useful proxy for identifying slow walking speed in older adults [7, 11]. The clinical utility of grip strength extends beyond frailty assessment, as it serves as a comprehensive biomarker reflecting overall health status, with declining grip strength associated with increased mortality risk, cardiovascular disease, and functional disability across diverse populations [11]. Reeve et al. [12] suggested that grip strength may have utility as a simple and inexpensive risk screening tool that is easily implemented in ambulatory clinics, avoiding the need for imaging and overcoming possible limitations of walking-based measures. Indeed, grip strength may be a good surrogate for walking speed, one of the frailty indicators when patients cannot walk or where there is no access to or suitable conditions for performing a four-metre walk. Bayesian inference can be a useful tool to estimate and evaluate the uncertainty of grip strength cutoff points in specific populations with limited data available, as evidenced in this study of an ageing Mexican/Peruvian population.
Another main result of our study was that the relative percentages of older adults with low, intermediate, and high grip strength are similar when using the Bayesian model for both males and females. From a clinical point of view, these results suggest that grip strength might be a good surrogate for walking speed, one of the frailty indicators, when walking speed cannot be assessed, a situation that represents 57% of the cases in geriatric patients [14]. While the CART technique provides cutoff points in our sample that differ from those reported in other populations, the construction of credibility intervals via a Bayesian model help provides a robust estimate of cutoff points that may be used for certain Latin American regions (i.e., Mexico/ Peru), implying that when the lowest grip strengths are lower than 16.83 kgF for males and 14.02 kgF for females, some interventions may be necessary to improve their muscular health. While statistically, there is no difference in DIC in males between one and two cutoff points, two cutoff points make it possible to identify an intermediate group where interventions may have a more significant impact. Notwithstanding, our results suggest that males and females with grip strength values within the intermediate range should be given special attention, protecting them from grouping with individuals with the lowest grip strength. We did not evaluate a model with three cutoff points since two points represent a good degree of clinical relevance and applicability by assisting in classifying older adults into three zones of robustness, pre-frailty, and frailty. Meanwhile, the benefits of additional stratification should still be further investigated and are beyond the scope of this work.
When pre-frail older people are properly assessed and treated, and the underlying causes of deterioration are addressed, there is great potential to reduce the likelihood of institutionalisation and mortality, make them less dependent, and prevent their development into frailty while reducing the economic costs of institutionalisation and improving their quality of life [8, 26]. Significant associations between sociodemo-graphic factors such as older age, ethnicity, access to private insurance, and frailty were reported by Gomes et al. [15]. Similarly, low income was positively and significantly associated with frailty, as supported by the study of Harttgen et al., who reported that low income makes people more susceptible to frailty [37]. Finally, the two low- and middle-income countries considered in the present study have been notably experiencing population ageing; thus, it is necessary to guarantee an adequate social and health system to face the significant challenges that this implies [38]. Frailty may vary depending on the individuals’ background [39], and thus developing specific frailty prevention and reduction strategies for each population is recommended [40, 41]. Different grip strength cutoff points for older males and females to estimate the prevalence of sarcopenia were previously analysed in a systematic review by Fernandes et al. [36], who reported that the variation in the cutoff points was evident when sex was compared across regions worldwide. Finally, the results obtained in the current study can assist future development of strategies to measure frailty according to the needs of the specific populations considered here. While combining data from various countries is not uncommon – see for example [13, 15, 32] – it is important to note that, although the measurements of the main dependent variables appear to have been homogeneous between the two distinct datasets (see Table 2; trivial-to-small effect sizes for the respective comparisons of grip strength and walking speed between countries), due to the different sample sizes, the results of the current study may apply to a greater extent to the Mexican than to the Peruvian population.
The present study contains a range of limitations that should be acknowledged. First, walking speed can be influenced by a range of confounding factors (e.g., individual and environmental variables) [24, 40, 42] that may not be directly related to physical frailty. While the test-retest reliability of grip strength measurements in older adults using the best measurement of two attempts has been previously reported as acceptable [43], possible effects in the outcomes derived from aspects not controlled in our methods, such as time of data collection, should also not be discarded [44]. Also, no directionality was observed in our results, so we cannot determine whether weaker older adults walk slower or slow walkers are weaker. While a correlation between grip strength and walking speed is expected, we do not address the effect of decreased walking speed on grip strength or vice versa. An important fraction of the Multi-Country Study on Global Aging and Adult Health 2009/10 presents missing values, and the sample from Peru was collected via convenience sampling. In addition, there was an imbalance in the number of subjects when integrating data between countries. Both situations can impact the overall generalisability of the results as well as across Latin American populations. A further interesting development suggested for future investigations is to incorporate random intercepts or slopes into the model to account for possible population heterogeneity between Latin American countries. Nevertheless, the previously reported cutoff points fall within the credibility interval estimated by our present study.
Conclusions
Bayesian inference can be a useful tool to estimate and evaluate the uncertainty of grip strength cutoff points to measure frailty in specific populations with limited data available, as evidenced in this study of an ageing sample. Our results represent a generalisation of the model within the credibility intervals, where the specific cutoff points for each dataset represent the particularities of each population. In short, the cutoff points encountered in the present study through Bayesian inference can be useful to assist in qualifying the outcomes of older subjects from certain Latin American (i.e., Mexico and Peru) regions following common clinical evaluations. Of note, the results of the current study likely apply to a greater extent to the former country than to the latter.