Introduction
The implementation and quality optimisation of a training program depend on the application of several training principles, including an individualised approach (in team sports), the progression of training volume and intensity, and the incorporation of recovery phases through the use of various strategies [1]. To adequately achieve their planned goals, the coaching staff must continuously measure and monitor internal training intensity (ITI) which reflects an athlete’s physiological and perceptual response to a given training stimulus [2, 3]. ITI is usually assessed with the use of internal intensity measures such as subjective scales, heart rate levels, and biochemical markers [4, 5]. It provides valuable insights to coaches about how an athlete’s body reacts and adapts to external training stimuli. ITI allows coaches to make adjustments to the training program by considering the current state of their athletes [4]. This helps prevent overtraining caused by non-functional training intensities, thereby reducing the risk of injuries [6,7], making it one of the most important tools for injury prevention [3]. Although there are various methods to monitor ITI, such as hormonal and lactate level analysers, and portable maximum oxygen consumption (Vo2max) analysers, they can be costly and inaccessible to a large number of clubs. Therefore, the assessment of ITI using subjective measures, such as scales and questionnaires, is of utmost importance because of their accessibility and low cost, in addition to their effectiveness in simply and quickly measuring what they are intended to measure [8]. However, in addition to subjective measures of ITI (such as rPE [9]), objective physiological markers like heart rate variability (HrV) and sleep duration are crucial in understanding the impact of training intensity on athletes’ recovery and training outcomes. Subjective measures alone are not sufficient, as psychological factors, motivation, and external stressors can influence them. Therefore, incorporating objective physiological data provides a more accurate and comprehensive assessment of an athlete’s internal training intensity. A decline in HRV values and poor sleep duration can signal to coaches that an athlete is fatigued and has not recovered adequately for their next training session [10]. Given that sleep duration reflects an athlete’s ability to recover, it stands as a key factor in influencing not just athletes’ recovery but also athlete’s ability to adapt to stress and maintain overall well-being levels [11, 12]. Therefore, ensuring sufficient sleep duration is essential for their overall performance. With the availability of various modern monitors (such as smartwatches and fitness bracelets), integrating this parameter into the monitoring toolkit provides coaching staff with a simple way to measure and track athletes’ performance. Better sleep patterns and sufficient duration positively affect recovery and overall athlete performance, highlighting the importance of adequate monitoring [13,14]. Moreover, in addition to the importance of sleep duration and rest monitoring, cardiac autonomic activity, as derived from the measure of HRV, is likely to play an important role in understanding functional adaptations to training stimuli and individual responses [15].
Research into cardiac responses to training reported that disrupted levels of HRV can contribute to an increase in the occurrence of injuries and poor adaptation to training intensities [16]. In contrast, optimal and better levels of HRV allow the coaching staff to manage training intensities by increasing the intensity and volume of work, enabling athletes to optimise their performance and prevent stagnation [17,18]. Furthermore, aiming to identify both fatigue and adequate recovery during training, previous research highlighted that the countermovement jump (CMJ) test is a simple, easy, and non-invasive tool to assess levels of neuro-muscular fatigue [19]. This makes CMJ of particular interest to coaches during the preseason, as that is a period characterised by increases in training volume and intensity, as athletes experience a rapid increase in their workloads [19]. Regularly monitoring CMJ values in athletes during that period provides insight into their neuromuscular readiness (accumulated fatigue levels).
The coaching staff set different goals for themselves and athletes depending on the phase of the season [20]. In fact, while the focus is on achieving optimal preparation levels during the preseason period, which reduces the risk of injury during the season, maintaining the fitness level achieved is the main objective of the in-season period [21,22]. Achieving these goals can give the athletes the ability to recover, depending on the phase. Previous research has shown significant variations in intensity depending on whether it is the preseason period or during the soccer season [23]. Although metrics such as HRV, sleep duration, and neuro-muscular fatigue have been previously investigated, they were mostly examined as isolated factors, leaving a gap in the research that integrates them into a comprehensive monitoring strategy specifically for soccer players during preseason. Considering the importance of conducting an adequate preseason period to prepare players for the demands of the new season, integrating these metrics (i.e., HRV, sleep, neuromuscular fatigue) into the daily monitoring routines of the preseason phase is of utmost importance as it can allow athletes to achieve a harmonious balance between effort and recovery, maximising their performance [19] Therefore, the current study aimed to investigate the relationships between internal training intensity (ITI) and key recovery and performance metrics, including HRV, sleep duration, and CMJ performance, over a five-week pre-season in professional soccer players. This study tried to provide a more comprehensive approach to soccer player monitoring, offering new insights to enhance existing data, and supporting evidence-based decision-making for coaches.
Material and methods
Study design
This longitudinal study is part of a broader research effort exploring physiological adaptations and performance in professional soccer players during preseason. The initial study [19] focused on examining the relationships between ITI and well-being, alongside the progression of these variables over a five-week period in a sample of 22 soccer players. While that work highlighted significant changes in ITI and well-being during preseason training, no other comparisons were observed, such as cardiac markers and sleep duration. The current study builds on these findings by incorporating additional physiological and recovery metrics such as HRV and sleep duration, within a subsample of the original cohort, providing a more comprehensive understanding of recovery and adaptation processes during the preseason. This subsample was selected due to the inclusion of advanced physiological monitoring tools, specifically HRV and sleep-tracking sensors. These tools require consistent and accurate daily measurements, which were logistically feasible only for a smaller group of players. Therefore, the current study focuses on how the HRV metric, sleep duration, and CMJ interact with ITI, offering novel perspectives on the role of autonomic stability and recovery in training adaptations. This approach aligns with best-practice guidelines [24] for leveraging rich datasets to address distinct research questions and theoretical frameworks. By expanding on the findings of the earlier study, the current investigation offers complementary insights into preseason training strategies, emphasising the importance of integrating HRV and sleep monitoring to enhance player performance and recovery. The study began after the return of all players from the summer break and lasted from the beginning of July until the end of the preseason period (first week of August). Throughout the five weeks, the players were in controlled conditions within the football club. The coaching staff were responsible for planning and programming the entire preseason training plan. The training volumes and the number of training units per week are shown in Table 1.
Participants
This study involved 10 professional soccer players, all members of the same team in the Second Croatian Football League. Player characteristics are shown in Table 2. The sample size was not determined a priori, as it was based on convenience sampling. A post hoc power analysis conducted using the G*Power software (ver. 3.1.9.4 Düsseldorf, Germany; [25]) revealed power values ranging from 0.89 to 1.00. To be eligible, soccer players had to fulfil the following inclusion criteria: (i) participation in at least 85% of the training sessions, and (ii) medical clearance given by a sports medicine doctor (no pain or injury) at the beginning of the pre-season phase. Players were excluded if they met any of the following criteria: (i) sustained a musculoskeletal injury prior to the preseason that could impair training participation and performance outcomes, or (ii) were undergoing pharmacological treatments (e.g., beta-blockers, anti-inflammatory drugs) that influence autonomic function or fatigue perception. Players provided their signed consent after being fully informed of the experimental procedures.
Procedures
The coaching staff planned and programmed the preseason period without the research team’s involvement. All training sessions were performed in a controlled environment and were directly supervised by the coaching staff. The training program consisted of (a) technical-tactical sessions (TE-TA), (b) strength and conditioning sessions (S&C), and (c) friendly matches. TE-TA sessions began with a 30-minute general warm-up conducted by the strength and conditioning coach. The warm-up included 10 to 15 min of individual stretching, 5 to 10 min of jogging or passing drills with light jogging, and 10 to 15 min of speed, agility, and quickness (SAQ [26]) and specific football movement protocols. Following the warm-up, TE-TA sessions were taken over by the main coach and assistant coach, focusing on specific technical-tactical aspects of football. Training intensity and volume were systematically adjusted based on specific task and rule modifications to ensure progressive intensity management across sessions. In the technical-tactical (TE-TA) sessions, the intensity was modified through small-sided game (SSG) variations (e.g., altering player numbers, implementing one-touch passing rules, and incorporating ‘joker’ players to facilitate transitions), as well as integrating high-intensity interval training (HIIT [27]) running protocols to target metabolic demands. Task duration and recovery periods were also manipulated to standardise the training intensity while maintaining session objectives. Strength and conditioning (S&C) sessions focused on moderate-intensity strength and power training, primarily targeting lower-body power, agility, and endurance, with an emphasis on injury prevention and recovery support between training sessions. Friendly matches followed standard competitive rules and durations, serving as high-intensity exposure within the training plan. Each training day involved assessing session ratings of perceived exertion (sRPE). CMJ performance was measured weekly before the first training session, while sleep duration and HRV were tracked daily until the study’s conclusion. Participants underwent at least two familiarisation sessions before the study started to ensure they were accustomed to the training routines, warm-up protocols, and performance assessments outlined in the preseason program.
Internal training intensity
sRPE was evaluated using the widely used method: the Borg CR10 Scale [28]. Players were asked to answer the researcher’s question, ‘How difficult was this training session for you?’ They rated their responses on a scale from 1 to 10, where 1 = very, very light, and 10 = extremely difficult. The answers were collected 30 min after the end of the training session during team meetings. The players provided their answers privately and always to the same researcher to avoid potential external influence. ITI was calculated using the formula: Internal Training Intensity = sRPE (a.u.) × session duration (min). If there were multiple training sessions on the same day, the sum of both sessions represented the ITI for that day. For further analyses, the weekly mean internal intensity (ITImean) was calculated for each week.
Countermovement jump
The CMJ test used a reliable and validated Opto-Jump photoelectric platform (Microgate srl, Bonzo, Italy) to assess neuromuscular performance. The test was conducted 30 min before the week’s first training session, following a standard warm-up period. Players had to perform three jumps, all of them barefoot [19]. They were instructed to place the palms of their hands on their hips and to perform a downward movement (into a squat position), followed by full knee extension and a jump. After each jump, players had 15 s of rest, and the best value out of three jumps was used in the research. The same experienced researcher performed all the measurements. The intraclass correlation coefficient (ICC) values for the CMJ test ranged from 0.93 to 0.97, indicating excellent reliability.
HRV data
Players were instructed to record their resting HRV (R-R intervals) for 2 min immediately upon waking, following these instructions: (1) remain motionless while recording; (2) perform the measurement prior to consuming any food or fluids; and (3) empty the urinary bladder beforehand; (4) breathe spontaneously and maintain a neutral state of mind during data collection [29]. The R-R interval recordings were obtained using a Polar H10 sensor chest strap (Polar Electro Oy, Kempele, Finland; sampling rate: 1000 Hz) and were downloaded using the Elite HRV App (version 5.3.2), which demonstrates near-perfect agreement with ECG (r = 0.99) for HRV measurements across supine, seated, and standing positions, indicating high validity [30]. Subsequently, the R-R interval recordings were analysed using the HRV analysis software Kubios HRV Premium (version 3.5.0., Biosignal Analysis and Medical Imaging Group, Kuopio, Finland). Ectopic beats were corrected using the automatic artifact correction algorithm, replacing them with interpolated adjacent interbeat intervals (IBI). The software’s automatic noise detection feature was utilised to identify and mark distorted IBIs, such as those caused by movement [31]. The vagally-mediated HRV parameter analysed was the logarithm of the root-mean-square of successive differences (lnRMSSD), a reliable marker of parasym-pathetic (vagal) activity for monitoring in sports field settings [32,33]. For analysis, the weekly mean of lnRMSSD (lnRMSSDmean, expressed in milliseconds [ms]) and its coefficient of variation (lnRMSSDCV, expressed as a percentage) were calculated individually. All HRV measurements were consistently recorded between 07:00 and 08:00 AM.
Sleep duration and resting heart rate
A Mi Band 4 actigraphy device (Foxconn, Xiaomi, China) was used to determine the player’s sleep duration and RHR during the preseason period. This device has been previously validated [34,35] and is widely used to assess the sleep duration of various populations [36,37]. A third-party script [38] was utilised to retrieve data through an Android backup since Mi Band lacks a built-in function for data extraction. The accuracy of wrist-worn devices may vary across individuals due to factors such as wrist movement, device positioning, and individual sleep patterns, potentially introducing some measurement error. To minimise inconsistencies, participants were familiarised with the device before data collection, provided with standardised wear and use instructions, and data analysis focused on trends over time rather than isolated values. Once the research started, players would wear the Xiaomi band on their left wrist when going to sleep and keep it on until they wake up. Players were not asked to change their sleep schedule for this study but to act as they usually do during the observed period. For further analysis, the weekly mean of the total time spent sleeping (Sleepmean, expressed in minutes) and weekly mean of the resting heart rate (RHRmean, expressed in beats per minute) were calculated.
Statistical analysis
Descriptive statistics are reported as mean, standard deviation (SD), and coefficients of variation (CV%). The normality of the data was assessed using the Shapiro–Wilk test, while sphericity was tested via Mauchly’s test. When the assumption of sphericity was violated, Greenhouse–Geisser corrections were applied. A one-way repeated measures ANOVA was conducted to compare variables across the five weeks of the pre-season phase. A bonferroni post-hoc test was used to identify the magnitude of differences between means with Cohen’s d as a measure of effect size (ES) and interpreted using the following qualitative thresholds: < 0.2, trivial; 0.2–0.6, small; 0.6–1.2, moderate; 1.2–2.0, large; 2.0–4.0, very large; and > 4.0, extremely large [39]. The repeated-measures correlation analysis using the rmcorrShiny app was performed to determine the relationship between variables [40,41]. This correlation analysis is appropriate for paired, repeated-measures data, as it accounts for the non-independence of data points from the same participant and identifies common intra-individual changes. The magnitude of the repeated-measures correlation coefficient (rrm) with 95% confidence intervals (95%CI) estimated using parametric bootstrapping (1,000 samples) was interpreted conservatively using the following ranges: 0.1, trivial; 0.1–0.3, small; 0.3–0.5, moderate; 0.5–0.7, large; 0.7–0.9, very large; and 0.9–1.0, almost perfect [39]. A p-value of < 0.05 was considered statistically significant. All data were analysed using the SPSS 29.0 statistical software (SPSS, Chicago, IL, USA) and GraphPad Prism 9 (GraphPad Software, Inc., San Diego, CA, USA).
Results
Figure 1 displays changes in ITImean between weeks over the preseason phase. There was a significant time effect (F(4,36) = 29.83, p < 0.001) with the end of the preseason phase (week 5) being lower than in week 1 (ES = 3.91 [very large]), 2 (ES = 3.69 [very large]), 3 (ES = 3.68 [very large]), and 4 (ES = 1.53 [large]). Moreover, week 4 was lower than week 1 (ES = 2.28 [very large]) and 2 (ES = 2.1 [very large]).
Figures 2 and 3 show changes in lnRMSSDmean and lnRMSSDCV during the weeks in the observed period. Although there was a 39.9% decrease in lnRMSSDCV from week 1 to week 5 (Δ = –2.11, ES = 1.32 [large]), no significant time effect was determined (F(4,36) = 2.12, p = 0.1). Also, there were no significant changes in lnRMSSDmean between the weeks of the observed period (F(4,36) = 1.37, p = 0.27).
Figure 1
Internal training intensity values over the 5 weeks during the preseason in professional soccer players (n = 10)
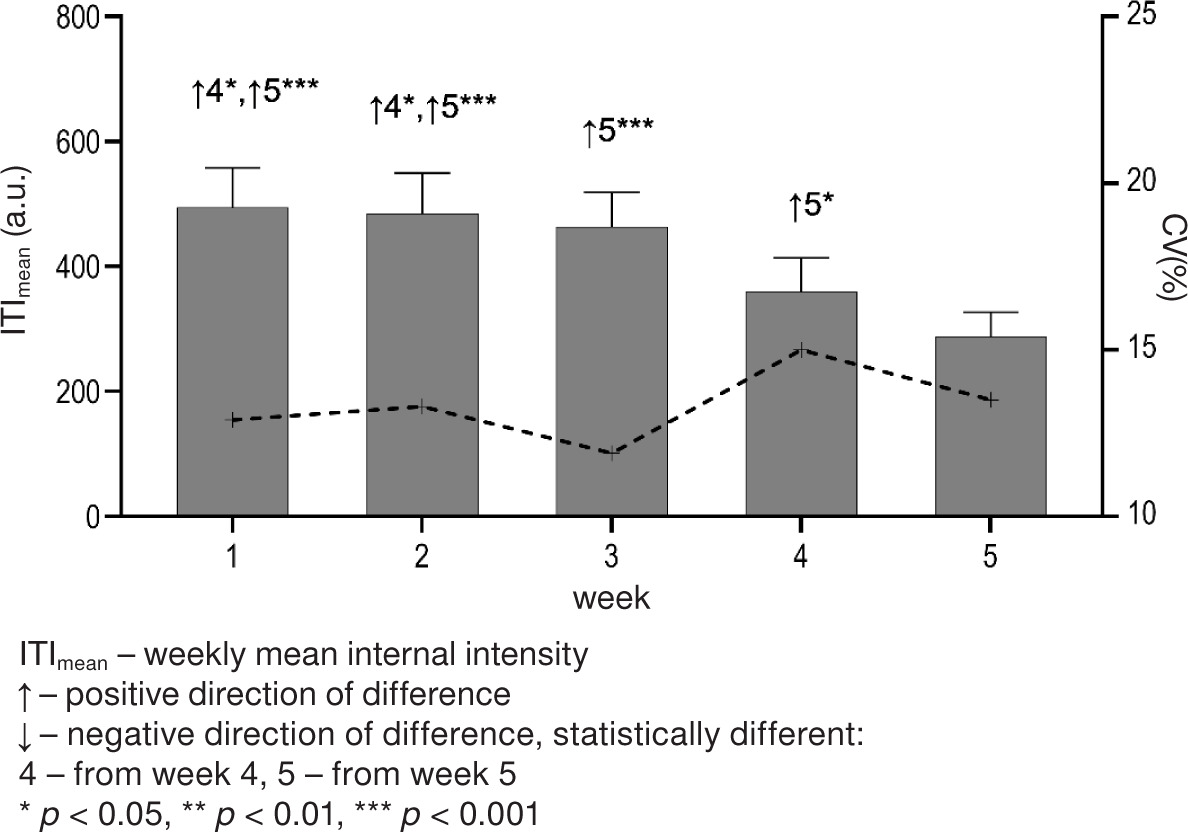
Table 3 demonstrates changes between weeks in RHRmean, Sleepmean and CMJ. A significant time effect was determined for CMJ (F(4,36) = 10.42, p < 0.001), where performances were lower in week 2 than in week 1 (ES = 0.63 [moderate], week 4 (ES = 0.8 [moderate], and week 5 (ES = 0.82 [moderate]. There were no significant changes in RHRmean (F(4,36) = 1.51, p = 0.25) and Sleepmean (F(4,36) = 0.95, p = 0.45).
Figure 2
Individual and group heart rate variability values over the 5 weeks during the preseason in professional soccer players (n = 10)
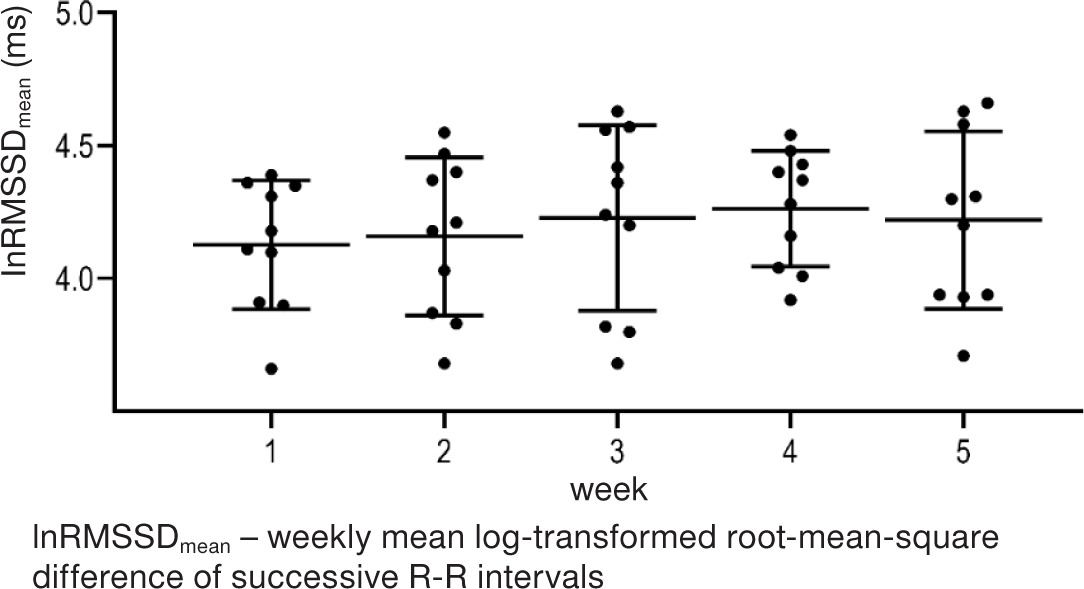
Figure 3
Group heart rate variability values expressed as percentages over the 5 weeks during the preseason in professional soccer players (n = 10)
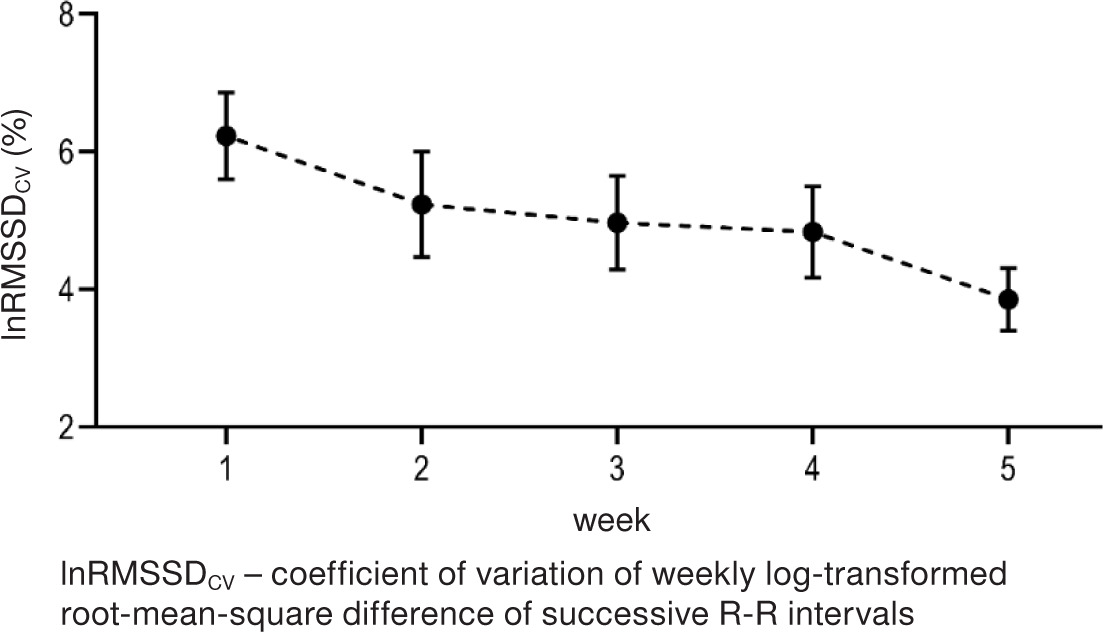
Figure 4
Repeated-measures correlation plots between lnRMSSDmean and lnRMSSDCV Each shade of grey represents a unique participant, with points indicating their performance on both measures at specific time points, and the corresponding lines illustrate the rrm fit for each participant
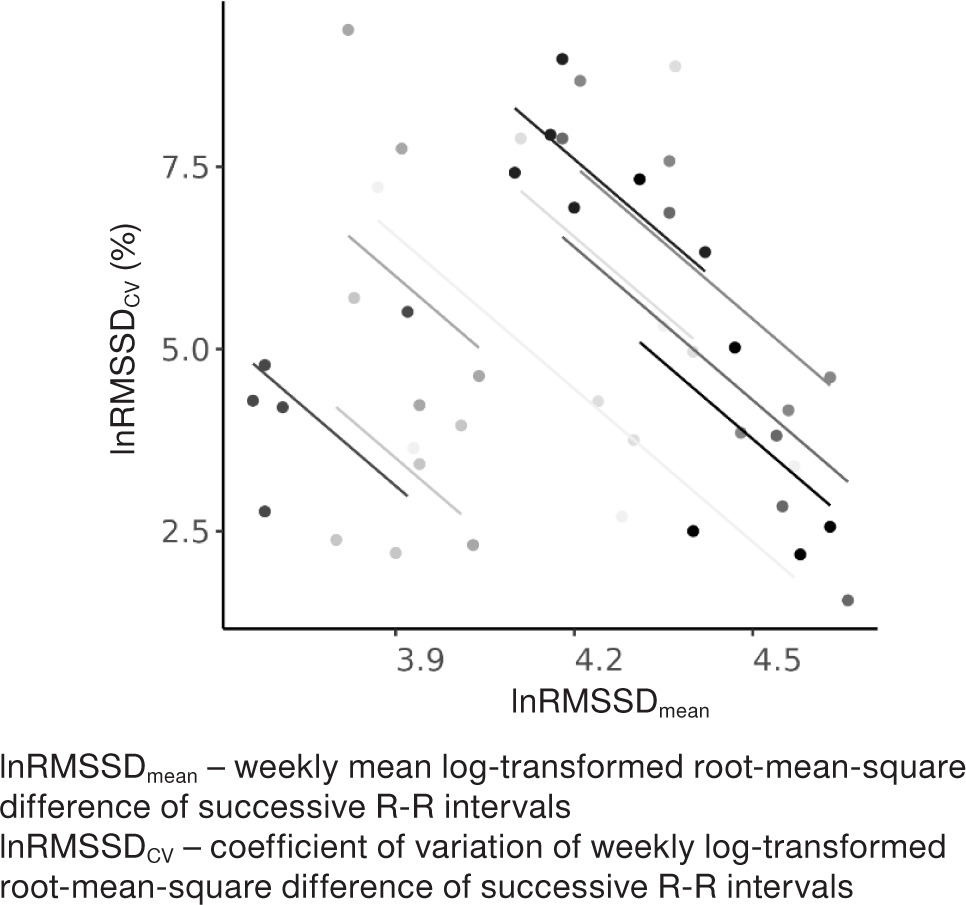
Table 3
Variables of resting heart rate, sleep duration, and CMJ performance over the 5 weeks during the preseason in professional soccer players (n = 10)
[i] All data is presented as mean (SD).
RHRmean – weekly mean resting heart rate
Sleepmean – weekly mean total time spent sleeping
CMJ – countermovement jump
↑ – positive direction of difference
↓ – negative direction of difference, statistically different: 2 – from week 2, 4 – from week 4
* p < 0.05, ** p < 0.01
Table 4
Repeated measures correlation between internal training intensity and cardiac autonomic markers, sleep duration, and neuromuscular performance (n = 10)
| Variable | ITImean | ||
| rrm | df | 95%CI | |
| CMJ | –0.43** | 39 | –0.65 to –0.14 |
| RHRmean | 0.14 | 39 | –0.18 to 0.42 |
| lnRMSSDmean | –0.27 | 39 | –0.54 to 0.04 |
| lnRMSSDCV | 0.35* | 39 | –0.05 to –0.6 |
| Sleepmean | –0.32* | 39 | –0.57 to –0.01 |
[i] ITImean – weekly mean internal intensity
CMJ – countermovement jump
RHRmean – weekly mean resting heart rate
lnRMSSDmean – weekly mean log-transformed root-mean-square difference of successive R-R intervals
lnRMSSDCV – coefficient of variation of weekly log-transformed root-mean-square difference of successive R-R intervals
Sleepmean – weekly mean total time spent sleeping
rrm – repeated-measures correlation coefficient
95%CI – 95% confidence intervals for rrm
* p < 0.05, ** p < 0.01
With the repeated-measures correlation analysis approach (Table 4 and Figure 4), the results showed that ITImean had a positive correlation with lnRMSSDCV (p = 0.03, rrm [moderate]) and a negative correlation with CMJ (p = 0.005, rrm [moderate]) and Sleepmean (p = 0.045, rrm [moderate]). There was also a negative correlation between lnRMSSDmean and lnRMSSDCV (rrm = –0.54 [moderate], p < 0.001, 95%CI [–0.73 to –0.28]) (Figure 4).
Discussion
This study explored the relationship between ITI and physiological and performance markers during a five-week preseason in professional soccer players. The results showed significant changes during the pre-competition phase, with ITImean decreasing, while CMJ increased over the observed period. No significant changes were observed in RHRmean, lnRMSSDmean, or sleep duration, though lnRMSSDCV showed a notable 39.9% reduction from week 1 to 5. Repeated correlation analysis revealed that ITImean was positively correlated with lnRMSSDCV, and negatively correlated with Sleepmean and CMJ, while lnRMSSDmean correlated negatively with lnRMSSDCV. The results of the present study offer essential insights into how meticulously implemented training programs in the preseason phase can affect physiological and autonomic adaptations and neuromuscular performances in professional soccer players.
The ITImean showed a significant decrease, with values ranging from 288 to 494 a.u., which is comparable to those observed in professional senior soccer players during preseason [42]. However, they were higher than those reported for youth soccer players [43], with both preseason periods lasting 4 to 6 weeks. A reduction in ITI was linked to improvements in physical match performance, making it a reliable indicator of players’ condition and readiness. Research shows that a decrease in ITI during the tapering in the preseason phase can improve players’ readiness for matches [44]. Achieving balance in ITI is crucial for athletes to avoid overtraining and to maximise performance [45]. CMJ showed a progressive increase during the weeks despite a single decrease of 6% from week 1 to week 2. This initial drop likely reflects accumulated neuromuscular fatigue from the increased training intensity at the start of the preseason (highest ITI in week 1). Similar patterns have been observed in soccer, where early-phase training stress temporarily suppresses power output before adaptation occurs [46]. By Weeks 3–5, as players adapted and fatigue levels decreased, CMJ performance improved, indicating positive neuromuscular adaptation to the training stimulus. The findings of this study support the importance of considering early-phase fatigue effects when interpreting short-term CMJ fluctuations. However, studies of CMJ during preseason show mixed findings, with some studies showing that CMJ changes are trivial [47,48], while these changes are significant in others [49,50]. These differences may be influenced by training volume, load distribution, and individual adaptation rates. While CMJ is an indicator of neuro-muscular function, it does not fully capture the complexity of performance adaptations during preseason. Soccer performance relies not only on lower-body power but also on endurance, agility, tactical skills, and psychological readiness [51,52]. Consequently, CMJ should be interpreted alongside other performance metrics, such as sprint tests and technical-tactical assessments, to obtain a comprehensive view of player readiness. lnRMSSDCV decreased by 39.88% (95% CI: –57.14% to –22.63%, p = 0.1), indicating a substantial physiological adaptation despite statistical non-significance. This finding may suggest that there was a meaningful physiological adaptation in soccer players and is in alignment with previous research where a reduction in lnRMSSDCV was reported [53,54]. Moreover, reduced lnRMSSDCV has been correlated with fewer daily fluctuations, indicating autonomic stability during well-managed training intensities [54]. Therefore, reduced lnRMSSDCV may indicate the stability of the functioning of the autonomic nervous system (ANS), implying that athletes have adjusted to the imposed training intensities. On the other hand, lnRMSSDmean stabilisation over the weeks suggests that the average vagal tone remained consistent despite changes in day-to-day variability. Campos-Vazquez et al. [55] found that during controlled training phases, lnRMSSDmean remains stable despite changes in training intensity. Similarly, the lack of significant changes in RHRmean may reflect a good balance of autonomic nervous system (ANS) and cardiovascular fitness [56]. Therefore, the non-significant time effect in both indicators of autonomic regulation is not surprising, indicating that players had a well-balanced training intensity and maintained parasym-pathetic balance during the observed period.
The sleep duration remained unchanged over the weeks, with an average of 7.5 hours, which aligns with recommendations for professional athletes [57]. The consistent Sleepmean values suggest that the players maintained relatively stable sleep durations across the weeks (p = 0.45). Sleep patterns in athletes often remain stable during different training phases, suggesting that external stressors or training load variations may not always disrupt sleep duration [58,59]. The stability observed may reflect effective recovery practices or the athletes’ adherence to good sleep hygiene strategies [60].
The repeated-measures correlation analysis showed a moderate, positive correlation between ITImean and lnRMSSDCV (r = 0.35, p = 0.03), suggesting that increased training intensity is associated with greater daily fluctuations in HRV. The moderate strength of the correlation suggests that any fluctuations remained within a manageable range, indicating that training adaptations were largely appropriate. Previous studies in soccer [61], rugby [30] and futsal [62] have shown similar findings, where a reduction in lnRMSSDCV is considered an indicator of physiological adaptability to training stress. Inter-day variability in parasympathetic activity, as reflected by lnRMSSDCV, may indicate a dynamic autonomic response to fluctuating training intensity, which is essential for maintaining performance and preventing overtraining [62]. According to Nakamura and Flatt [63], consistently high variability in lnRMSSD values within a week is generally considered undesirable. While lnRMSSD is a key indicator of parasympathetic activity, excessive fluctuations suggest irregular adaptations to training loads, potentially indicating inadequate recovery or excessive fatigue accumulation [63]. Well-trained athletes typically exhibit lower lnRMSSDCV, as their autonomic nervous systems demonstrate greater stability in response to training stimuli, facilitating more consistent recovery and performance readiness [61].
Previous research on the relationship between weekly lnRMSSD and ITI shows mixed results. A study in elite water polo players found low that correlations between internal training intensity and lnRMSSD-mean were observed during preseason, and no correlation was found during in-season periods [64]. Its authors attribute this to the influence of non-training stressors during competition phases. Similarly, Nakamura et al. [53] reported that lnRMSSDmean remained unchanged across a 5-week preseason in futsal players, and no significant correlations were observed between weekly srPE and lnRMSSD. On the other hand, some studies reported significant positive correlations between lnRMSSDmean and internal training intensity [65–67]. However, the coefficient of variation of lnRMSSD has been suggested as a potentially more sensitive indicator to detect acute changes in training intensity [62,68]. lnRMSSDmean is more stable among elite or professional players than recreational athletes, potentially due to their higher baseline fitness levels and greater capacity to tolerate training stress. Thus, at the team level, lnRMSSDmean appears less sensitive to acute changes in internal training intensity, reflecting its role as a marker of long-term parasympathetic balance and chronic recovery [69]. The observed discrepancy between lnRMSSDCV and lnRMSSDmean aligns with findings observed in futsal players, where lnRMSSDCV was shown to be a more responsive marker of training adaptations than the mean values [53,62]. This reinforces the idea that, while lnRMSSDmean reflects baseline parasympathetic function, lnRMSSDCV serves as a more dynamic indicator of training-induced stress. Finally, the observed moderate negative correlation between lnRMSSDmean and lnRMSSDCV aligns with previous findings, suggesting that greater para-sympathetic activity reflects a higher resilience or capacity to training stress [53,62]. During preparatory soccer training, an optimal weekly lnRMSSD pattern is characterised by a gradual rise in weekly average values and a decrease in daily variability (lnRMSSDCV) [63]. This relationship indicates that players with a well-maintained autonomic balance are stronger at recovering from day-to-day training demands, minimising perturbations in HRV. Therefore, a negative correlation highlights the significance of maintaining stable and elevated lnRMSSDmean values, while a reduced lnRMSSDCV may improve training adaptations by promoting increased resilience to cumulative training stress [70]. These findings highlight the importance of routinely monitoring these measures to modify training intensities and facilitate optimal recovery and performance improvement [53].
A moderate negative correlation was found between Sleepmean and ITImean. Increased ITI was associated with shorter sleep duration, potentially due to factors such as heightened autonomic arousal, increased physiological demands, and psychological stress resulting from rigorous training sessions or competitions [58, 60]. For professional athletes, sleep is a crucial component of recovery and adaptation to training. It helps regulate hormones, restore energy levels, and support cognitive recovery, which are all vital for maintaining peak performance [71]. Decreased sleep duration, as observed in athletes with increased ITI, may impair recovery mechanisms, resulting in reduced performance and higher fatigue. Studies have highlighted that enhancing sleep hygiene and obtaining adequate sleep is crucial for accommodating the requirements of intensive training programs [58,59]. Furthermore, variability in sleep patterns may intensify the adverse effects of increased ITI. Athletes with irregular sleep patterns or variable sleep lengths are more prone to sleep disruptions, which may intensify the stress of rigorous training and delay recovery [72]. From a practical perspective, coaches and sports scientists should closely monitor sleep as a key recovery metric. If players exhibit consistently reduced sleep duration during periods of high ITI, adjustments to training intensity or recovery strategies may be necessary. Furthermore, educating athletes on sleep hygiene and optimising sleep schedules can enhance recovery and maintain performance across the season.
A moderate negative connection between ITImean and neuromuscular performance (CMJ) is consistent with prior research in soccer. Increased training exposure may cause fatigue, impairing neuromuscular function. Los Arcos et al. [46] found that increased training intensities were inversely correlated with physical performance, including CMJ, during prolonged training periods. Malone et al. [47] similarly indicated that cumulative fatigue reduced neuromuscular performance during high-intensity training periods. The observed effects are likely attributable to functional or non-functional overreaching, where excessive workloads surpass recovery capability, resulting in brief reductions in muscular power [73]. Therefore, training intensities were carefully planned and modified over the five-week preseason phase in this study. Consistent enhancements in physical performance, including CMJ performance, are essential for athletes over the latter phases of the season.
This study has a few limitations that should be acknowledged. The sample size of 10 players limits the generalisability of the findings and provides only a snapshot of short-term adaptations. A larger sample would allow for greater variability in individual responses and improve the robustness of the conclusions. Although the HRV stability over the five-week preseason suggests that autonomic balance was maintained, metrics like lnRMSSDmean and lnRMSSDCV alone may not confirm full recovery. Laboratory-based measures of fitness or physiological responses, such as biochemical markers (e.g., cortisol, lactate) or muscle damage indicators, could have provided a more comprehensive understanding of training adaptations and recovery status. Moreover, the absence of specific performance tests also limits the ability to fully understand how lnRMSSD and other physiological markers relate to performance adaptations. Future research should explore these relationships over longer training periods and include a broader range of laboratory-based performance and physiological markers. This should include a combination of objective and subjective indicators, such as subjective fatigue scores, cortisol and lactate concentration, and muscle soreness tracking alongside HRV. A comprehensive, multidimensional approach would provide deeper insights into training adaptations, recovery status, and overall athlete readiness, ultimately optimising the intensity management strategy. Lastly, several potential confounding variables were not controlled for, including diet, training history, and psychological stress, all of which could influence HRV, CMJ, and sleep duration. Variability in nutritional intake, prior training intensity, or individual stress levels may have impacted physiological markers, making it difficult to isolate the effects of training intensity alone.
Practical applications
The results of this study provide significant insights for coaches and performance personnel. The decrease in ITI over the preseason demonstrates the advantages of progressively decreasing intensity, which enhanced neuromuscular performance, as indicated by the CMJ. This may reflect that players successfully recovered and transitioned training adaptations into enhanced physical performance. The reduction in lnRMSSDCV, an indicator of autonomic stability, implies that the participants adapted well to the training requirements, showing reduced day-to-day variability in autonomic function. This is a crucial indicator for coaches to assess, demonstrating players’ ability to manage training intensities and recuperate effectively. To be specific, while lnRMSSDmean remained constant, the decrease in variability suggests a shift towards a more stable and resilient autonomic system. The regular sleep duration of approximately 7.5 hours was an additional favourable observation. Despite the increased demands of playing two matches per week in the later weeks, the players maintained consistent sleep patterns, which likely supported their recovery and performance.
Conclusions
This study highlights that a carefully designed pre-season program can lead to substantial improvements in performance and physiological stability in professional soccer players. In contrast to the original study, which centred on monitoring isolated variations in ITI and well-being measures throughout a five-week pre-season, the present research adopts a more comprehensive approach by examining the interplay between ITI, HRV, sleep, and CMJ. This integrated perspective analyses each variable’s temporal evolution and interactions, providing thorough knowledge of the relationship between training intensities, recovery, and performance. The incorporation of HRV markers (lnRMSSDmean and lnRMSSDCV) facilitates a detailed assessment of autonomic nervous system function, with lnRMSSDCV acting as a dynamic measure of autonomic stability and responsiveness to training intensities. The use of sleep duration as a recovery parameter underscores its potential impact on physiological recovery and neuromuscular function, introducing a vital aspect that was lacking in the original study. Through the analysis of all observed metrics, coaches can acquire insights into their players’ reactions to training and recovery.