Introduction
Basketball is widely recognised to be a sport characterised by repetitive high-intensity jumping, sprinting, and change-of-direction movements, so requiring athletes to be capable of producing the relevant power [1]. Vertical jumping is a key skill in basketball, necessary for assessing athletic performance, power and for conducting an injury risk assessment in athletes [2]. Specifically, the countermovement jump (CMJ) is frequently used to assess and monitor lower-body neuromuscular function due to its ease of implementation, for the low risk of injury, and the fact that it can be performed in ecological conditions, thus avoiding the need for athletes to perform in unfamiliar environments. Despite the availability of many other tests, the CMJ is likely to be a more natural movement pattern for many athletes, and has become commonplace in clinical practice and research [3].
Basketball training and competitive performance expose athletes to substantial risk of injury due to the sport’s intensive physical requirements. Injuries are often caused by a combination of player contact and mechanical loads from explosive movements, with the most common types being ligamentous injuries involving the knee (anterior cruciate ligament rupture) and the ankle (sprains) [1]. Risk factors include both circumstantial causes, such as contact with another player, overtraining, and insufficient warm-up, as well as physiological features, such as asymmetries in ankle range of motion and isokinetic strength, increased body mass index (BMI), neuromuscular imbalances, and prior injuries [1]. The majority of the above-mentioned aetiological factors can be identified and corrected. Therefore, there is a need for greater awareness of the importance of assessing potential injury-related factors in athletes during the pre-, intra-, and post-season periods. This includes the use of specific functional evaluations, such as the countermovement jump (CMJ) test, which can provide valuable insights to guide timely and effective interventions. Parameters extracted from jump tests could help to define areas for improvement, provide insights into the effects of a completed mesocycle, and guide sports professionals who work with athletes during recovery protocols [4]. These parameters are particularly significant for children and teenagers, as they are at a critical stage of development to acquire movement patterns in the most effective and efficient way possible.
Jumping performance and pattern vary depending on the level of training and the age of the athletes. In particular, a recent study reported that younger basketball athletes show an immature jumping pattern, characterised by a greater use of the ankle and less flexion of the hips and knees, probably due to a lack of lower quadriceps strength [5]. As reported by literature, there is a difference in the motor pattern between children and adults [6], which is why health professionals and coaches should take into account the age and physical capacities of the athlete in order to provide an appropriate training program, injury prevention strategies and, in case of injury, a correct rehabilitation protocol.
The available literature is poorly focused on studies conducted on adolescent basketball players, while some of the existing research addresses younger athletes or subjects involved in other sports. Consequently, there is a lack of data on how kinematic characteristics of the jumping phase evolve in basketball athletes throughout key developmental stages for sport performance [7].
The primary aim of this study was to assess how the kinematic and performance parameters of jumping, extracted through video analysis and an OptoJump system, change with player growth and development from 13 to 16 years old. As a secondary goal, we investigated which parameters were the most valuable for accurately characterising an athlete’s overall performance for each specific age group between 13 and 16 years old. Finally, we aimed to develop an interpretable machine learning model for classifying jumping performance based on biomechanical features, which could be useful for trainers and physiotherapists to evaluate the jumping techniques.
Material and methods
Study population
The study population consisted of male athletes from the Azzurra basketball club in Trieste, who were competing in the elite category championship of the current year. The inclusion criteria were: athletes required to be part of a specific age-band basketball team based on their birth year: 2007 (Under-16), 2008 (Under-15), 2009 (Under-14), and 2010 (Under-13) and the informed consent signed by the player’s parents. The sole exclusion criterion was the presence of prior severe injuries or the presence of lower limb pain at the time of the test that could impede the appropriate execution of the jump. That condition was assessed by a qualified physiotherapist. The included subjects were divided into four age-based sub-groups: under 16 (group 4), under 15 (group 3), under 14 (group 2), under 13 (group 1). For all included participants, anthropometric characteristics (height, weight, dominant limb) and additional information (years of basketball played and dominant side) were collected, measurements of kinematic parameters were obtained via an OptoJump system, and video analysis during CMJ was performed. All the athletes on the team were enrolled in the study, yielding a total of 50 subjects. Three of them were excluded as they presented consistent lower limb pain at the time of the test. The final sample comprised 3 left-dominant side subjects. Based on the specified criteria, the tested sample comprises 47 subjects divided into four subgroups as follows: group 1 (11 subjects), group 2 (11 subjects), group 3 (13 subjects), group 4 (12 subjects). The number of subjects in each subgroup reflects the typical roster size of a youth basketball team. We conducted an a priori power analysis to determine the appropriate sample size for this study. The significance level (α) was set at 0.017 (considering Bonferroni correction, as detailed below), and the desired power (1-β) at 0.80. Based on existing literature, Cohen’s d was set at a value commonly referred to as ‘large’, as a substantial difference between age groups was expected [8]. The analysis determined that an optimal sample size of 13 subjects per group would be sufficient, aligning well with our enrolment process. Moreover, the sample size is in accordance with previous literature, considering several works regarding kinematic and kinetic jumping evaluation, which had the same goals as our investigation [9]. This study adheres to the guidelines developed by Strengthening the Reporting of Observational Studies in Epidemiology (STROBE) to promote clear and thorough reporting of observational research [10].
Experimental procedure
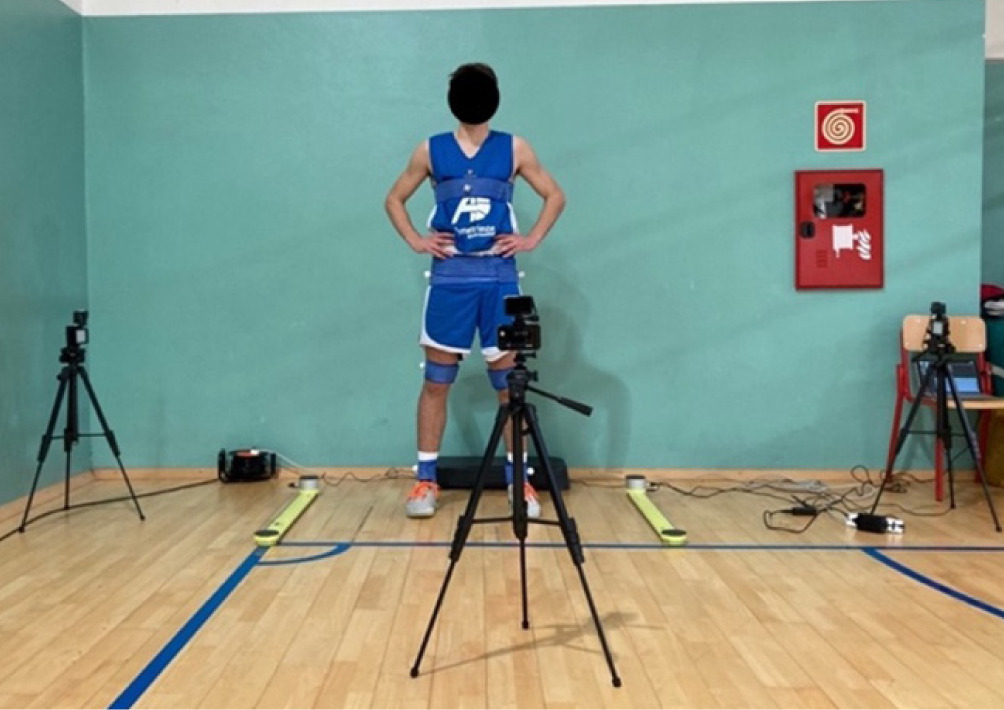
The testing protocol was carried out in ecological conditions, on a regular basketball court. All measurements were taken in the afternoon, during the athletes’ usual training hours, to ensure consistency with their typical daily routine. The assessments were performed in April, during a two-week break from matches, before entering the final National phase. Participants were asked to perform three CMJs, with an appropriate rest between the sets to allow for full recovery. Before the test, all the athletes completed a proper 15-minute warm-up, which included 5 min of ballistic movements followed by 10 min of running drills with increasing difficulty and intensity. After the warm-up, the seven reflective markers were applied to the subject, one for each lateral malleoli, one immediately below the knee lateral epicondyle of both knees, one on each great trochanter of the femur, and the last one on the xiphoid process of the sternum. The positioning points were established based on existing literature in the field, as well as the specific objectives of the analysis [11]. The participants were guided to the testing area, which was set up in one corner of the court. The testing area consisted of an OptoJump system and three GoPro cameras (motion capture (MoCap) system) positioned 200 centimetres from the athlete’s standing position, fixed in the middle between the two OptoJump bars: one in a frontal position and two in lateral positions, one to the right side and one to the left side of the athlete, respectively [12].
CMJ test
The countermovement jump (CMJ) involved the participants lowering themselves from an initial standing position to a self-selected squat position, followed immediately by a vertical jump. Participants were encouraged to perform the eccentric phase of the jump as quickly as possible, with the depth of the countermovement phase being self-selected by the participant to maximise the jump height. Before performing the jump, participants were instructed to achieve the greatest vertical height possible while observing two restrictions: keeping the hands on the hips at all times, thus avoiding upper-body interference, and jumping and landing on the same spot, to ensure that the jump was completely vertical [2].
Acquisition devices
The OptoJump photoelectric cells (Microgate, Bolzano, Italy) consist of two parallel bars connected to a PC. One bar acts as a transmitter unit containing 96 light emitting diodes positioned 0.003 m above the ground, while the other acts as the receiver unit. When the light is interrupted by an individual’s foot during a jump, the timer in the unit is triggered and starts recording with a resolution of 1 ms, which can be used to measure different parameters such as contact time (CT) as the total time that the light is interrupted, flight time (FT) as the total time between interruptions, jump height, and many other features. This system is currently heralded as the benchmark device in sport science thanks to its high accuracy, consistency across different testing conditions and the fact that it allows for testing and data collection in real sports environments, such as basketball courts and soccer fields [13]. In addition, through the MoCap system described above and the reflective markers, trunk flexion, knee flexion, ankle dorsiflexion and knee valgus parameters were measured. Considering the athlete’s standing starting position as the reference point, we calculated the range of motion (ROM) as the difference between the initial angle and the maximum angle reached during the propulsive phase of the jump. For the ankle, we considered the amount of dorsiflexion during the downward phase. In particular, the angles were measured from the initial standing position to the maximum dorsiflexion reached in the downward phase. All data and angle measurements of the above parameters were extracted using the Kinovea software (v. 0.8.15, Kinovea, Bordeaux, France). It is important to underline that many previous studies have highlighted the reliability and validity of video analysis feature collection using the Kinovea software [14]. The described testing setting is reported in Figure 1.
Statistical analysis
The statistical analysis was performed in MATLAB (MathWorks Inc., Natick, MA) (v. R2024b). All the parameters were extracted by considering the average of three jumps. As the first step, the normality of the variables was assessed using the Kolmogorov– Smirnov test. The normal variables are presented as mean and standard deviation (SD) and the non-normal variables as median and range.
For the comparison between age groups, a Student’s t-test for the normal variables and a Wilcoxon-rank test for the non-normal variables were performed looking for differences between adjacent age groups only. Considering the Bonferroni correction for multiple com parisons, a p < 0.017 was considered statistically significant.
In addition, a univariate logistic regression was used to identify, for each age group, the parameters related to ‘good jumping performance’, describing it as a height of the jump greater than the average of the corresponding group. In this analysis, a p < 0.05 was considered statistically significant.
Machine learning models
Machine learning (ML) models were developed to classify between ‘good’ and ‘bad’ jumps. The outcome was described using the previously specified criteria. The feature selection process was based on Information Gain, a method that ranks the parameters in terms of ‘entropy reduction’ (or ‘information gain’) obtained by including each of them and fixing a threshold of 0.15 [15]. The Naive Bayes, classification tree and logistic regression methods were employed to produce interpretable models capable of differentiating between the two possible outcomes (‘good jumping performance’, ‘bad jumping performance’), with interpretability being a crucial factor in creating predictive models for the healthcare field [16]. Performance parameters for results evaluation were obtained using 5-fold crossvalidation. In particular, Sensitivity was calculated as the proportion of true positives among all positive instances in the data, and Specificity as the proportion of true negatives among all negative instances. This method involves splitting the dataset into five equalsized groups and conducting iterations equal to the number of subdivisions, choosing in each of the iterations a different group as the test set, ensuring that no information related to any feature is lost throughout the process. 5-fold cross-validation is a widely accepted technique that helps mitigate over fitting and provides a more reliable estimate of a model’s predictive performance on unseen data. All analyses were carried out in the Python Orange Data Mining library and toolbox (v. 3.37.0) [17].
Results
The anthropometric characteristics for each subgroup are reported in Table 1.
Table 1
Sample characteristics for each of the sub-groups: 11 subjects for group 1, 11 subjects for group 2, 13 subjects for group 3 and 12 subjects for group 4 were tested
Age-specific characteristics of jump
As stated, the main aspect of this analysis was the evaluation of statistically relevant differences between age groups, considering the Bonferroni correction for multiple comparisons (p < 0.017). In the comparison between group 1 and group 2, considering the Bonferroni correction, no statistically significant differences were observed. Among group 2 and group 3 (Table 3), ankle dorsiflexion on both the dominant side and nondominant side showed a statistically significant difference (p = 0.01; p = 0.007), respectively. Finally, in the comparison between group 3 and group 4 (Table 4), a statistically significant difference was inferred for the following features: BMI (p = 0.005), trunk flexion (p = 0.01), knee flexion to both the dominant and nondominant side (p = 0.008; p = 0.004, respectively) and ankle dorsiflexion to both the dominant and non-dominant side (p < 0.001; p < 0.001, respectively).
Table 2
Comparison between group 1 and group 2
Table 3
Comparison between group 2 and group 3
Table 4
Comparison between group 3 and group 4
Jump performance for age groups
A univariate logistic regression analysis was conducted to evaluate the association between features extracted from both the OptoJump system and video analysis, with athletic performance in terms of a ‘good’ and ‘bad’ jump, across each age group, considering p < 0.05 to be statistically significant.
For group 1 (Table 5), significant correlations between dominant side knee flexion (p = 0.02) and dominant side ankle dorsiflexion (p = 0.04) with the outcome were observed. For group 2 (Table 6), correlations between trunk flexion (p = 0.02), non-dominant side ankle dorsiflexion (p = 0.02) and BMI (p = 0.02) with the outcome were observed. For group 3 (Table 7), a correlation between non-dominant side knee valgus (p = 0.02) with the outcome was observed. Lastly, for group 4 (Table 8), correlations between non-dominant side knee flexion (p = 0.02) and dominant side ankle dorsiflexion (p = 0.02) with the outcome were observed.
Table 5
Logistic regression for group 1
Table 6
Logistic regression for group 2
Table 7
Logistic regression for group 3
Table 8
Logistic regression for group 4
Performance predictive model for group 1
Despite having developed models for each of the subgroups, we focused on group 1, considering their thirty-three jumps, as this group was composed of the youngest athletes with the greatest room for intervention and subsequent improvement in motor skills [18]. The application of the Information Gain criterion with a threshold fixed at 0.15 highlighted the following features as valuable for the subsequent model development: dominant side knee flexion (IG = 0.34), dominant side ankle dorsiflexion (IG = 0.19), non-dominant side knee valgus (IG = 0.17), dominant side knee valgus (IG = 0.15). The Naive Bayes model demonstrated superior performance compared to other models, achieving an AUC of 84%, accuracy of 79%, F1 score of 81%, precision of 83%, sensitivity of 79%, and specificity of 79%, outperforming classification tree and logistic regression across all metrics (Table 9). Furthermore, the model accurately classifies ‘poor jumping performance (0)’ with a success rate of 78.6% and ‘good jumping performance (1)’ with a success rate of 78.9%. All the evaluation metrics reported were obtained using the 5-fold cross-validation criterion.
Table 9
Performance of Naive Bayes, logistic regression and classification tree models for 2010 group
| Model | Group 1 | |||||
|---|---|---|---|---|---|---|
| AUC | CA | F1 | precision | sensitivity | specificity | |
| Naive Bayes | 0.84 | 0.79 | 0.81 | 0.83 | 0.79 | 0.79 |
| Logistic regression | 0.74 | 0.70 | 0.74 | 0.74 | 0.74 | 0.64 |
| Classification tree | 0.66 | 0.64 | 0.67 | 0.70 | 0.63 | 0.64 |
[i] This table shows the performance metrics of different machine learning models evaluated for group 1. The models assessed include Naive Bayes, logistic regression, and classification tree. The metrics reported are area under the curve (AUC), classification accuracy (CA), F1-score, precision, sensitivity, and specificity.
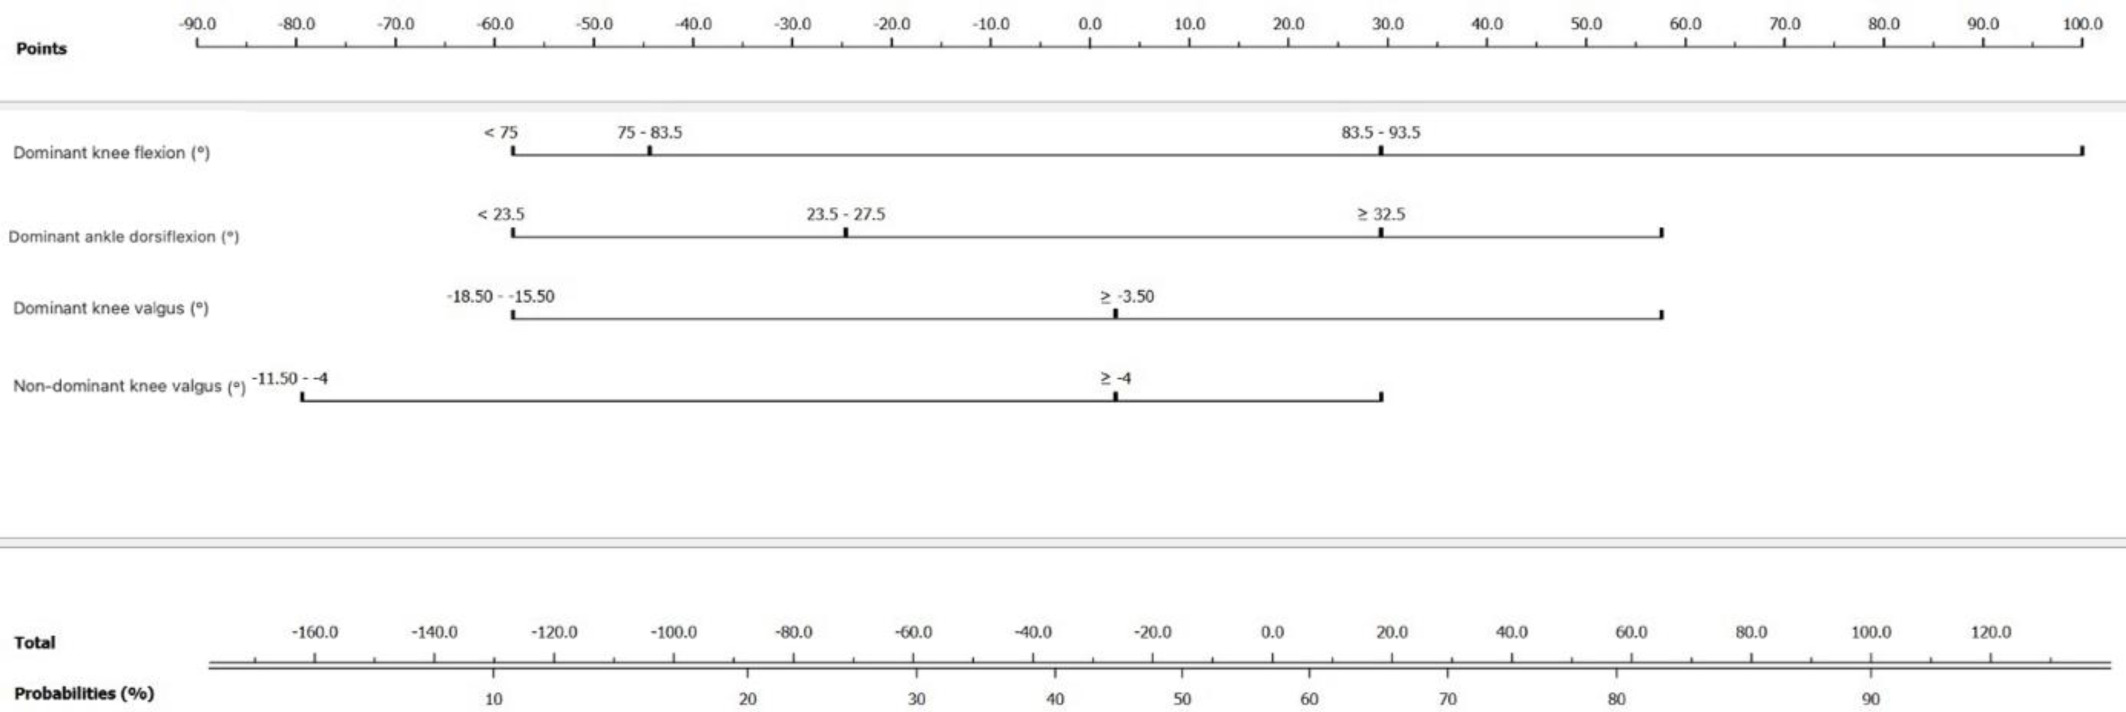
Lastly, the nomogram of the Naive Bayes model is depicted in Figure 2.
Discussion
Jumping is undoubtedly an essential motor ability in basketball and an important skill to be evaluated in injury risk assessment and performance tests [5, 19]. Among all the possible jump tests, the CMJ was chosen for this study because it is easy to perform, has a low risk of injury, and appears to be a natural movement for athletes [20]. Moreover, the CMJ is widely used as an indicator of athletes’ power performance [21]. Although prior research has suggested performance and pattern differences based on athletes’ ages, there is limited evidence regarding how the jumping pattern evolves during growth. Furthermore, the identification of the parameters that most effectively characterise overall performance and condition remains less explored across specific age groups.
Our findings contribute to the characterisation of kinematic pattern progression and to the identification of parameters predictive of good performance. Firstly, the analysis showed that as players mature from 14 to 15 years of age, they increasingly execute jumps with reduced dominant side ankle dorsiflexion (p = 0.01) and non-dominant side ankle dorsiflexion (p = 0.007). This trend may be attributed to the stiffness of the plantar flexors and the posterior kinetic chain commonly observed during this phase of physical development, which is due to the imbalance resulting from changes in the capacities of muscles and tendons [22]. Another relevant factor to consider is the exposure to intense physical activity without adequate personalised supervision [23]. This lack of supervision, even at a young age, may contribute to the development of movement patterns that, although natural, are suboptimal, as athletes might not learn or consolidate proper techniques during critical developmental stages.
In contrast, the comparison between the under 15 group and the under 16 group showed that physical development brings greater ankle dorsiflexion (Table 4, dominant side ankle dorsiflexion p < 0.001, non-dominant side ankle dorsiflexion p < 0.001) and reduced trunk involvement (Table 4, trunk flexion p = 0.01). This group also demonstrates less knee flexion bilaterally (Table 4, dominant side knee dorsiflexion p = 0.008, non-dominant side knee dorsiflexion p = 0.004), which appears to result from an increased contribution of the ankle. This adaptation is supported by a more stable physical profile, with improved power balance between the posterior and anterior kinetic chains. The greater use of the trunk in younger athletes compared to more mature individuals is a pattern previously demonstrated by Baellow et al. [24], who showed that adolescents employ trunk flexion as a compensatory strategy, particularly when lower-limb power is insufficient. Our results concerning specific and remarkable differences in jumping patterns related to the age of the players are in line with previous findings in which muscular performance differences were highlighted [25]. In particular, Dotan et al. suggest that younger athletes differ from adults in muscle activation patterns, notably due to their less efficient recruitment of higher-threshold type-II motor units, leading to distinct neuromuscular adaptations and performance outcomes.
The results of the logistic regression analysis provided important information about the parameters related to good jumping performance within each age group (p < 0.05 was considered statistically significant). The highlighted features are also consistent with the age of the players and with previous literature evidence [26, 27]. In fact, greater knee flexion (Table 5, dominant side knee f lexion p = 0.02; Table 8, nondominant side knee flexion p = 0.02), greater ankle mobility (Table 5, dominant side ankle dorsiflexion p = 0.04; Table 6, non-dominant side ankle dorsiflexion p = 0.02; Table 8, non-dominant side knee flexion p = 0.02) and better control of joint alignment, represented by the knee valgus closer to a 0° degree (Table 7, non-dominant side knee valgus p = 0.02) showed significant correlations with good jumping performance. For group 2, an inverse significant correlation can be seen with the outcome of the trunk flexion parameter (p = 0.02). As explained, young players are prone to developing a jumping pattern with remarkable use of the trunk in order to make up for an imbalance in muscle and tendon capacities due to in-progress physical development [22]. Nevertheless, this compensatory movement seems still not to be consolidated and therefore produces a negative effect on the performance rather than contributing to positive jump performance.
Although sport kinematics analysis is a field in which the possible use of AI methods is reported in the literature, only sparse research has shown a practical application, especially regarding interpretable models [28]. Therefore, this study also aimed to develop an interpretable machine learning model that can be practically applied by trainers and physiotherapists, allowing targeted analysis of specific jump characteristics closely associated with gesture performance. This aspect is crucial as it provides a practical tool to evaluate whether the movement pattern shown by an athlete, not only during the jump itself but also in preparatory exercises, is correlated with successful jump performance.
After having compared the performances of the models obtained with the aforementioned techniques, the Naive Bayes model showed the best results. The model is based on Bayes’ theorem, which provides a probabilistic framework for predicting class membership based on prior knowledge and observed data. The Naive Bayes classifier operates under the assumption of conditional independence among features, which simplifies the computation of probabilities. This method, which has the advantage of requiring a relatively small amount of training data for an accurate classification, has been successfully applied in various domains, including medical diagnosis [29]. The nomogram representing the Naive Bayes model shows the selected features in order of importance: dominant side knee flexion, dominant side ankle dorsiflexion, dominant side knee valgus and non-dominant side knee valgus. The trend of the parameters appears to be in agreement with previous studies as a knee flexion around 90° (predominantly regarding the dominant side) [30], a major ankle dorsiflexion [27] and closer to zero degrees of knees valgus seem to be related to good jumping performance [26].
This study has some limitations, including the selection of athletes from a single basketball club. Nevertheless, the sample size and characteristics reflect the real context of basketball players of the specified age involved in an elite category championship. Additionally, the use of a single camera per plane of movement presents inherent constraints associated with 2D motion analysis, as it does not capture out-of-plane movements. Other kinetic variables (e.g. power, FT-CT) were not assessed to better focus on the important biomechanical and kinetic features evaluated. Furthermore, data on individual maturation status, which could influence physical performance measures, were not included. Future research should aim to incorporate multi-camera systems, kinetic assessments, and maturation data to enhance the comprehensiveness of the movement analysis.
Conclusions
Our results showed how jumping patterns progressively change with the age of athletes between 13 and 16 years. As athletes mature, their jumping pattern evolves, showing increased ankle dorsiflexion (p < 0.001) and reduced trunk involvement (p = 0.01), with the latter likely reflecting a compensatory strategy adopted by younger athletes to counteract limited lower limb power. We further identified crucial kinematic parameters linked to optimal jumping performance within specific age groups. We also developed an interpretable machine learning model (AUC 84%, accuracy of 79%, sensitivity of 79%, specificity of 79%) to predict jumping performance based on kinematic parameters, which could be a valuable tool for trainers and physiotherapists.