Introduction
Kayaking is characterised by high demands on strength, speed, and endurance, which vary depending on the length and nature of the paddling discipline [1]. Different kayaking courses require athletes to adapt to varying physiological demands that involve both aerobic and anaerobic capacities [2]. On a 1000-metre course, an athlete’s aerobic capacity predominates, meaning that the ability to efficiently use oxygen to produce energy over a longer period is the key to successful performance at this distance [3]. On a 200-metre course, anaerobic capacity becomes the decisive factor, allowing an athlete to achieve high performance in an extremely short time frame [4]. For the 500-metre course, the ideal balance between aerobic and anaerobic components is discussed, which is crucial for achieving optimal performance in this intermediate distance [1]. Understanding the different physiological demands of various kayaking distances not only guides training but also emphasises the importance of precise physiological testing for tailoring preparation and strategy for athlete performance [5]. Since the requirements on aerobic and anaerobic capacities differ significantly between courses, it is essential to use specific tests that can accurately assess these capacities [6]. The most common test for determining anaerobic capacity is the Wingate test, which is typically conducted over a period of 30 s in cycling or rowing and is known for its ability to provide accurate and reliable data on an athlete’s anaerobic performance [7]. In kayaking, older studies to assess upper limb anaerobic capacity used various tests, including the Wingate test with varying durations from 30 to 60 s [8]. However, recent studies in kayaking use Wingate test with a standard duration of 30 s with a correlation to improvements after anaerobic training [9, 10] or actual racing performance [11]. A clear association between performance and relative peak power measured by the Wingate test has also been demonstrated in other sports, such as long-track speed skating [12].
A possible limitation in previous studies assessing anaerobic capacity in kayaking is the use of standard kayaking ergometers [3, 4, 9]. These ergometers impose technical constraints that prevent athletes from achieving maximal power output, compromising the validity of anaerobic performance measurements. Modified upper-arm ergometers with crank power transmission, rather than rope winding, allow maximal power output. This makes them more suitable for measuring anaerobic performance in flat-water kayaking under laboratory conditions, as recently used by Du and Tao [10].
To complement the assessment of anaerobic power, spiroergometry is utilised to measure the maximum volume of oxygen an athlete can utilise during intense exercise, thus determining his or her VO2max [13]. This evaluation is critical for understanding an athlete’s capacity for aerobic energy production, which is essential for sustained efforts in longer races [14].
Moreover, the measurement of lactate levels following high-intensity exercise, such as the Wingate test, and during spiroergometric assessments provides insights into the athlete’s lactate dynamics. This analysis is crucial for understanding the maximum effort an athlete can sustain before the lactate accumulation leads to fatigue [15]. Monitoring these levels helps to identify the transition point from aerobic to anaerobic metabolism, which is essential for tailoring training to improve both lactate clearance and tolerance [16]. Although the maximal lactate concentration was monitored in previous studies concerning anaerobic performance in kayaking, a deeper analysis and understanding of the relationship between lactate concentration and anaerobic performance is lacking.
This research focuses on a comprehensive examination of the interplay between anaerobic capacity, aerobic capacity, and lactate accumulation, considering their collective impact on performance in elite kayaking. Despite current findings that challenge the primacy of aerobic capacity in shorter Olympic distances, our study aims to identify performance parameters that distinguish international-level athletes from their national-level counterparts. By integrating data from both anaerobic and aerobic tests, alongside lactate profiling, this study aims to provide a nuanced understanding of the physiological factors that drive elite performance in kayaking.
Material and methods
Participants
The study involved 25 elite Czech male kayakers (aged 25 ± 4 years), who were selected based on their performance records in the pre-season control races (Table S1) and participation in top competitions in the previous season. The participants were divided into two groups. International-level (INT) athletes were competing in significant international competitions such as the European Championships, World Championships, and the Olympic Games, including a current Olympic champion. National-level (NAT) athletes are primarily competing at the national level, often achieving commendable results, but without participating in international events in the previous season. All the tests were performed in the middle of the preparation and training phase (off-season). All participants had undergone at least 10 weeks of regular training before performing the testing procedures. Injured or sick athletes were excluded from testing. Strenuous activity was not allowed 24 h before the test.
Anthropometric measurements
Measurements were performed in the morning before the Wingate test. Participants were asked to fast and not to drink for at least 2 h before the anthropo-metric measurements. Snacks and hydration were allowed before and between performance tests. First, height was measured using a stadiometer (SECA 213, SECA GmbH & Co, Germany), followed by measurement of six skinfolds (triceps, biceps, subscapular, supraspinal, front thigh, and medial calf) [17] using a Harpenden skin-fold calliper (Baty International, England). Bioelectrical impedance (BIA) (Tanita MC-780 MA P, Tanita, Japan) was used to obtain additional anthropometric variables: body mass (kg), body fat mass (kg), muscle mass (kg), skeletal muscle mass (kg) and segmental muscle mass (kg).
Wingate Upper Arm Test
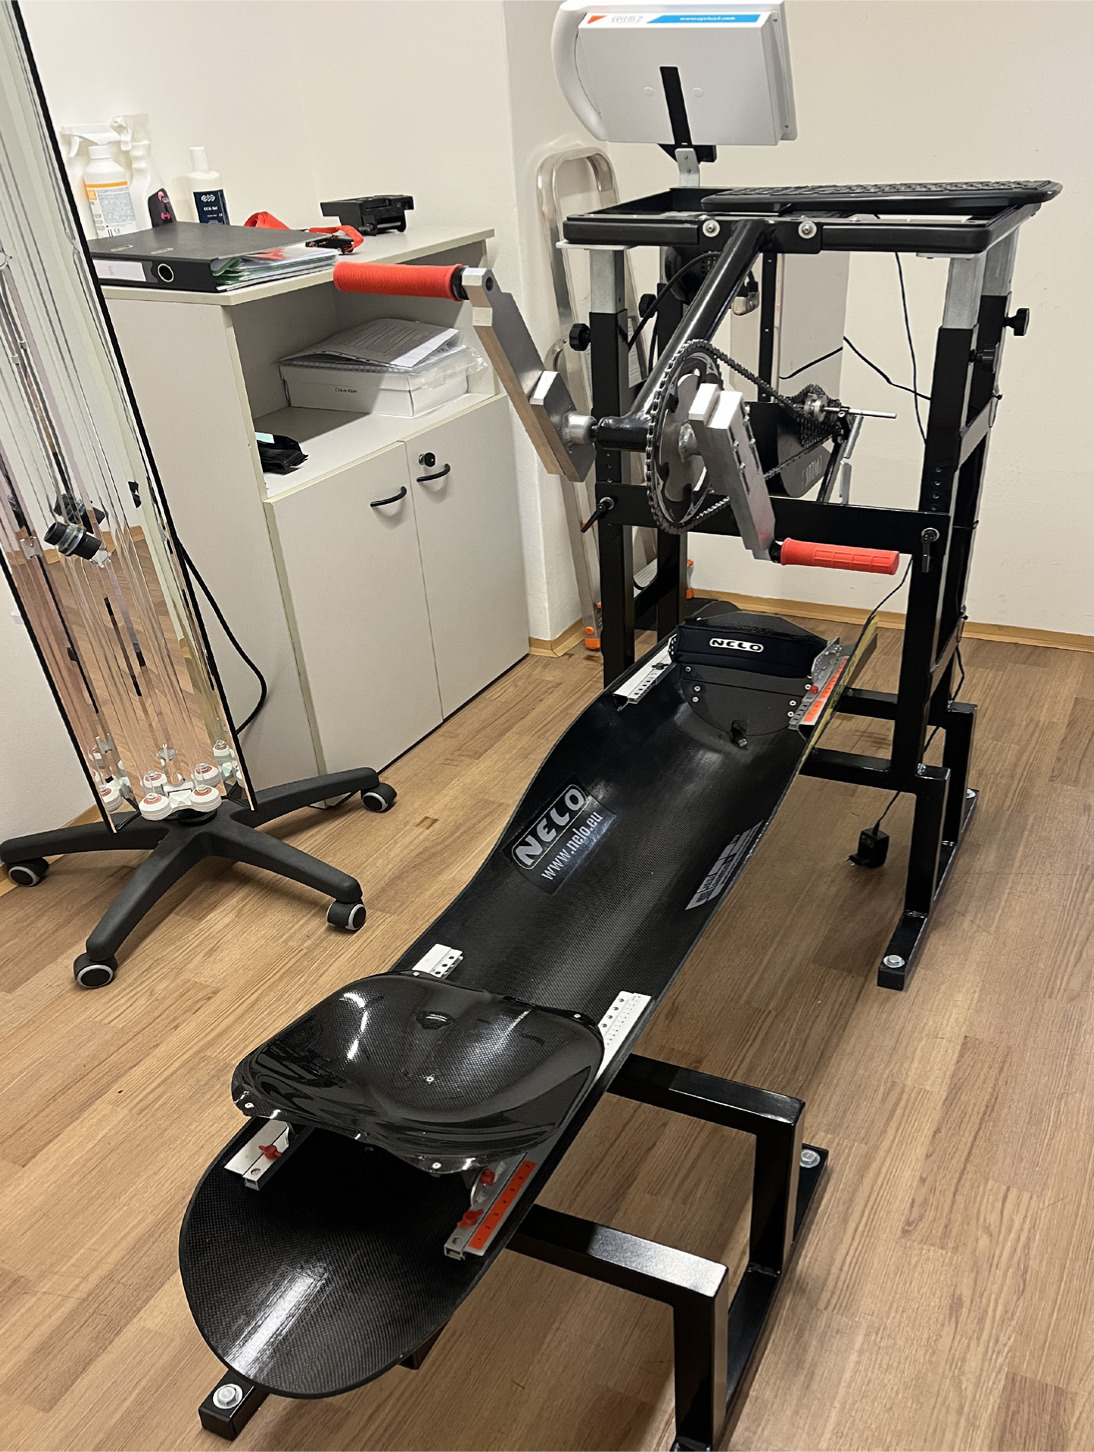
The test was conducted on a specifically modified apparatus (RBM elektronik-automation GmbH, Germany) developed for maximal power testing of the upper arms with an ideally adjusted seat imitating sitting in a real kayak (Figure S1). The warm-up prior to the actual test was left to the discretion of the participants to ensure an optimal state for the test. The test started when a cadence of 120 revolutions per minute was reached. Each participant exerted maximum effort for a duration of 30 s. Participants were encouraged during the test to exert their maximum. During this intense segment, key metrics were recorded, including PP and MP, both expressed in watts and relative watts per kilogram, as well as the average number of revolutions and the fatigue index, expressed in W/s. The braking resistance was set to 0.68 N · kg–1 [8], which contributing to standardising the testing conditions. In order to determine the maximal lactate concentration after the completion of the test, capillary blood was sampled at the fifth and seventh minutes. The higher value was then used as the maximal lactate concentration and defined as LAmax.
Spiroergometry for VO2max estimation
The test protocol started at least 2 h after the Win-gate test with the measurement of the resting ventilation, where the vital lung capacity and forced expiratory volume in one second (FVC, FEV1) were assessed. Following this initial assessment, the kayak ergometer was set up based on individual specifications derived from their coach’s recommendations. Participants then undertook a self-directed warm-up to adequately prepare their bodies for the exertion required in the subsequent phases. The main component of the spiroergometry was conducted using a COSMED device (CPET Quark, COSMED Srl, Italy), which measures maximal aerobic capacity (VO2max), expressed in ml/min/kg. During this test, the load intensity on the kayak ergometer was increasing by 20 W per minute until the point of maximum exertion was reached [18]. Three minutes after the test completion, capillary blood was collected to determine the lactate accumulation. This sequence ensured a comprehensive evaluation of each athlete’s aerobic and anaerobic capacities and physical response under stress.
Lactate concentration determination via capillary blood
The lactate concentration was determined in sampled capillary blood following both the Wingate test and spiroergometry, referred to as LAmax and LA3′, respectively. Capillary blood was collected from the non-dominant ring finger using a disposable needle (Micro-lanceTM 3, Becton-Dickinson, USA) into a 200 µL heparinised capillary tube (Roche Diagnostics GmbH, Denmark). Twenty µL of the sampled blood was transferred into a systemic solution (DiaSys diagnostic Systems GmbH, Germany) and the lactate concentration was analysed by electrochemical measurement using a compact biosensor with two independent electrode systems (SensoStar GL30, DiaSys diagnostic Systems GmbH, Germany).
Statistical analysis
Statistical analyses were conducted using R (version 4.3.3) and RStudio (version 2024.04.2). Descriptive statistics were used to assess participant characteristics, with mean and SD reported, to facilitate comparison with previous studies. The normality of the data was evaluated using the Shapiro–Wilk test, which confirmed that all data sets were normally distributed (p > 0.05). Student’s t-test for independent samples was applied for group comparisons, as the groups were unmatched and of different sizes, thus not meeting the criteria for paired analysis. Additionally, a paired Student’s t-test was used to compare the values of LA3 and LAmax within the two distinct groups (international and national competitors). A Pearson correlation analysis was employed to assess relationships in normally distributed data. Finally, a linear regression analysis was conducted to explore the interrelationships between selected parameters. Statistical significance was set at p < 0.05.
Results
Anthropometry
Anthropometric measurements revealed no statistically significant differences in body composition between the international- and national-level kayakers. Both groups had similar weights (87.45 ± 9.53 kg for international vs. 81.96 ± 6.07 kg for national, p = 0.16) and heights (186.96 ± 7.00 cm vs. 185.55 ± 4.77 cm, p = 0.58). Body fat was comparable, with the international kayakers having an average fat mass of 9.95 ± 3.55 kg and a body fat percentage of 11.41 ± 3.52%, compared to 8.70 ± 3.00 kg and 10.57 ± 3.58% for the national kayakers (p = 0.37 for fat mass, p = 0.57 for percentage). Measurements of muscle mass, including skeletal and total muscle mass as well as segmental distribution in the trunk and limbs, also showed no significant statistical differences, suggesting that factors other than basic body composition might play a role at higher levels of performance.
Table 1
Anthropometric profile of elite kayakers
Wingate Upper Arm test
The results of the Wingate test, as presented in Table 2, demonstrated a statistically significant difference in PP (W/kg) between the groups (p = 0.016). The international-level kayakers achieved a higher PP, averaging 10.43 ± 0.80 W/kg, compared to 9.69 ± 0.52 W/kg in the national-level group (Figure 1). The effect size (Cohen’s d) between the INT and NAT groups is 1.06 at a significance level of alpha = 0.05 and a test power of 70%. This significant difference suggests superior anaerobic power among international-level kayakers.
No statistically significant difference was observed in the MP (W/kg) between the groups (Figure 1), with the international-level group recording a MP of 7.71 ± 0.69 W/kg and the national-level group achieving 7.36 ± 0.55 W/kg (p = 0.194). The number of revolutions per minute (RPM) during the 30-second test also did not differ significantly, with the international-level kay-akers reaching 110.07 ± 7.64 RPM, while the national-level kayakers averaged 105.00 ± 7.66 RPM (p = 0.1118).
The fatigue index (W/s) also did not show statistically significant differences between groups, with the international-level kayakers averaging 15.82 ± 3.80 W/s compared to 13.62 ± 3.23 W/s in the national group (p = 0.147).
Table 2
Wingate upper arm test results of elite kayakers
Spiroergometry
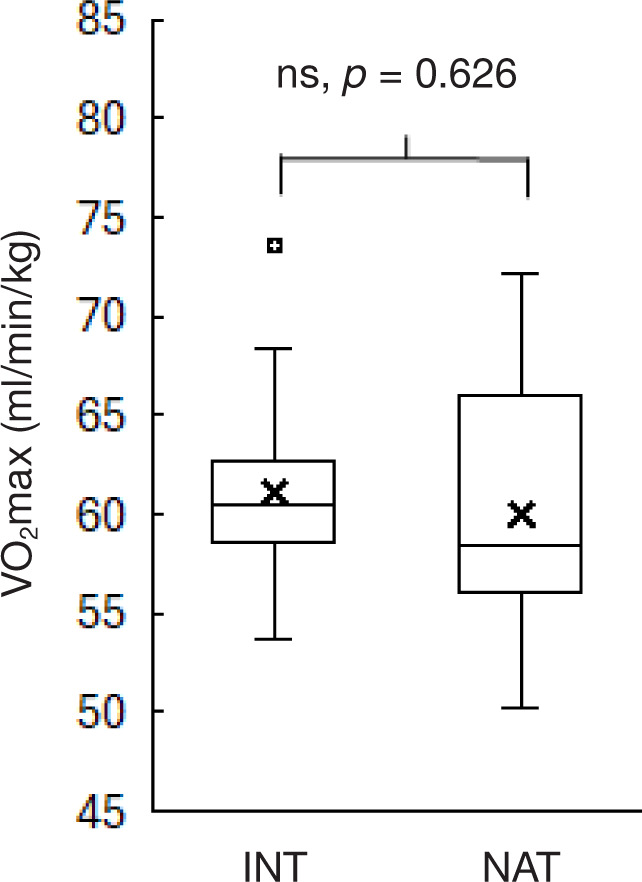
The analysis of the VO2max values obtained during spiroergometry in the international-level group revealed slightly higher mean values (60 ± 6.5 ml/min/kg) compared to participants at the national level (61.1 ± 4.7 ml/min/kg) (Table 3, Figure 2). However, this difference is not statistically significant.
Table 3
Spiroergometry results of elite kayakers
| Parameter | International-level mean (SD) | National-level mean (SD) | Student’s t-test ( p-value) |
| VO2max (ml/min/kg) | 61.1 (4.73) | 60.0 (6.60) | 0.626 |
| Lactate (mmol/l) | 10.8 (2.36) | 12.1 (3.37) | 0.273 |
Figure 1
Performances in the Wingate upper arm test. Box plots illustrate dataset distribution for peak power (a) and mean power (b) from the Wingate upper arm test for international group (INT) and national group (NAT). The boxes span from the first quartile (Q1) to the third quartile (Q3). Medians are indicated by horizontal lines. Crosses mark the means. Whiskers extend to the minimum and maximum non-outlier values. Outliers are displayed as individual points outside the whiskers.
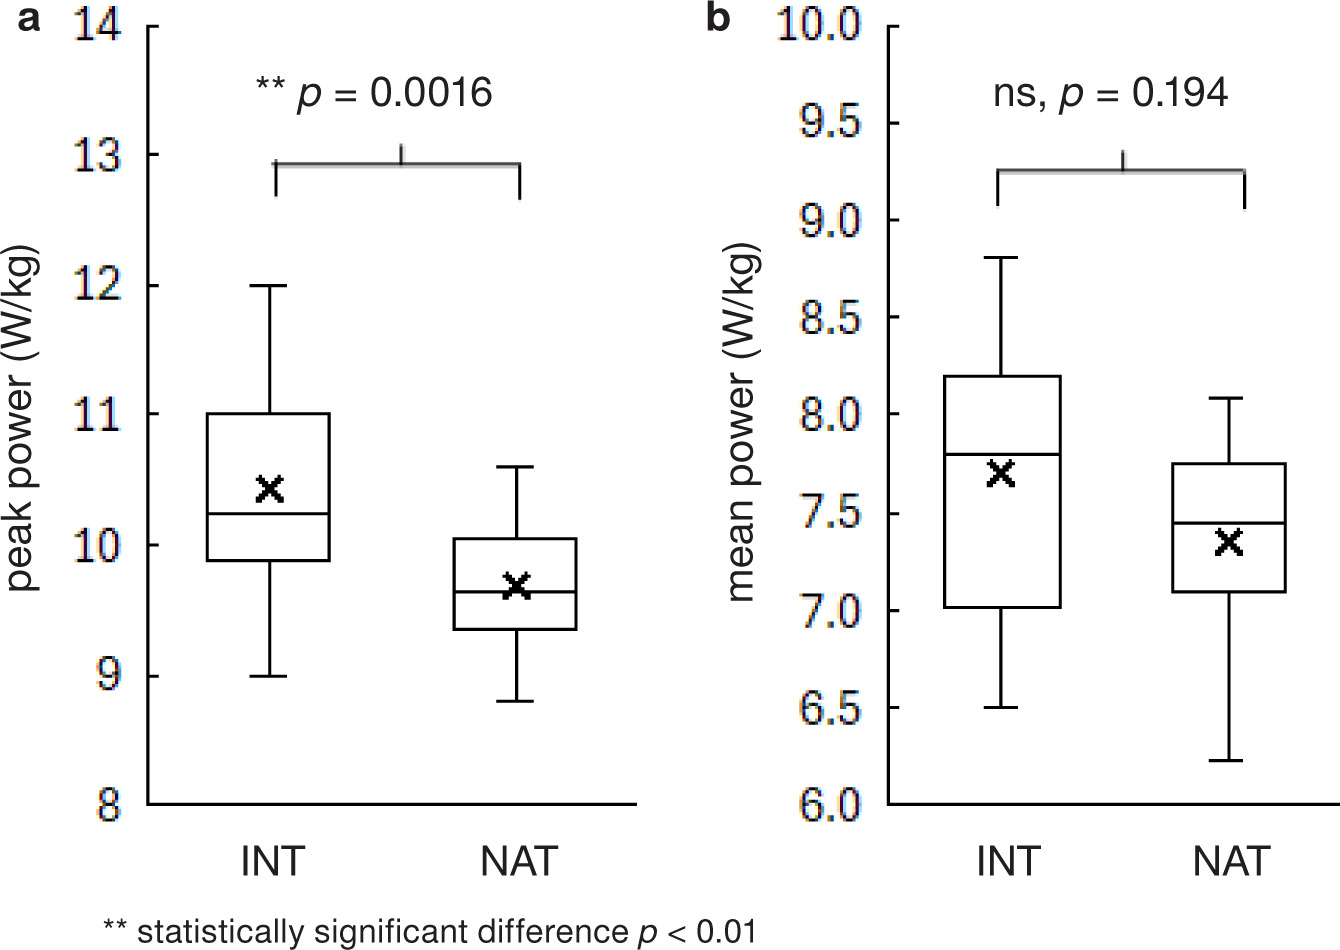
Figure 2
Maximal oxygen consumption from spiroergometry. Box plots illustrate dataset distribution for maximal oxygen consumption (VO2max) during the spiroergometry test for the international group (INT) and national group (NAT). The box spans from the first quartile (Q1) to the third quartile (Q3). Median is indicated by a horizontal line within the box. Crosses mark the means. Whiskers extend to the minimum and maximum non-outlier values. Outliers are displayed as individual points outside the whiskers.
Lactate accumulation
The maximal lactate concentrations (LAmax) after the Wingate upper arm test were not significantly different between the groups, with the international kayakers recording 12.26 ± 2.05 mmol/l and the national kayakers 11.30 ± 2.31 mmol/l (p = 0.470). The concentration of lactate at the 3rd minute after spiroergometry (LA3 ) reached 10.8 ± 2.36 mmol/l for the international kayakers and 12.1 ± 3.37 mmol/l for the national kay-akers, with no statistical significance between the groups. Interestingly, there is a different trend in lac-tate production between the tests in each group. The international group had a significantly higher blood lactate concentration after the Wingate test in comparison to the spiroergometry (p = 0.008), while no difference was observed in the national group (p = 0.338) (Figure 3).
Correlation between anaerobic capacity and lactate accumulation
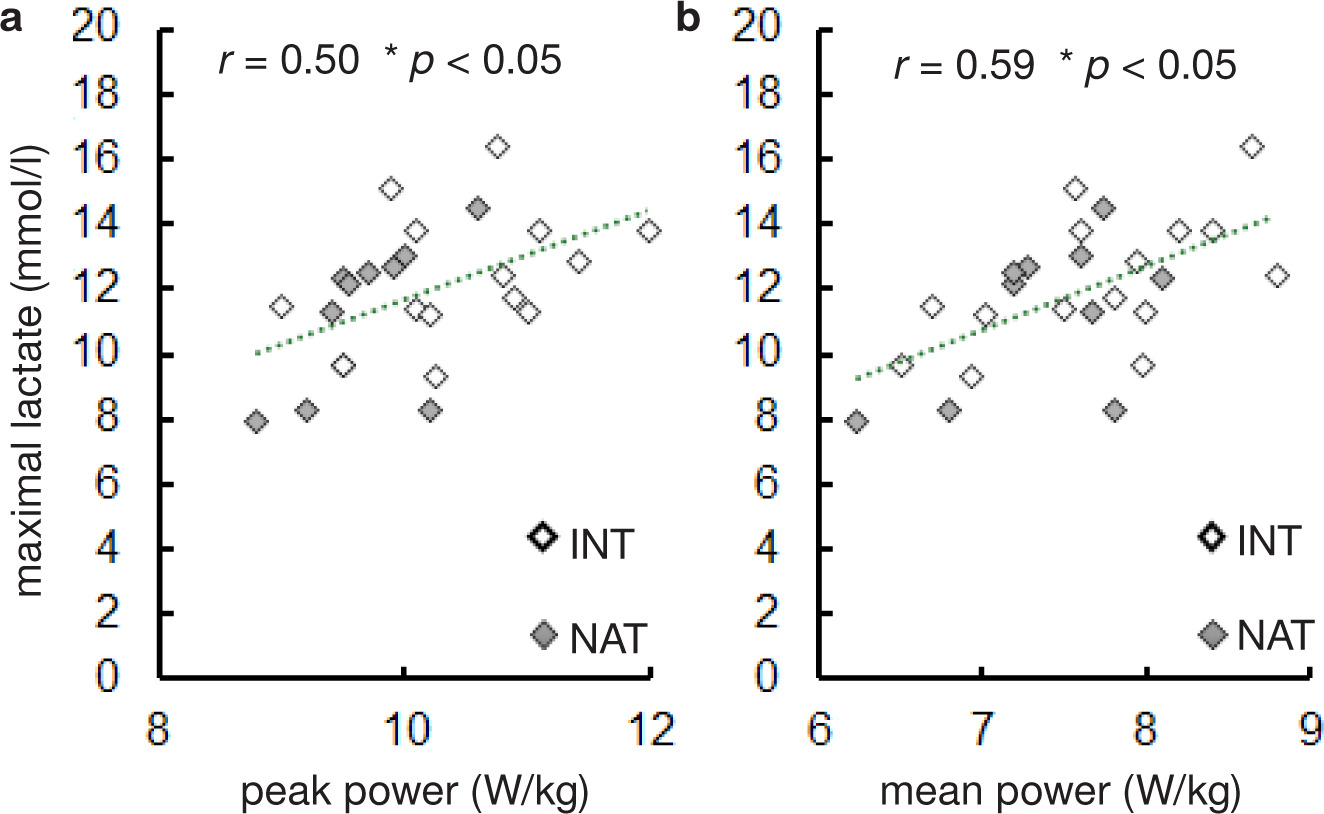
Our study also aimed to investigate the relationship between performance parameters and lactate accumulation in elite kayaking. Therefore, we conducted a correlation analysis between the PP and MP from the Wingate test and the maximum lactate concentration measured post-test across all data (Figure 4). Our results demonstrate statistically significant correlations between the maximum lactate concentration (LAmax) obtained following the Wingate test and key performance parameters. Specifically, there is a moderately positive correlation between LAmax and MP (Pearson correlation coefficient, r = 0.50, p < 0.05) and between LAmax and PP (r = 0.59, p < 0.05) (Figure 4). These findings indicate that higher performance levels, as assessed by the mean and peak power outputs, are associated with greater lactate production following high-intensity exercise. With the spiroergometry, the correlation between the VO2max and post-spiroergometry lactate concentration was not statistically significant (Pearson correlation coefficient, r = –0.2936, p = 0.154).
Figure 3
Comparison of the lactate concentration after the Wingate upper arm test and spiroergometry. Box plots illustrate dataset distribution for maximal lactate after the Wingate upper arms test (LAmax) and post-spiroergometry lactate concentration (LA3′) for international-level kayakers (a) and national-level kayakers (b). The boxes span from the first quartile (Q1) to the third quartile (Q3). Medians are indicated by horizontal lines within the boxes. Crosses mark the means. Whiskers extend to the minimum and maximum non-outlier values.
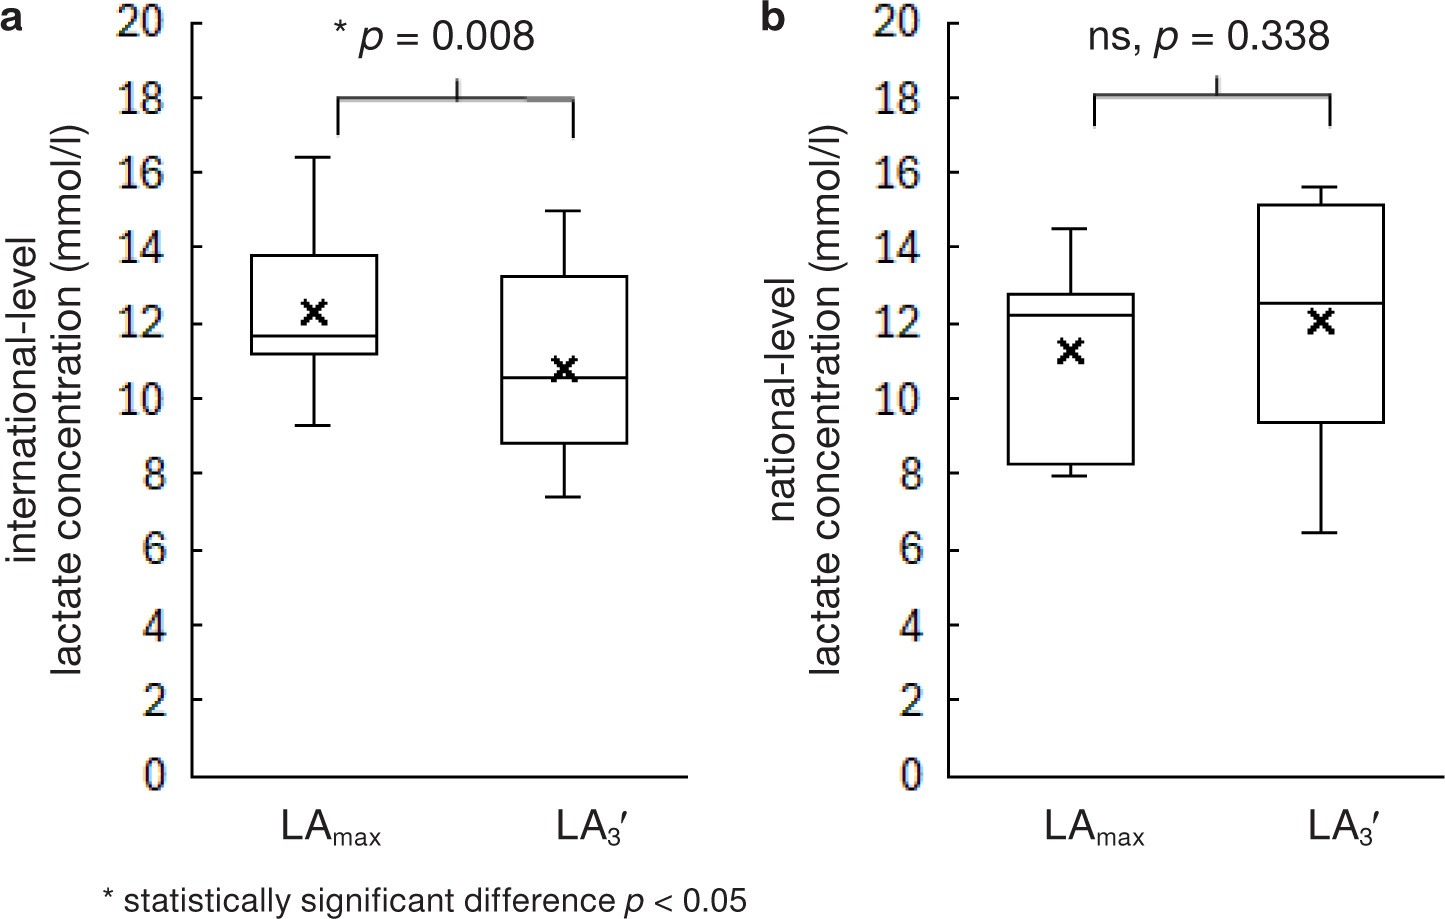
Figure 4
Correlations of performances in the Wingate upper arm test and maximal lactate concentrations. Scatter plots illustrate the relationship between peak power (a), mean power (b) and lactate max. Results for the international group are displayed in white (INT) and for the national group in grey (NAT). Pearson correlation coefficient (r) calculated from all data is displayed (n = 25) at the significance level p < 0.05. The dotted line represents the linear regression line for all data.
Discussion
The aim of our study was to examine anthropometric parameters, anaerobic capacity and aerobic capacity of elite kayakers competing at the international and national levels. To be specific, our study was focused on examining the relationship of these factors with performance in 500-m flat-water kayaking (K500 m). Previous studies involving male athletes suggest that a greater amount of muscle mass in the trunk and upper limbs is crucial for achieving high performance in paddling [19, 20]. Contrary to previous assumptions, this study did not reveal significant differences between the national and international kayakers in the sprint kayak discipline, as identified in the anthropometric measurements (Table 1). However, the above-mentioned studies involved either more long-distance kayakers or only national-level competitors. Also, in females, no significant correlation of anthropometric parameters with K500 m time was revealed [3]. This suggests that other factors beyond the basic body composition may be the key determinants for top performance at the international level.
In our study, kayakers at the international level achieved significantly higher PP during the Wingate upper arm test (Table 2, Figure 1a), suggesting that the ability to generate maximum power in a short time frame may be one of the key determinants for success in sprint disciplines. The differences in anaerobic capacity between the groups observed on male kayakers in our study align with the findings of a previous study by Bishop [3] conducted on female kayakers, which also emphasised the importance of anaerobic performance for success in competitions. Our study specifically focused on the 500-m distance, where a balance between anaerobic power and endurance is crucial. The aerobic contribution is estimated to be 60–70%, with the rest from the anaerobic contribution [3]. Interestingly, we did not find statistically significant differences in VO2max between the national and international athletes (Table 3, Figure 2). In line with this, a difference in maximal power output between a group of male kayakers specialising in short distances (200 m and 500 m) and a group specialising in the 1000-m distance was demonstrated by diachenko et al. [4]. However, those authors did not reveal any difference in VO2max/kg. Altogether, our current knowledge indicates that while aerobic capacity is important, it may not be the primary factor differentiating performance at shorter distances. Instead, other factors, such as the ability to sustain a high power output and effectively manage lactate accumulation, may play a more critical role [1, 5, 6].
Lactate plays a pivotal role in the metabolic response to high-intensity anaerobic exercise, particularly during short, maximal-effort activities such as the Win-gate test. This test results in significant lactate production and accumulation as a byproduct of anaerobic glycolysis. The ability to efficiently utilise glycolysis under these conditions is essential for sustaining energy output during high-intensity efforts [21]. Research suggests that athletes who can effectively manage lac-tate accumulation by optimising glycolytic pathways can sustain high-intensity efforts for longer durations [22]. Although no significant difference in the maximal lactate concentration after the Wingate upper arm test was detected between the two groups in this study, significant correlations between the maximum lactate concentration (LAmax) and performance parameters were observed (Figure 4). A moderately positive correlation was found between LAmax and PP, and between LAmax and MP. Comparison of the lactate concentrations after the Wingate test and post-spiroergometry revealed a significantly higher mean value of LAmax only for the international group (Figure 3). These findings suggest that higher performance levels, as assessed by the mean and peak power outputs, are associated with greater lactate production following high-intensity exercise. The statistically significant correlations and differences highlight the importance of the ability to effectively use glycolytic metabolism and manage lactate accumulation.
The ability to tolerate high blood lactate concentrations during anaerobic performance was also demonstrated in a study involving 400-m sprinters. The elite sprinters exhibited significantly higher peak blood lac-tate levels following two consecutive 30-second Win-gate tests compared to their sub-elite counterparts [23]. For training, this means finding the balance between aerobic and anaerobic activities [3]. Previous research [9] showed that high-intensity interval training (HIIT) significantly improved time-test performance over 200 m and maximal speed at the lactate threshold in comparison to continuous training. Paquette et al. [24] showed that HIIT revealed greater improvements in 200-m, 500-m and 1000-m distances in comparison to sprint interval training (SIT).
Conclusions
This study is one of the first to compare the aerobic and anaerobic components of kayaking performance in a larger cohort of elite kayakers using a specialised Wingate device to measure maximal anaerobic upper arm power in a laboratory setting. The results of this study revealed significant differences in the performance characteristics of 500-m kayakers competing at the international and national levels. While no differences in body composition or aerobic capacity (VO2max) between the groups were determined, the ability to generate maximum power during short duration efforts appears to be decisive for top performance in international-level competitions. Furthermore, this study suggests that VO2max may not be the crucial factor for peak performance in shorter kayaking distances. The findings are valuable for coaches and sports scientists in optimising training programs for 500-m kayakers at all levels of competition. The study also highlights the need for further research to deeper understand the key factors contributing to success on the international stage in flat-water kayaking.
Limitations
The limitations of this study include several factors that may affect the generalisability and interpretation of the results. Although we tested the entire top-performing Czech kayaking elite, a larger sample size would have provided more robust and precise conclusions. The study would also benefit from having an equal number of national and international participants to provide a clearer analysis of the differences between these groups.
Another possible limitation is that the tests were performed in a single session. Although there was a sufficient 2-hour recovery period between tests to allow the body to recover from the Wingate test, the residual lactate concentration could have affected the performance in the spiroergometry. However, the conditions were the same for all participants, and kayakers are used to completing several race runs on a typical race day.