Introduction
Various time-limited race formats exist in ultra-marathon running, such as 6, 12, 24, 48, and 72 hours, as well as six and 10 days [1]. the 12-hour race, being the second shortest time-limited race, seems to have low scientific interest, with only a few studies published on topics such as changes in body composition [2] and urine output [3] during the marathon, sex differences in performance [4, 5], runner origin [6], and peak performance age [7].
With the development of statistical models, various approaches have been used to answer new research questions in sports science. Among the different topics of interest, one main focus is performance trends [5, 8]. Performance trends refer to the changes in velocity/ speed experienced by athletes over the years and can be explored by considering their country’s characteristics, sex, age groups, or the location of the competition [9].
Numerous variables that predict ultra-marathon performance have been identified [10]. Previous experience, such as the number of finishes in ultra-marathon races and personal best time, have been reported as the most important predictors of a successful ultra-marathon performance [10]. other factors, such as specific anthropometric (e.g., low body mass index [BMI] and low body fat) and training (e.g., high volume and running speed during training) characteristics, also seemed to predict performance [10]. However, information on the fastest race courses is missing, though it could be valuable to ultra-marathoners who spend time and money training and participating in competitions at various locations globally.
One study investigating the origin of the fastest runners in the 12-hour race used a relatively short time frame and a small data set and reported that most of the participants originated from Europe, and European runners dominated this race format [6]. Since we do not know the fastest race courses in the 12-hour format, the present investigated the origin of the fastest 12-hour ultra-marathoners and the location of the fastest 12-hour events.
The study used a machine learning (ML) algorithm (eXtreme Gradient Boosting [XG Boost]) that typically attains the optimal trade-off between accuracy and computing time (for both training and inference). In addition, XG Boost provides full support for graphics processing unit (GPU) computation, which is of paramount importance with large datasets, and it fully supports some of the model interpretability libraries used in research activities, for instance, the SHaplex Additive exPlanations (SHAP) and partial dependence plot (PDP) libraries. the primary advantage of these ML models over simpler approaches, such as a multivariable linear regression (MLR), is their ability to model non-linear dependencies between targets and predictors [11]. Furthermore, this approach has been used in recent studies [12-15]. Based on recent findings, we hypothesised that the fastest runners would be from Europe and that the fastest race courses would also be in European countries.
Material and method
Data analysis
Data download
Race data was downloaded from the Deutsche Ultramarathon Vereinigung (DUV) website [16] using a Python script. Each race record included the name of the runner, age group, sex, country of origin, race location, year, race length (duration), and the athlete’s achieved distance (km).
Data pre-processing
The data was checked for consistency, removing incomplete or flawed records. The countries of origin and event were ranked by the number of race records, for which the data set was aggregated by the values in the athlete country column (or event country column) and then sorted by participation (i.e., number of records). In both cases, race (running) speed descriptive statistics [mean, standard deviation (SD), max, and min] and the number of unique runners were presented for each country. Race records from athletes or event countries with less than 10 entries were removed to reduce noise and obtain representative results. While these measures allow for straightforward interpretation of the results, we must acknowledge that, in doing so, some countries/runners might have been unwittingly omitted.
XG Boost regression model
The XG Boost regression model used the Athlete_ sex_ID, Age_group_ID, Athlete_country_ID, and Event_ country_ID variables as predictors or inputs. The predicted variable, or algorithm output, was race (running) speed (km/h). Before the XG Boost model could be trained, the predictor values were converted (encoded) into numerical data. The athlete sex variable was encoded as women = 0 and men = 1. The age group variable was already numerically encoded into five-year groups, except group 18, which represents runners under 20, and group 75, which represents 75 years and older. The athlete country and event country variables were encoded based on their position in the respective ranking tables, with the countries with the highest participation ranked first. Two evaluation metrics, mean absolute error (MAE) and the coefficient of determination R2), were calculated. A holdout evaluation strategy was used to tune the model by iterative training and evaluating instances with different test splits and numbers of estimators/learning rates. The best score (in-sample test) achieved by the simulation was r2 = 0.34. Meanwhile, MAE = 1.21 km/h, with 500 estimators (learners or trees) and a 0.5 learning rate.
Model interpretation
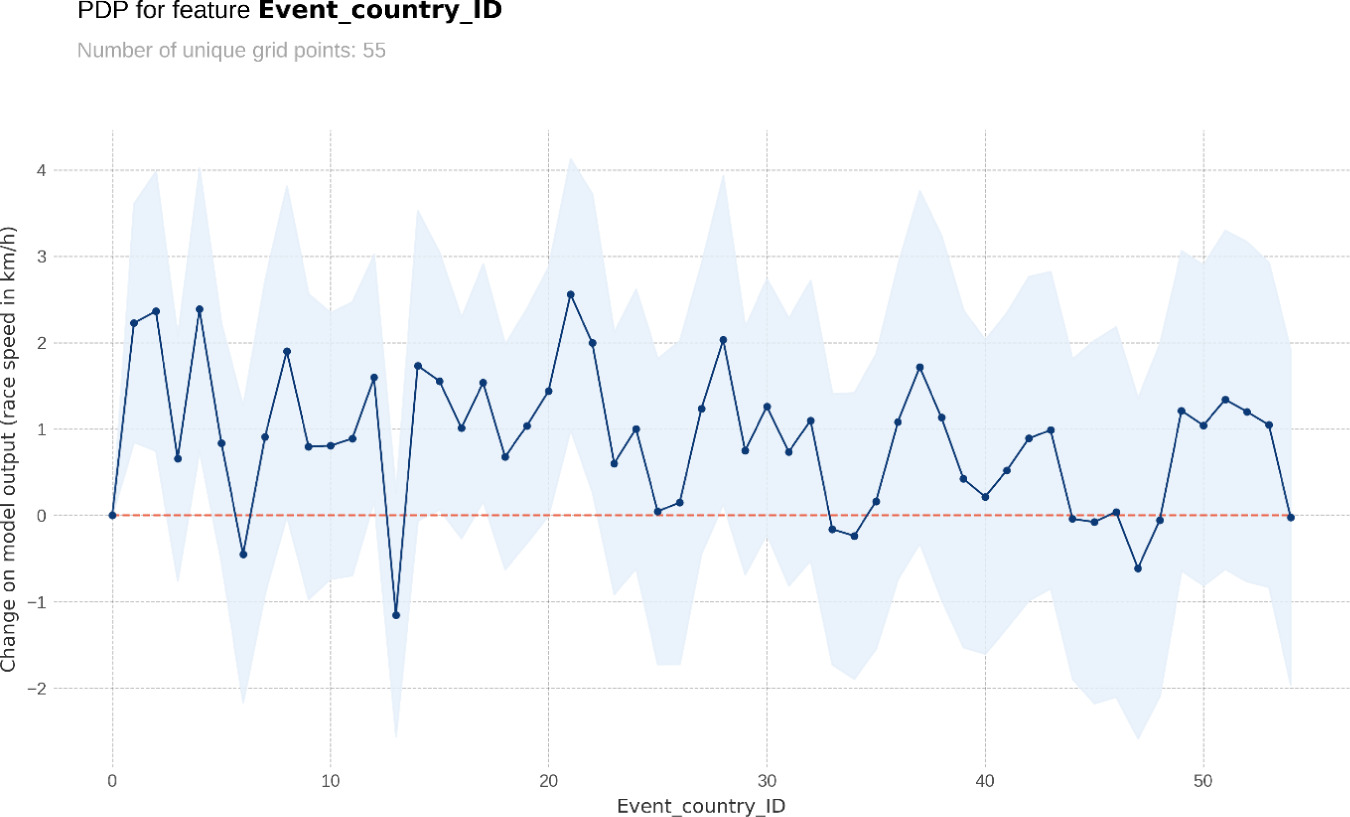
While the evaluation metrics give a view of the model’s predictive performance, more advanced tools provide a look inside the model for associations between the predictors and target variables. Among these tools, the PDP library plots relative and absolute prediction distribution charts, along with the mean values and group sizes. The PDP plot shows the relative change in the model output for the different values of each predicting variable, with respect to a reference value (0), with prediction plots showing the range of outputs for each predictor using boxplots. Model feature relative importance was also computed. Pearson’s and Spearman’s correlations were displayed in correlation matrices to investigate the correlation between model variables.
All computations and analysis employed Jupyter Notebook (Google Colab) and Python, along with associated libraries (Pandas, NumPy, XG Boost, PDPbox, sklearn, Matplotlib, and sns).
Results
After all necessary processing, the final 12-hour race sample used to compute the country rankings consisted of 103,334 race records of 53,700 unique runners from 69 countries who participated in races held in 55 countries.
Country rankings by number of race records and unique runners
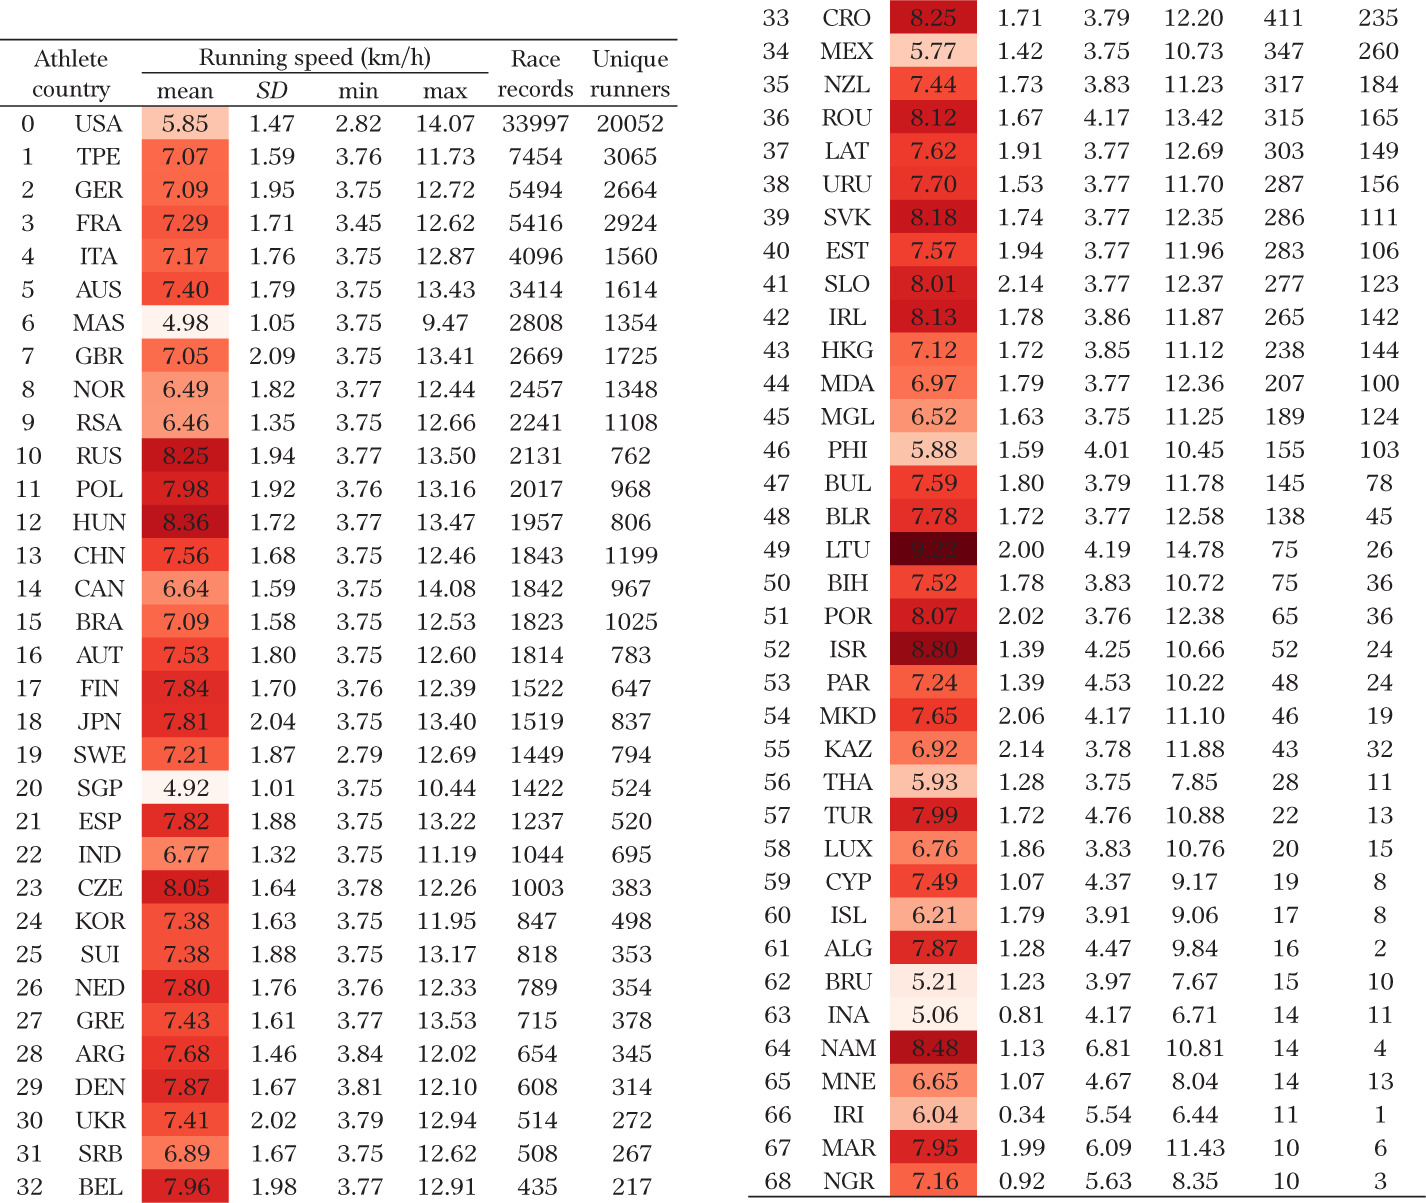
Table 1 summarises the race records by the 69 countries of origin of the athletes and lists the countries by the number of recorded race results. Mean running speed is colour-coded, where darker colours correspond to faster running speeds. The United States of America (USA) accounted for about one-third of race records in terms of country of origin and country of the event, followed by Taiwan and some European countries, such as Germany, France, Italy, and Norway. other nations highlighted included those of the Anglosphere, such as Australia, the United Kingdom (UK), and South Africa. the fastest average running speeds were achieved by athletes from Lithuania, Israel, Russia, Hungary, Croatia, and Namibia (the latter had 14 records from four unique runners).
Event country ranking table
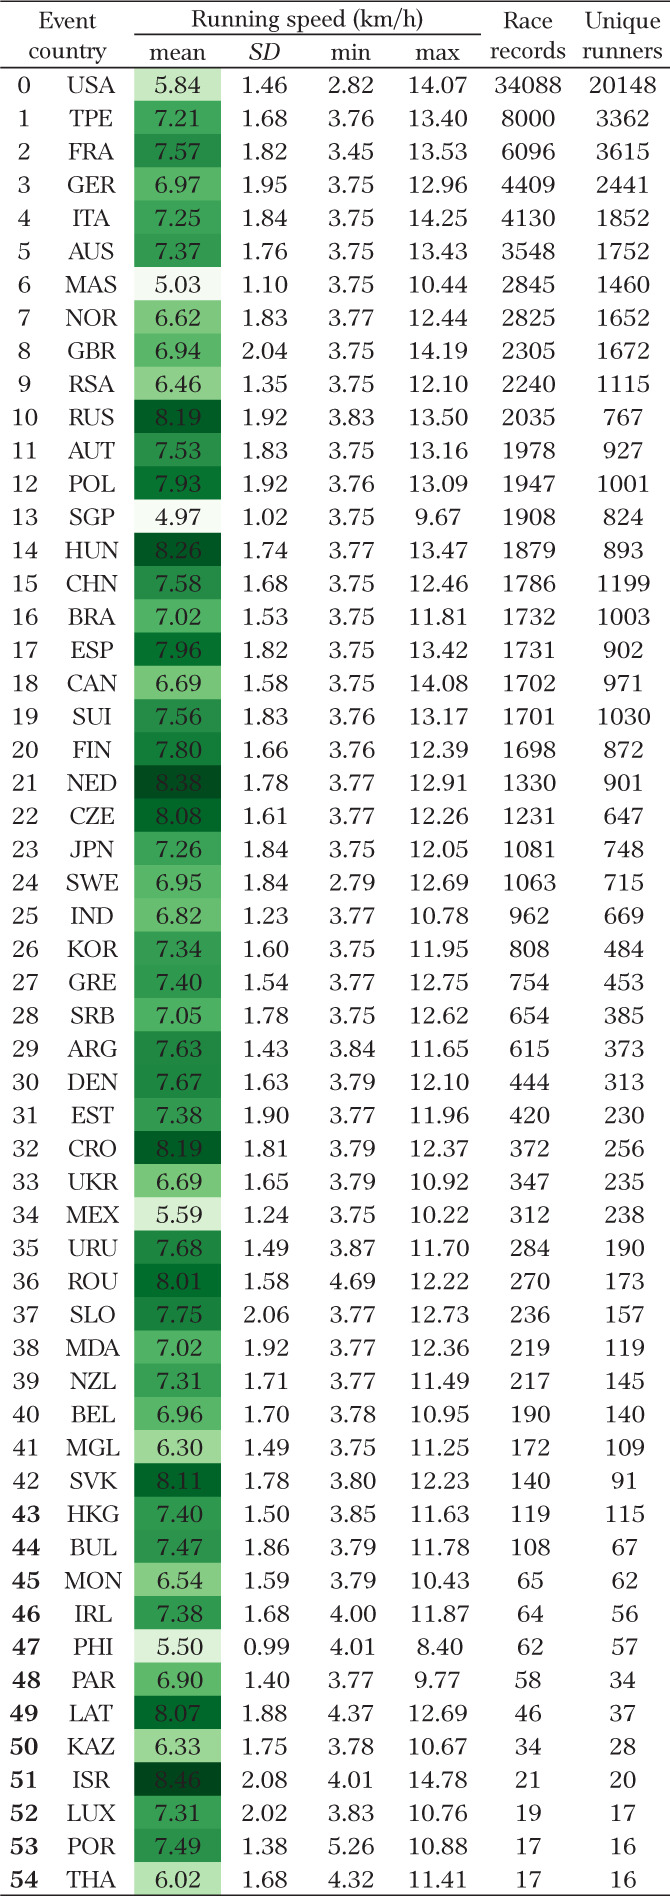
Table 2 summarises the events for the 55 different countries and lists the countries by the number of recorded race results. Mean running speed is colour-coded, where darker colours correspond to faster running speeds. the fastest running speeds were achieved in races held in Russia, the Netherlands, Israel, Slovakia, the Czech Republic, Croatia, and Hungary.
Correlation between model variables
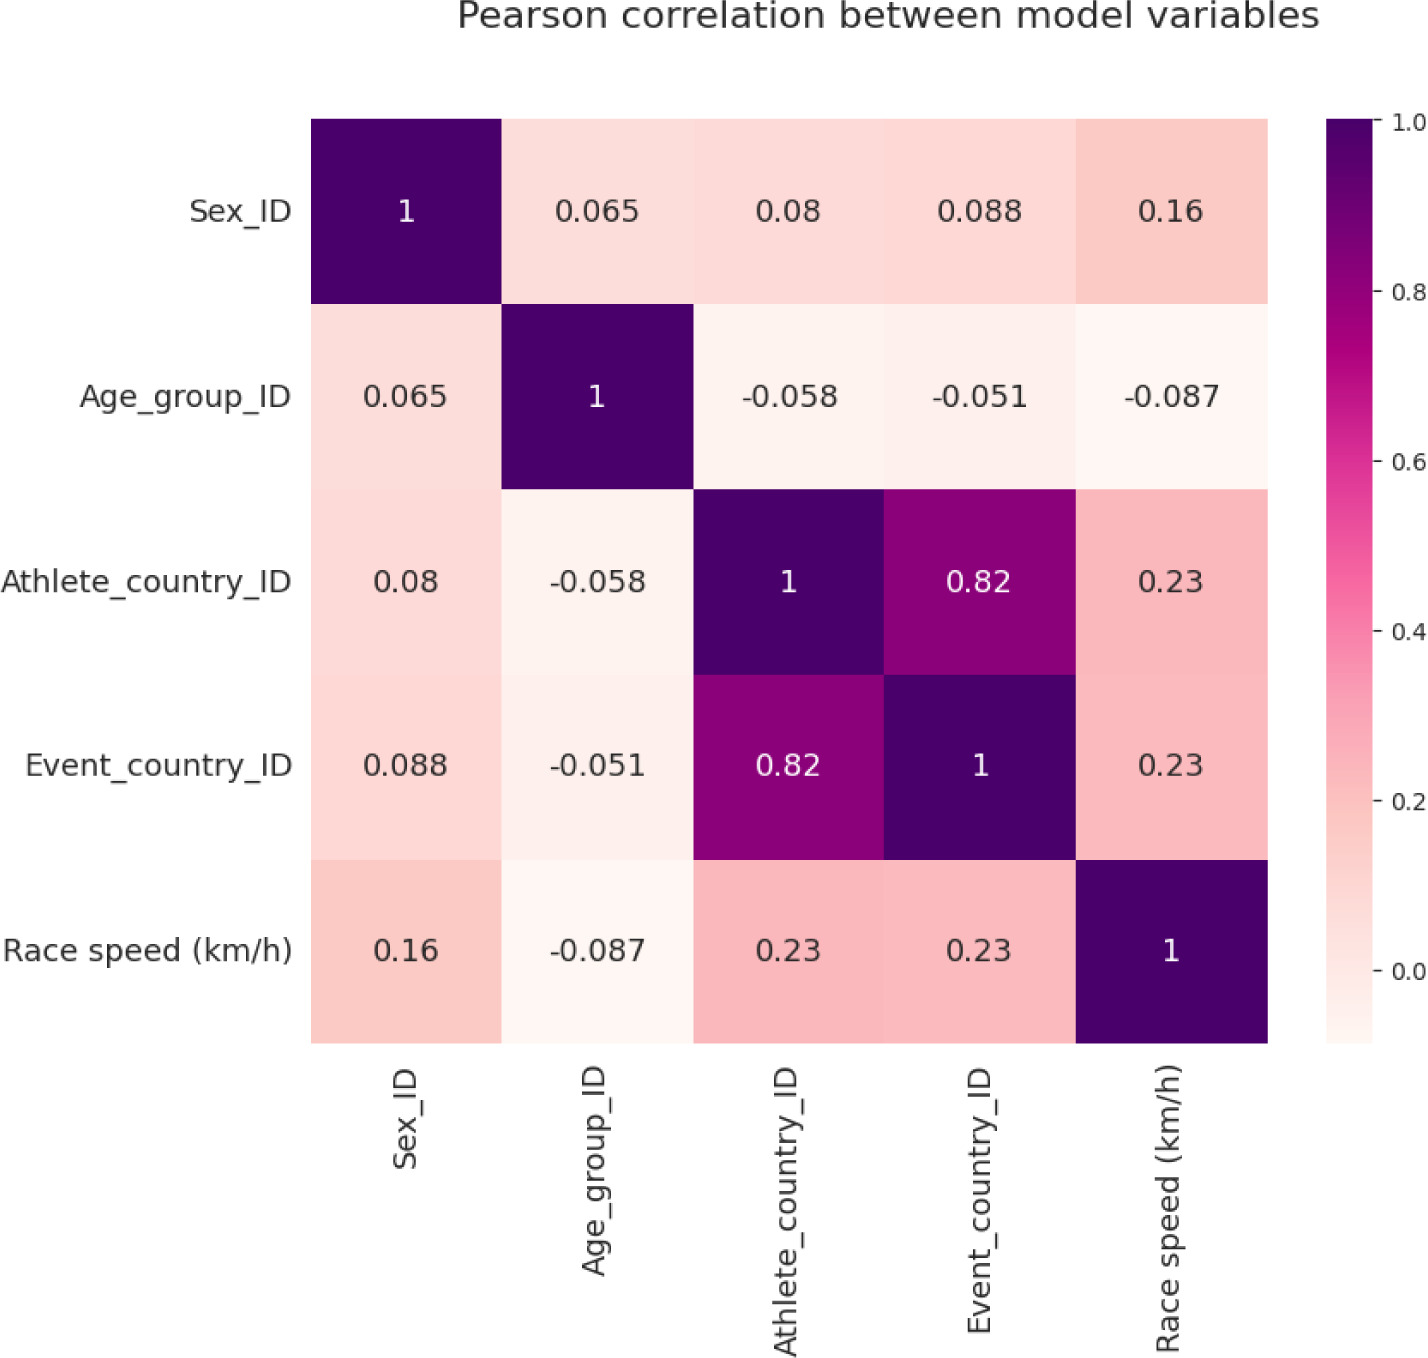
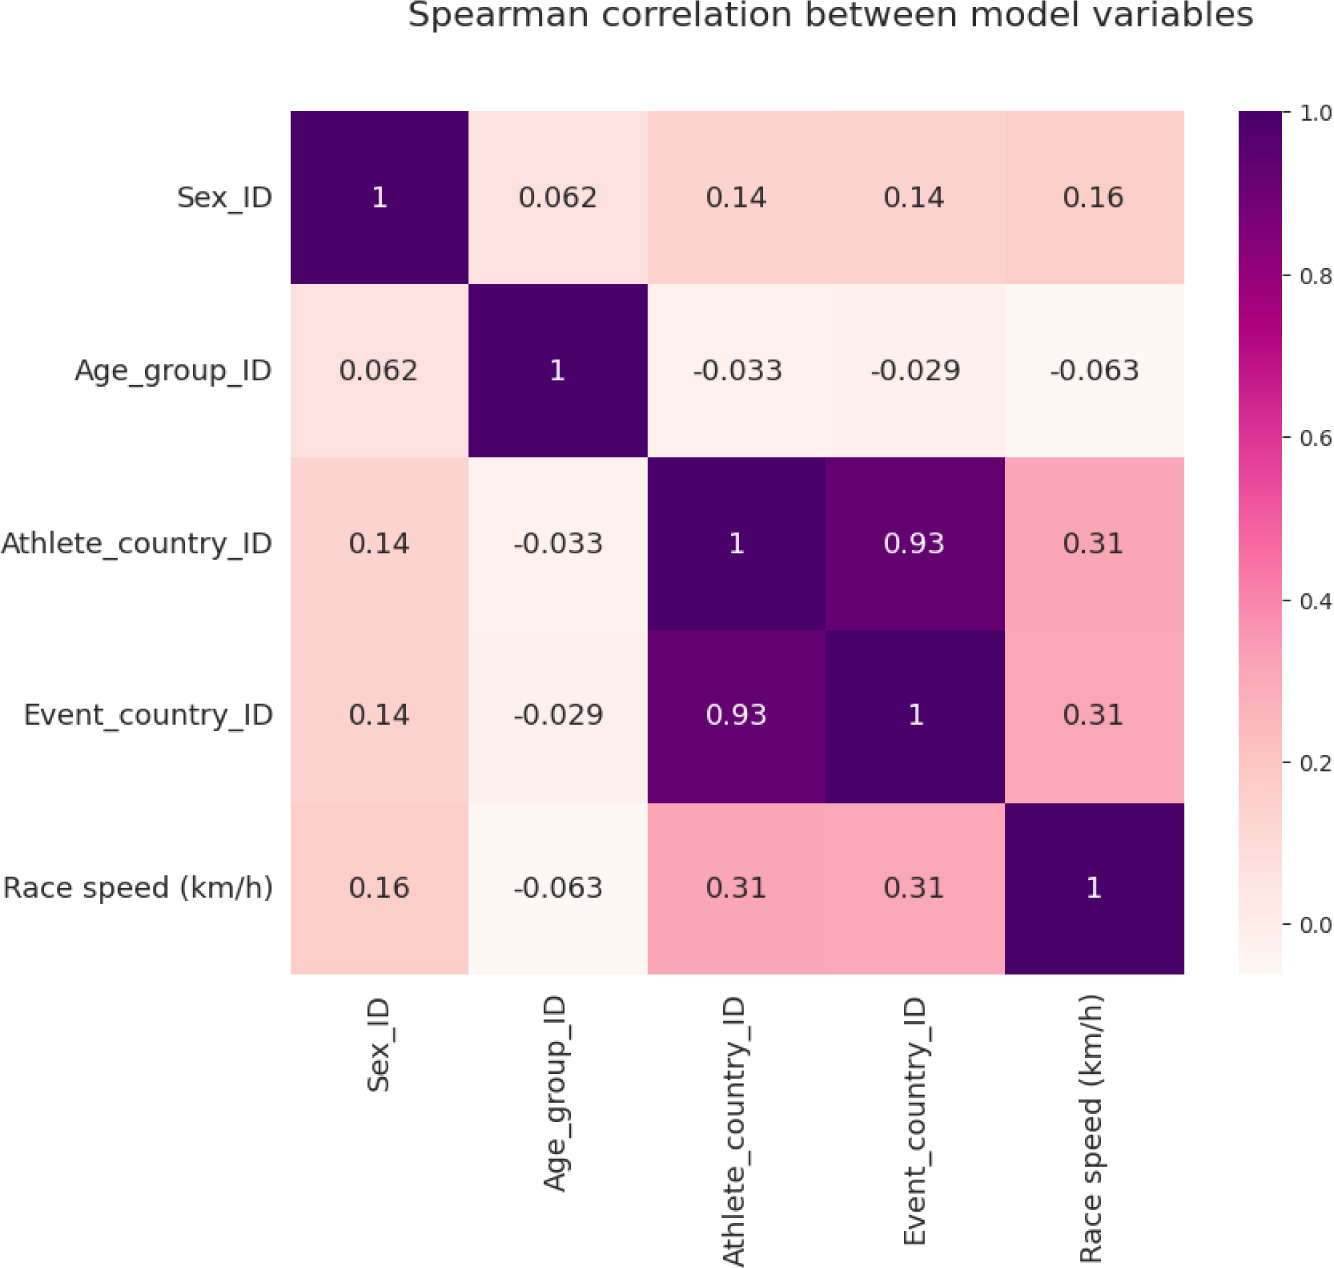
To investigate a potential correlation between the country of origin of the athlete and the country where the races were held, we performed Pearson (Figure 1) and Spearman (Figure 2) correlations. Sex has a value of 0 for women and 1 for men. running speed showed a slight positive correlation with sex (hence faster speeds for 1’s). the age group consisted of sorted integers (18, 20, 25, 30, etc.) and the distribution followed an inverted U shape, so the correlations showed no simple linear pattern. An increasing Athlete_country_ID indicated only a minor representation in the sample for the country the ID represents, which was similar to the Event_country_ID. As such, care must be taken when interpreting the positive correlation (Pearson = 0.23 and Spearman = 0.31) between the country variables and running speed since a one-unit increase represents a 0.23 km/h (or 0.31 km/h by Spearman) increase in running speed. However, the unit increase in the country variable is meaningless as it only indicates a change of country. there were also positive correlations between sex and the country of origin and event. the highest correlation was between the countries of origin and countries of event, indicating that most runners competed in races in their country of origin.
XG Boost regression model
Evaluation metrics and feature relative importance
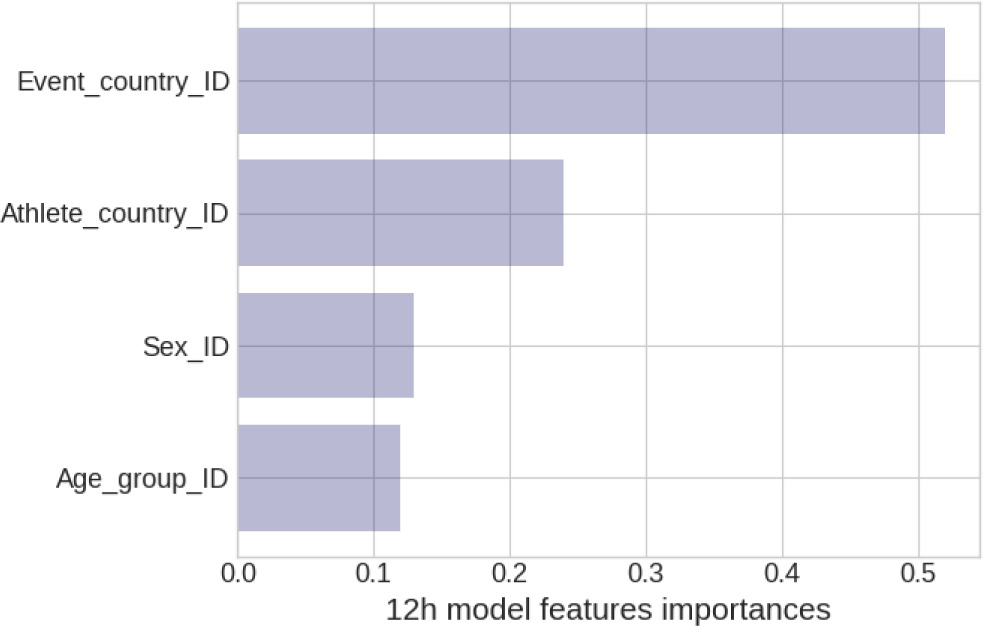
The model was trained and tested with all 103,334 records, with the accuracy (r2 = 0.34) indicating a moderately weak effect of the predictor variables in the model output and suggesting that additional predictor variables should be added to improve its predictive power. The country of the event was considered the most important predictor of performance (based on data entropy reduction), with a score of 52%, followed by the athlete’s country, sex, and age group (Figure 3).
Partial dependence plots
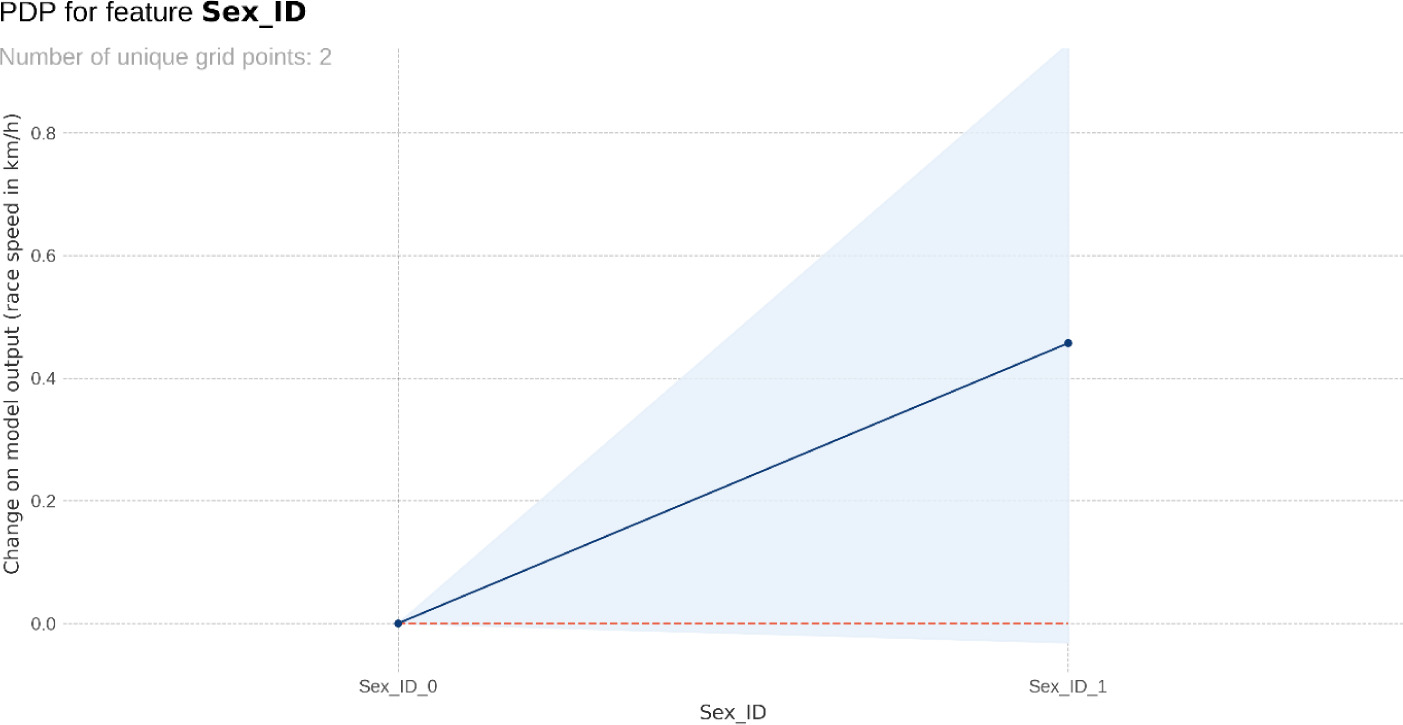
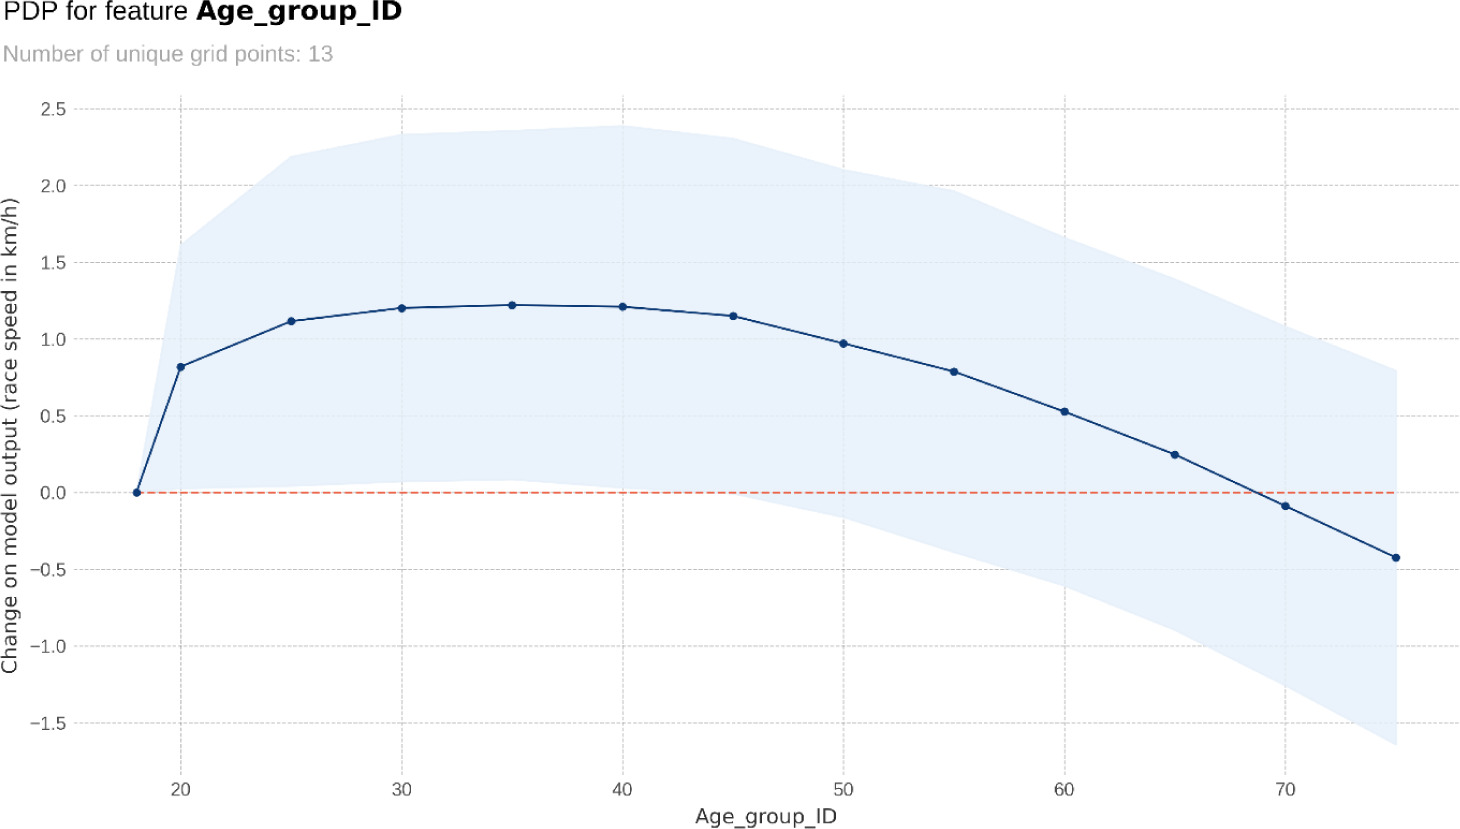
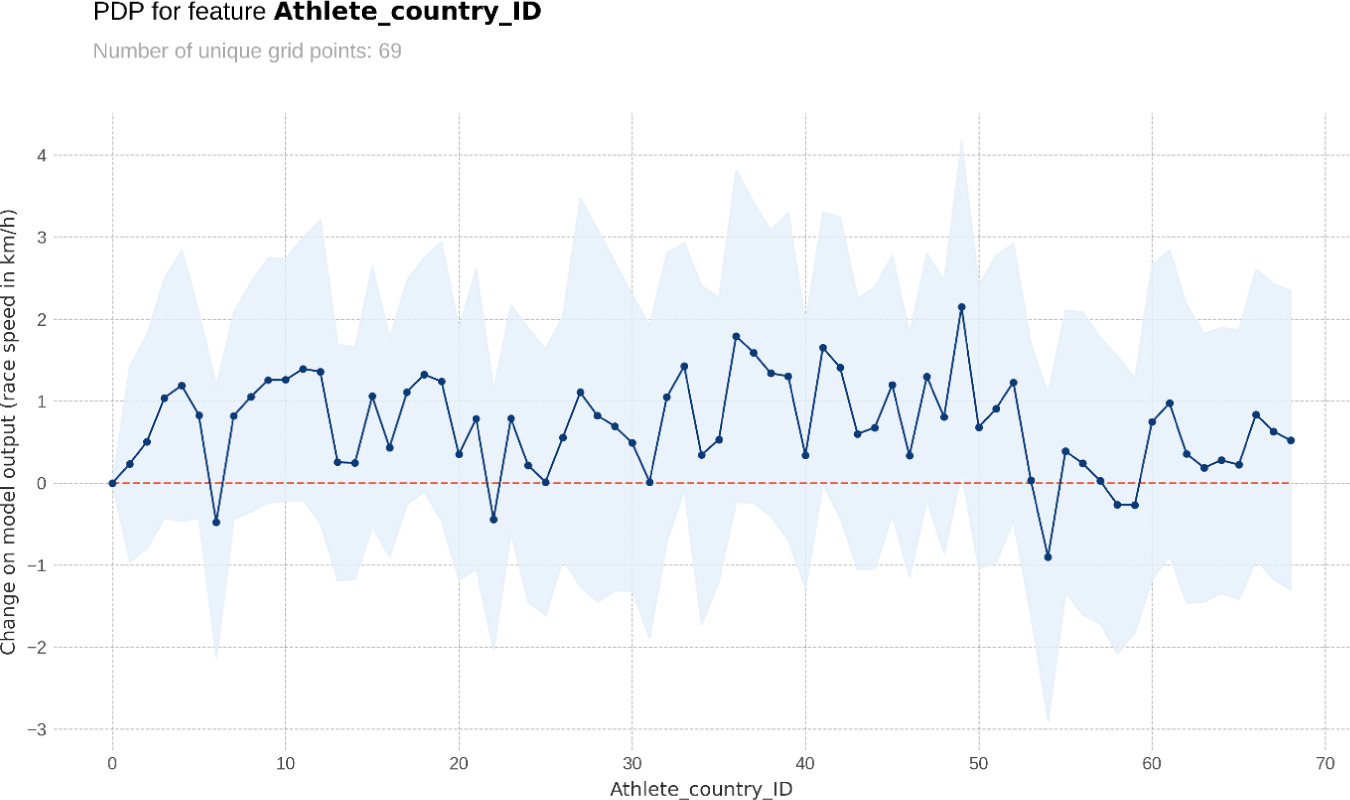
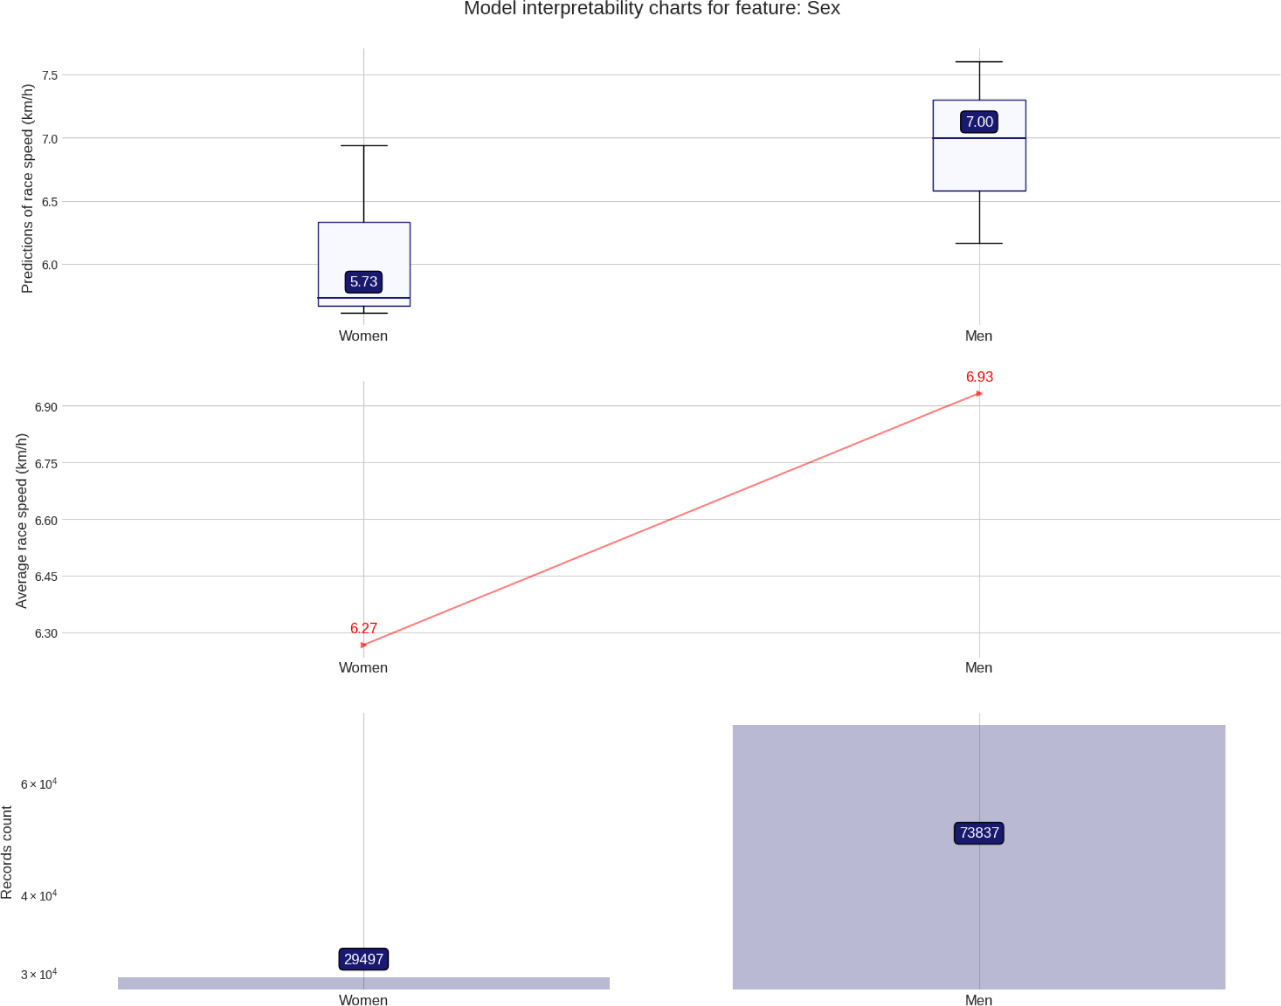
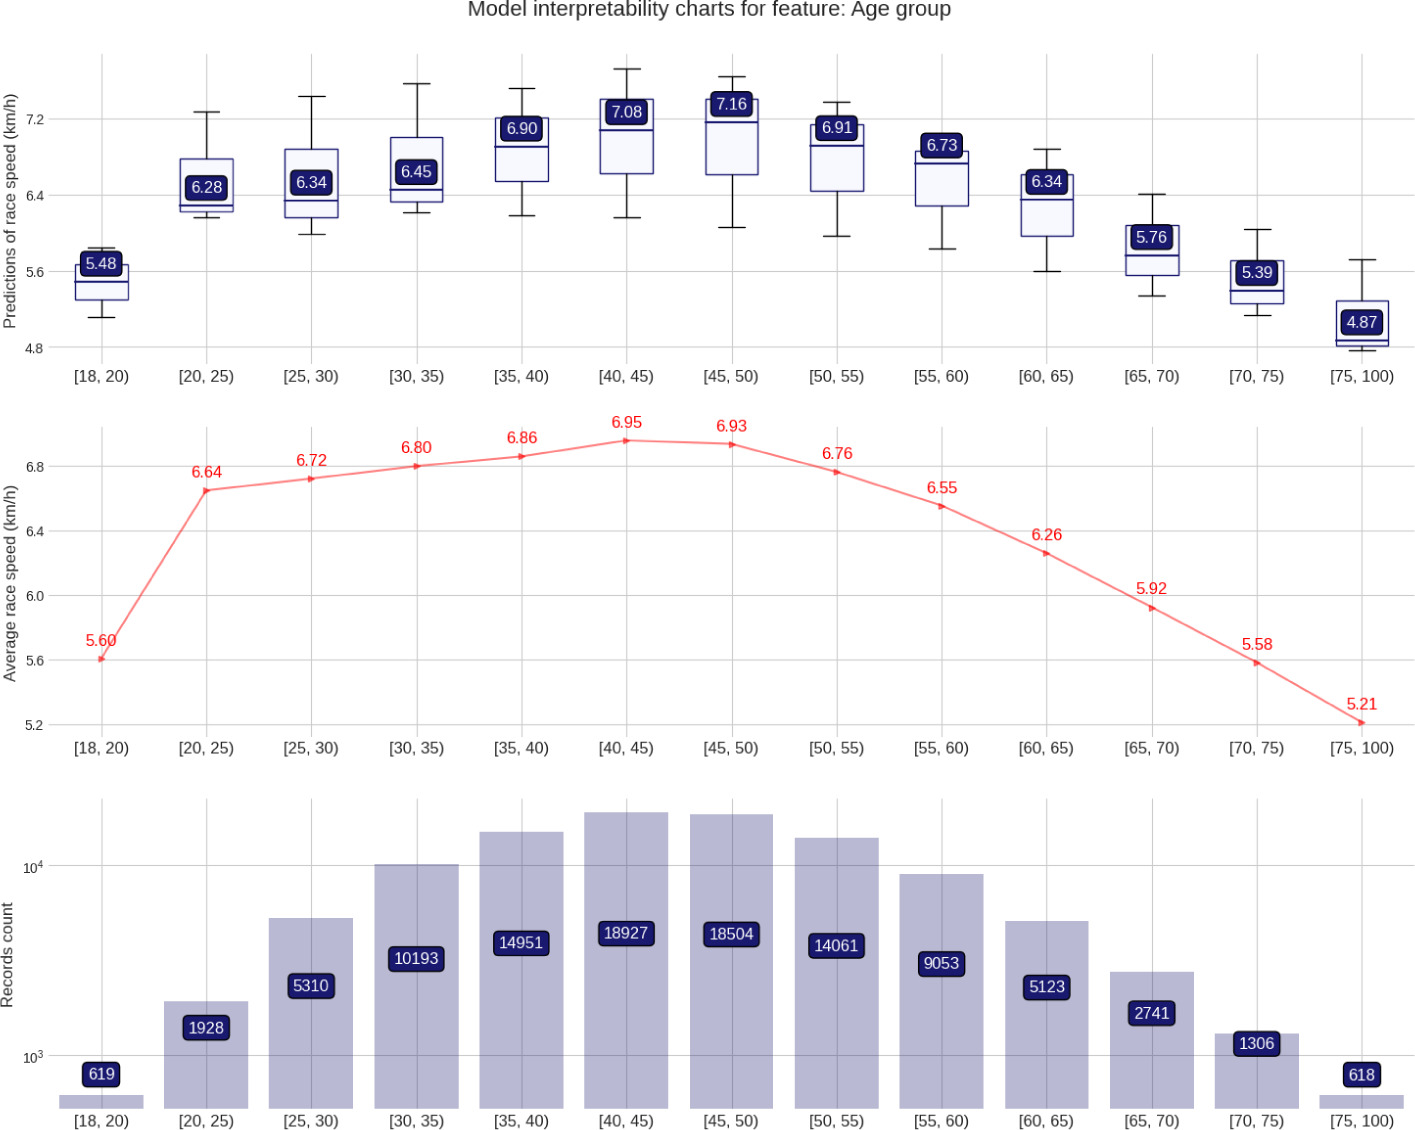
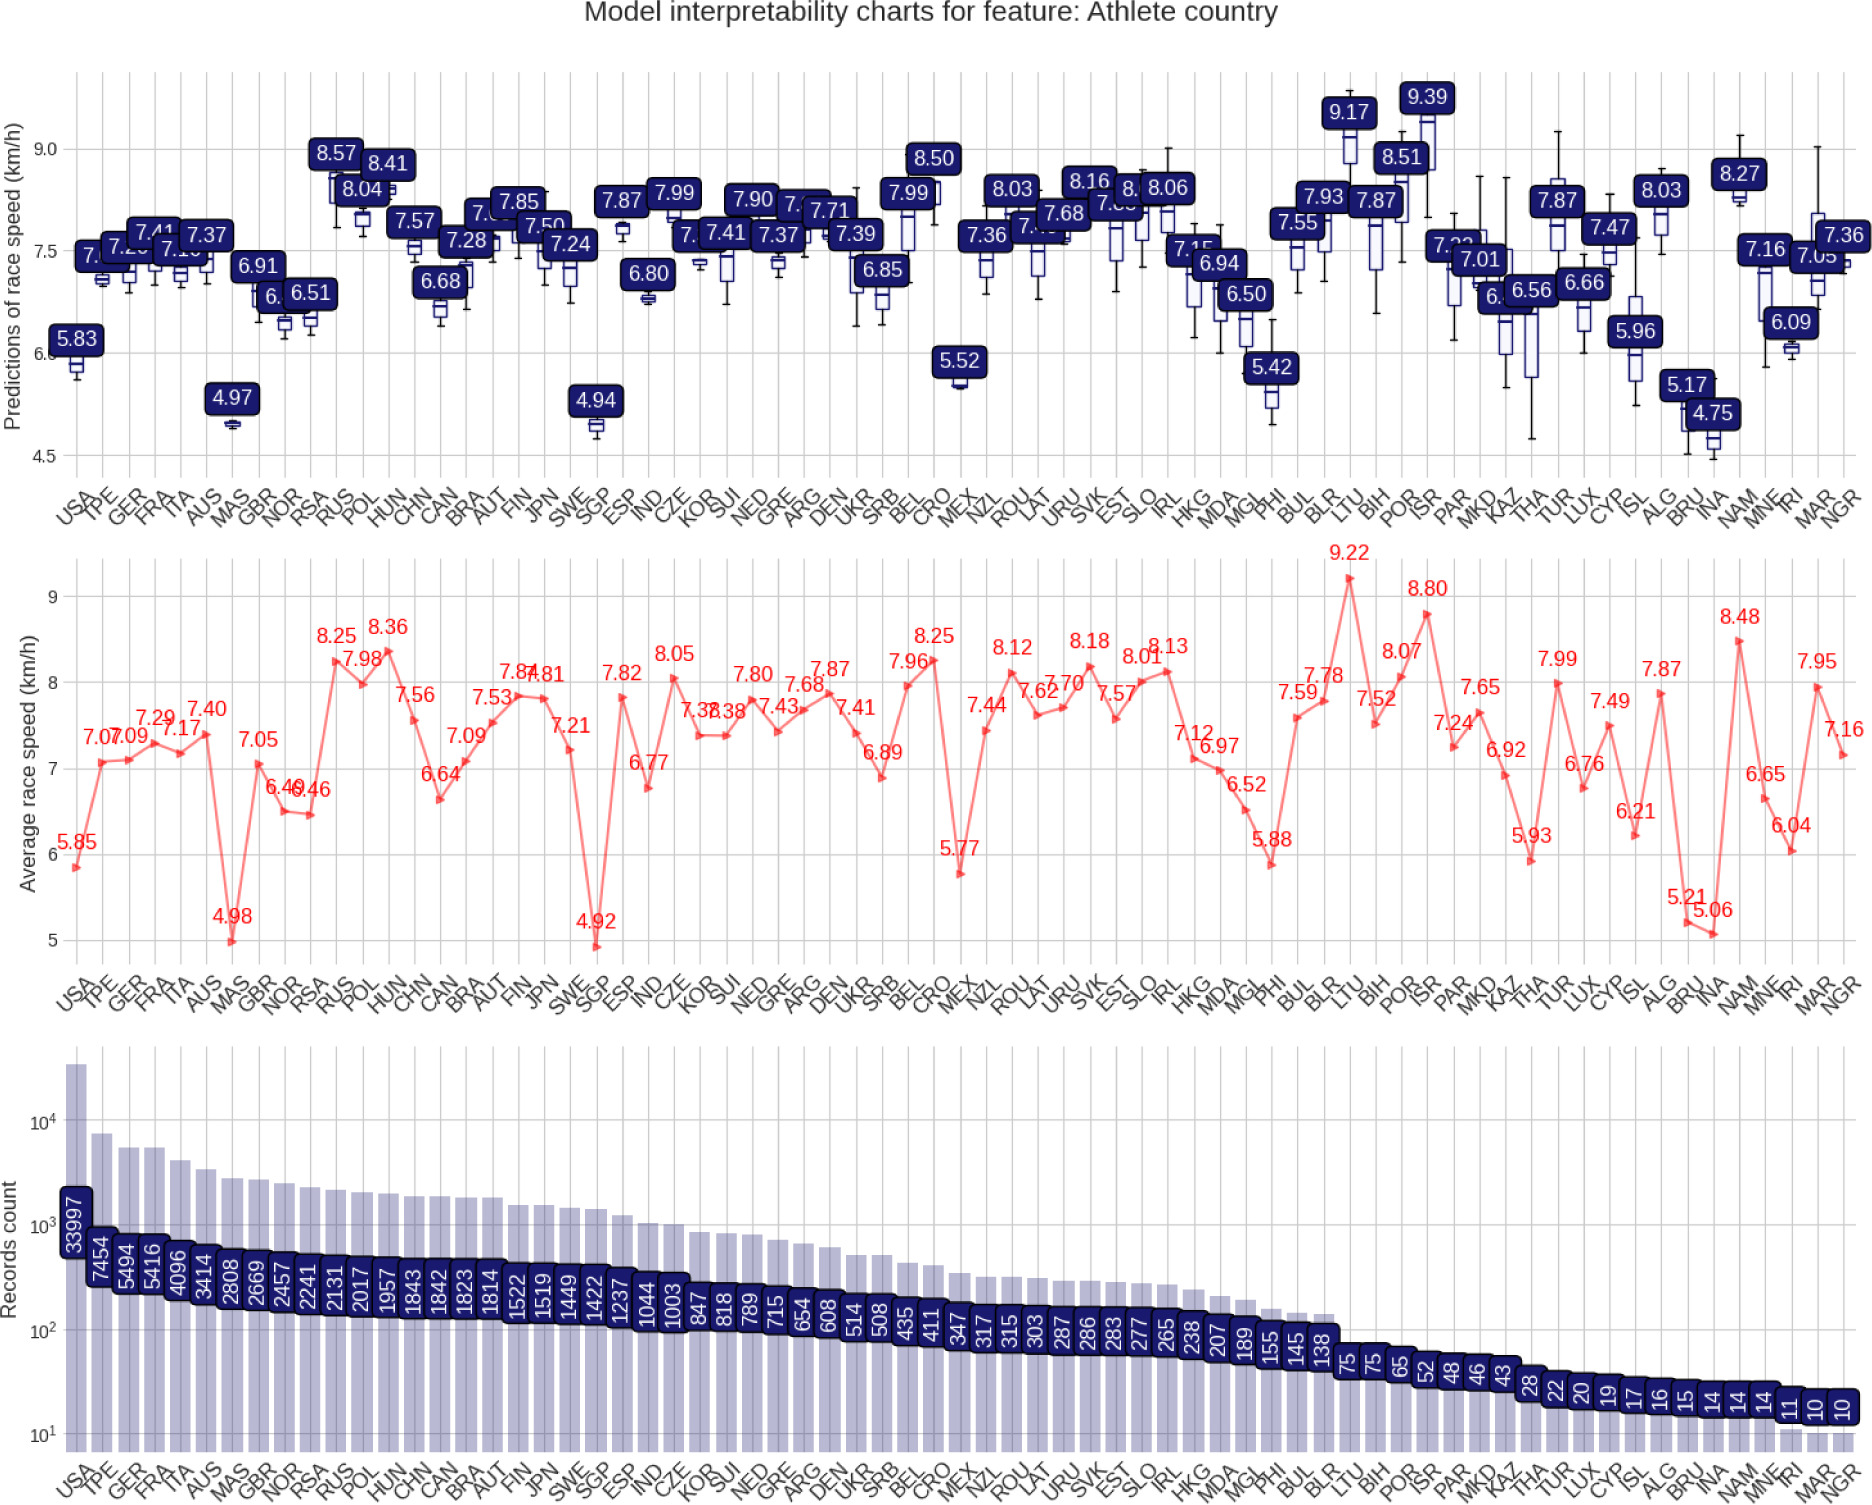
Regarding sex, men were ~0.45 km/h faster than women (Figure 4). The PDP for the 30-34, 35-39 and 40-44 age groups was flat, indicating a broad range of ages positively contributing to the best running speed predictions (Figure 5). The results by athlete country peaked at ID 49 (Lithuania) (Figure 6), while the results by event country peaked at ID 21 (The Netherlands) (Figure 7).
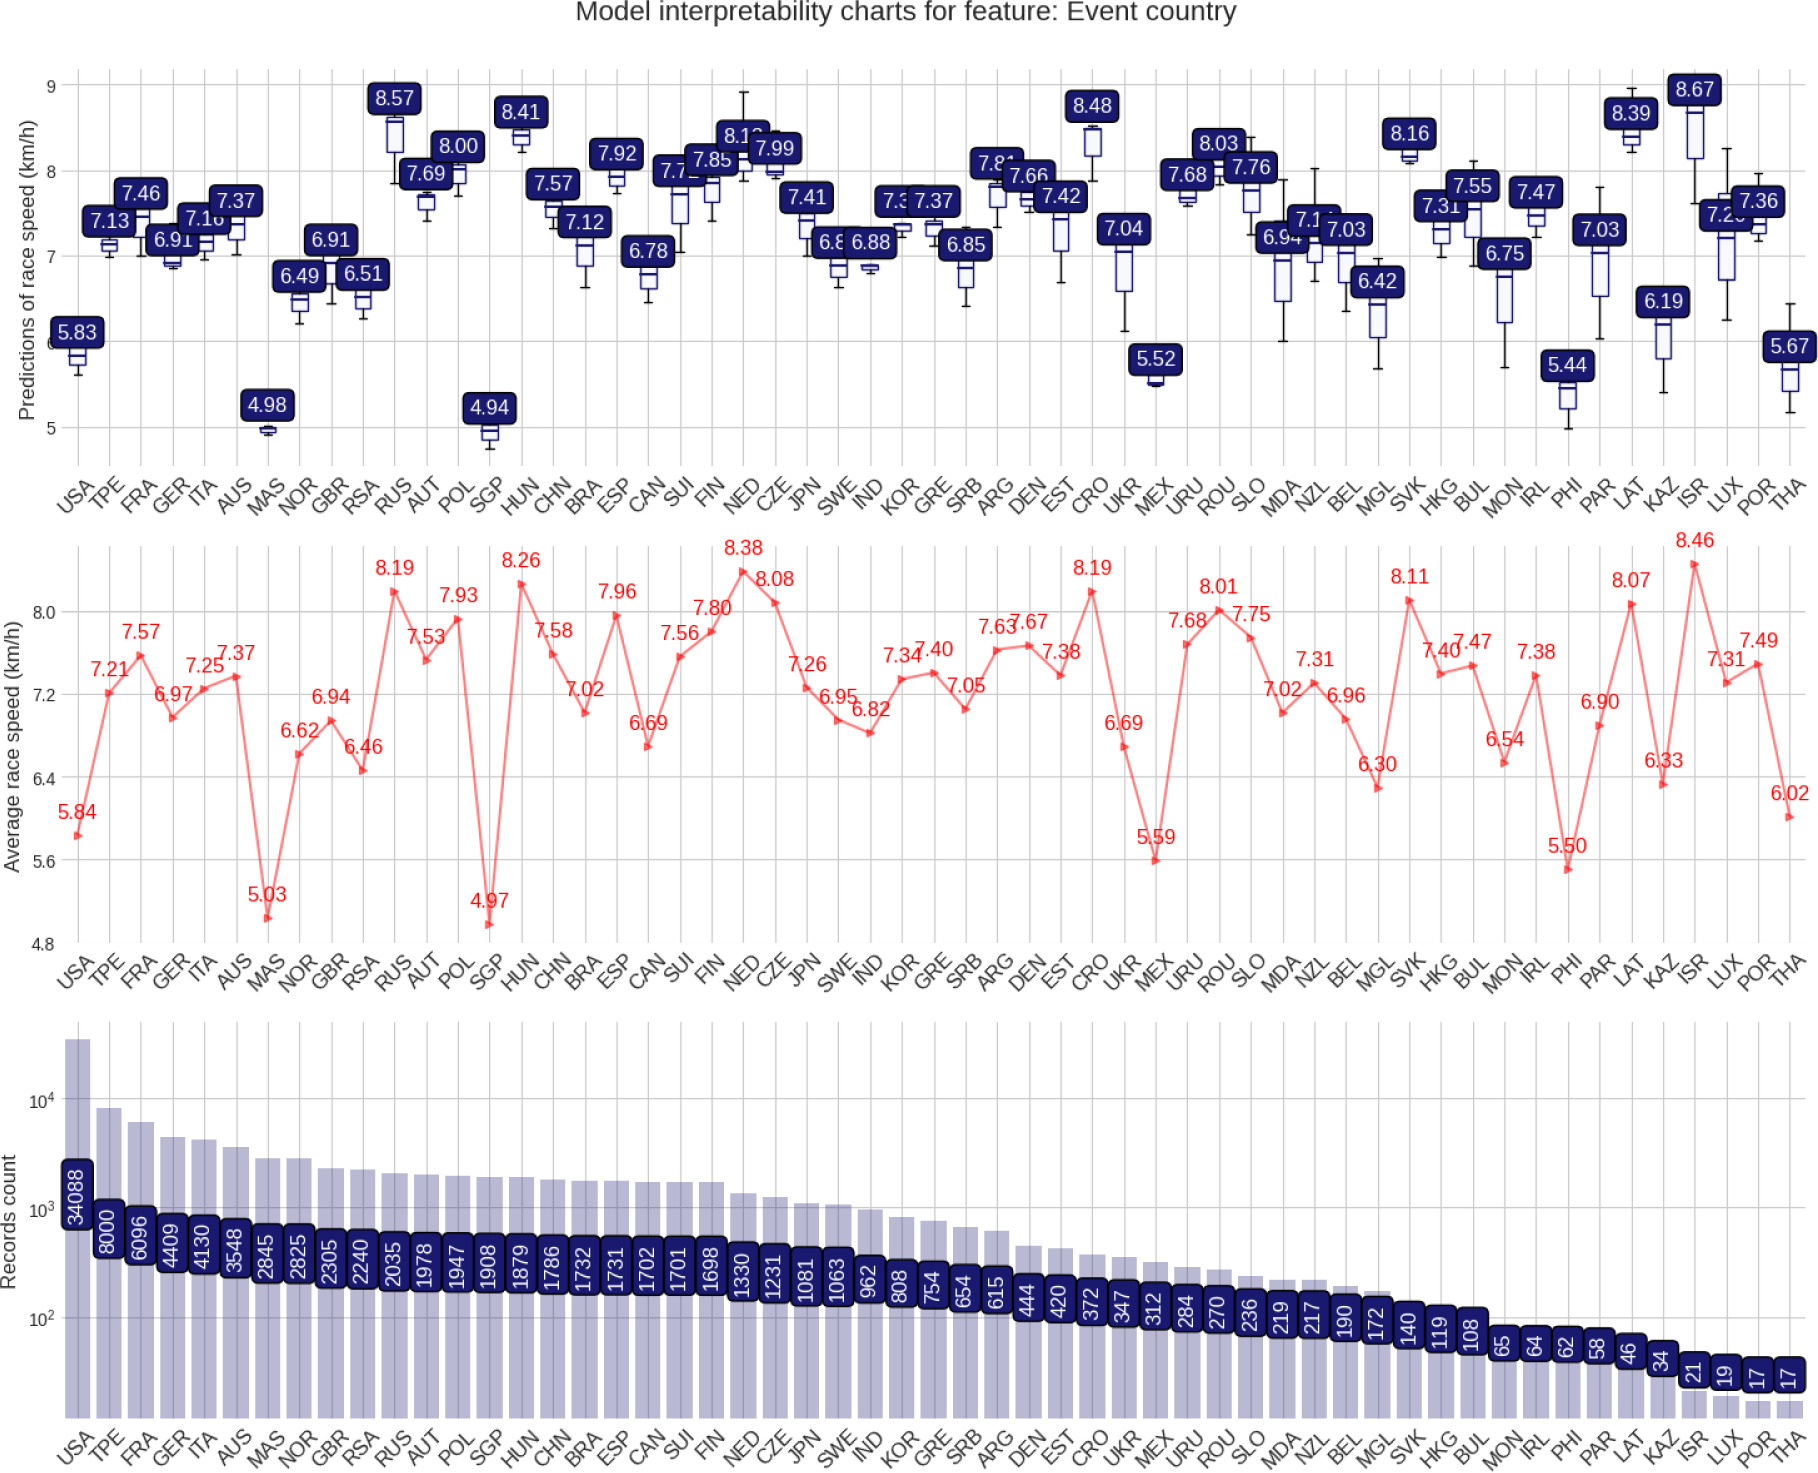
Prediction distributions and target value diagrams
The mean difference between male and female predictions was ~0.6 km/h (middle chart). However, the median difference (top chart) was over 1.2 km/h, emphasising the performance gap between men and women (Figure 8). The fastest runners were recorded in the 40-44 and 45-49 age groups, obtaining the highest predictions (Figure 9). In the athlete country charts, distinctive peaks can be seen for Lithuania and Israel, with predictions well over the 9 km/h mark (Figure 10). In the event country charts, Israel, Latvia, Slovakia, Romania, Croatia, Czech Republic, Netherlands, Russia, and Hungary obtained prediction distributions over 8 km/h, pointing at a dominance of eastern European countries in fast 12-hour races. on the contrary, 12-hour races in Asian countries (Singapore, Philippines, Thailand) were among the slowest, as were those in the USA and Mexico (Figure 11).
Discussion
This study was designed to determine the origin of the fastest runners competing in 12-hour ultra-marathons with the hypothesis that Europe would have the fastest runners and the fastest race courses. The main findings were that the event location was the most important predictor, followed by the origin of the athlete, sex, and age. In addition, most of the runners originated from the USA, most of the races were held in the USA, the fastest runners originated from Lithuania, Israel, Russia, Hungary, Croatia and Namibia, the fastest running speeds were achieved in races held in Russia, the Netherlands, Israel, Slovakia, the Czech republic, Croatia, and Hungary, men were ~0.5 km/h faster than women, most athletes were recorded in the 40-44 and 45-49 age groups, and the fastest runners were in the 40-44 and 45-49 age groups.
Event location was the most important predictor variable
The regression model found that the event location was the most important predictor, followed by the origin of the athlete, sex, and age. Whilst this result does not imply causality in any way, the information adds value to the scientific discussion on predictors of performance in the ultra-marathon. Most studies considered individual attributes as the most critical factors in running performance, which differs from the present findings. The importance of event location on running speed may be related to environmental characteristics that impair performance, including weather [17, 18]. For example, non-elite runners spend roughly five hours running a marathon, which harms performance and health. In this regard, statistics from 830,255 nonelite runners who completed the New York City Marathon between 1999 and 2019 showed that temperature and humidity slowed the pace of competitors of various ages but had more influence on those aged 20 to 59 [17]. Similar findings were obtained for runners who completed the Berlin Marathon, where increasing temperatures and decreasing humidity throughout the day were negatively related to running speed, with men being more affected than women [18].
Event locations, as a crucial predictor, may involve physiological factors such as altitude and climate. Countries like Russia and Israel, where top runners originated and achieved high running speeds, may offer environmental conditions that favour endurance, with altitude potentially affecting oxygen utilisation and cardiovascular adaptation. The variation in running speeds at different locations suggests that training environments also play a crucial role [19]. Factors such as access to varied terrains, advanced training facilities, and coaching expertise can influence an athlete’s physiological adaptation and overall preparedness for ultramarathon events [20].
Most 12-hour runners were from the USA, but the fastest were not
The USA accounted for about one-third of the 12- hour race records, both in terms of country of origin and country of event, followed by Taiwan and some European countries (e.g., Germany, France, Italy, and Norway), along with others from the Anglosphere (i.e., Australia, the United Kingdom, and South Africa). However, the fastest runners were from Lithuania, Israel, Russia, Hungary, and Croatia, confirming our hypothesis.
The higher frequency of runners from the USA is in agreement with previous literature. A macro-to-micro analysis of runners competing in 100-mile ultra-marathons showed the highest frequency of runners [21], as did a by Hoffman covering events held between 1977 and 2008 [22]. The high of runners from the USA was previously explained alongside the history of running in the USA and globally, as well as the increase in participation among women and older athletes [23, 24]. However, a higher participation rate does not equate to higher performance. For example, in 100-mile ultramarathons, the fastest runners in the top three, top 10, and top 100 for women were from Sweden, Hungary, and Russia, and Brazil, Russia and Lithuania for men [21]. The factors explaining that the fastest runners originated from Lithuania, Israel, Russia, Hungary, Croatia, and Namibia are unclear in the literature. However, these results can be related to the characteristics of the event. Our analyses revealed that the fastest running speeds were achieved in races held in Russia, the Netherlands, Israel, Slovakia, the Czech Republic, Croatia, and Hungary, which can increase runner participation in events in these countries. In addition, cultural, historical, and weather characteristics can benefit runners living near the place of competition. Identifying Lithuania, Israel, Russia, Hungary, Croatia, and Namibia as the origins of the fastest runners also raises questions about genetic predispositions, cultural influences, motivation, and training. Genetic factors impacting endurance, such as muscle fibre composition, as well as cultural attitudes toward long-distance running, could contribute to superior performance [25].
Exploring the idea that European ultra-marathoners are the fastest involves considering diverse terrains, cultural influences, and advanced training resources. The periodisation of ultra-marathon training is highly individualised and involves factors such as race specificity and athlete experience and goals [26]. Monitoring fatigue levels, adjusting training intensity, and incorporating adequate recovery are crucial aspects of successful ultra-marathon training [27]. Furthermore, mental preparation and nutrition planning play an integral role in ensuring that athletes are well-prepared for the mental and physical demands of ultramarathon races [28]. Therefore, training periodisation involves a structured approach to optimise physical and mental readiness for the unique challenges of ultramarathon distances [29].
What drives an individual to choose a sports discipline that exposes and pushes the limits of human physical and psychological limits? Understanding the motivations behind participating in ultra-marathons involves delving into the interconnected aspects of an athlete’s biology, psychology, and social influences [30]. Biopsychosocial factors collectively contribute to shaping the mindset and drive of these extraordinary individuals [31]. Biologically, exploring the physiological adaptations that occur in ultra-marathon runners is fascinating. Endurance training induces changes in cardiovascular efficiency, muscle strength, and metabolic pathways, allowing athletes to maintain prolonged efforts [32]. Additionally, genetic predispositions may play a role in an individual’s aptitude for ultra-marathon distances [33]. From a psychological perspective, delving into the mindset of ultra-marathoners unveils a complex interplay of mental resilience, motivation, and goal setting [34]. These athletes often have an intrinsic motivation to challenge themselves, seeking personal growth and accomplishment [35]. The ability to endure prolonged physical exertion also requires a robust mental framework, including coping strategies for pain, fatigue, and the psychological toll of long-distance running [36]. Social factors contribute significantly to the appeal of ultra-marathons, with community and camaraderie within the ultra-running world fostering a supportive environment [37]. Athletes often find inspiration and encouragement from their peers, creating a shared identity among those who embrace the challenges of ultra-marathon distances [38]. Social networks, events, and online communities further contribute to the diffusion of ultra-running culture [39]. Examining the biopsychosocial profile of ultramarathon athletes provides valuable insights for sports science and understanding human motivation, resilience, and the pursuit of extraordinary challenges [40]. It showcases the intricate interplay between biological predispositions, psychological factors, and social influences that collectively shape the mindset of those who choose to venture into the realm of ultra-marathons [41].
Correlations between country of origin and country of event
We found a strong correlation between the country of origin of the athlete and the country of the event, indicating that athletes prefer to compete in their home country. We also found a correlation between the country of the event and running speed, indicating that countries with substantial participation had lots of average or poor performers, which brought the average performance down. In contrast, the overall quality of runners was higher in countries with a lower number of participants. We also found a positive correlation between sex and country and both the athlete/event country variables, which suggests that as participation reduced, the men-to-women ratio seemed to increase.
Sex differences in performance and the age of peak running performance
Men were, on average, 0.5 km/h faster than women. Performance differences between sexes are well established in the scientific literature [42, 43]. the observed sex disparity in running speeds is consistent with established physiological differences between men and women. Men typically exhibit greater muscle mass, higher aerobic capacity, and different fat metabolism patterns, contributing to their overall faster running speeds in ultra-marathons [44]. Studying the evolution of women’s performance compared to men’s in ultramarathon races holds significant interest for several reasons since it comprehensively explores sex-specific physiological adaptations and capabilities in response to extreme and prolonged physical exertion [45].
Understanding how women’s performance in ultramarathons has evolved compared to men’s provides valuable insights into the progress, challenges, and potential advancements in female endurance sports [46]. This research can help break down sex-related stereotypes and promote equal opportunities and recognition in ultra-marathon competitions [47]. Future studies need to investigate the trend in sex differences over time to estimate whether women can close the gap with men in the future.
Understanding sex differences is instrumental for coaches, athletes, and sports scientists in tailoring training programs that optimise the performance of both male and female ultra-marathon runners [48]. Additionally, highlighting the achievements of women in ultra-marathons can inspire a broader cultural shift, encouraging more women to participate in these challenging events and fostering inclusivity within the sporting community [49]. In essence, studying the evolution of women’s performance compared to men’s in ultra-marathons not only contributes to the scientific understanding of athletic capabilities but also promotes sex equality, encourages participation, and enhances overall awareness of the diverse achievements in endurance sports [50].
Athletes in the 40-44 and 45-49 age groups were fastest. The concentration of participants and top performers in these age groups indicates potential advantages associated with these age ranges. Factors such as accumulated training, previous experience, enhanced endurance capabilities, and optimised pacing strategies may contribute to the superior performance observed in these age groups [51].
Limitations
This analysis was not free of limitations. An athlete could be born in one country and change nationality when moving to another country later in life. Also, specific characteristics that influence ultra-running performance, such as training, race experience, or anthropometric characteristics, were not considered. The r2-value of 0.34 is insufficient for robust predictions using the investigated variables or indicating that other variables might be of higher importance. Future studies could include more variables such as training, previous experience, and anthropometry.
Other metrics, such as root mean square error (RMSE) and mean absolute percentage error (MAPE), could provide a more comprehensive view of the model’s performance. While the study provides valuable insights, the model’s accuracy needs to be improved to ensure more reliable and comprehensive predictions. A more detailed exploration of specific environmental factors in top-performing locations, such as altitude and climate conditions, would enrich the argument. Furthermore, the comparison between the high participation of runners from the USA and the superior performance of runners from Lithuania, Israel, Russia, Hungary, Croatia, and Namibia could be deepened by addressing sociocultural differences and training infrastructure that may influence these outcomes.
Identifying event location as the most important predictor suggests that future research should consider a more qualitative approach to better understand the impact of training environments, athlete motivations, and management and life balance dynamics on competition participation. Additionally, the inclusion of more predictor variables and the use of advanced modelling techniques are recommended to enhance predictive power and the understanding of physiological adaptations contributing to ultra-marathon success.
Conclusions
In 12-hour ultra-marathon running, most athletes originated from the USA and competed in the USA. However, athletes from Lithuania, Israel, Russia, Hungary, Croatia, and Namibia obtained the fastest running speeds. There was a positive correlation between country of origin and country of event, indicating that athletes primarily competed in their home country. In conclusion, the study findings underscore the multifaceted nature of ultra-marathon performance, which is influenced by a complex interplay of environmental, genetic, cultural, and physiological factors. A deeper understanding of these elements provides valuable information on the intricacies of endurance running and can inform training strategies, event planning, and appreciation of the diverse physiological adaptations that contribute to success in ultra-marathons. Future studies should consider a more qualitative approach to understanding training background, motivations, and management and life balance dynamics for participating in competitions in different parts of the world.