Introduction
Chronic ankle instability (CAI) is a condition marked by recurrent episodes of the lateral ankle “giving way,” persisting for over a year following an initial sprain, accompanied by at least two such episodes in the last six months [1]. This condition is not uncommon, affecting approximately 40% of the general adult population, 9.4% of athletes, and 25% of young adults who have experienced a first-time ankle sprain [2-4]. The high incidence of reinjuries following the initial lateral ankle sprain is often attributed to the decreased quality of afferent proprioceptive input resulting from muscle and tendon injuries [1]. These injuries impair mechanoreceptors critical for balance control, leading to proprioceptive deficits that adversely affect postural stability, increasing sway and impairing neuromuscular control. Specifically, individuals with CAI show reduced gluteus maximus (GMax) activation latency and increased latency in rectus femoris, gluteus medius (GMed), and biceps femoris (BF) activation, with lower muscle magnitudes overall [5, 6]. They also exhibit weaknesses in hip extension, abduction, and external rotation [7-9], along with the soleus [10] and peroneal muscles [11]. These deficits impede the individual’s ability to prevent injury during unplanned incidents due to delayed protective muscle contractions. Furthermore, the imbalance in evertor and invertor muscle activation contributes to a more supinated foot posture, fostering an impaired movement pattern that predisposes individuals to further injuries [1].
Within the scope of rehabilitation methods, unstable surfaces such as foam pads, wobble boards, and balance discs are widely used to enhance balance by challenging the neuromuscular control system [12]. Previous studies have demonstrated that training on these surfaces increases the centre of mass (CoM) displacement in mediolateral (ML) and anteroposterior (AP) directions, indicating a heightened balance challenge [12, 13]. This training necessitates a recalibration of sensory input from the visual, vestibular, and proprioceptive systems, enabling the central nervous system (CNS) to orchestrate coordinated muscle responses crucial for maintaining an upright stance, particularly in single-leg conditions [14].
Recent literature has highlighted the potential of textured surfaces in improving balance control by reducing postural sway and enhancing ankle muscle strength [15-17]. These surfaces, by stimulating plantar cutaneous receptors, may augment the utilization of somatosensory information, thereby improving the body’s reaction to postural disturbances [16, 18]. The efficacy of these surfaces is influenced by their design elements, including the shape, hardness, and spacing of protrusions, which are key to stimulating the plantar receptors effectively and modifying sensory feedback [18].
This study introduces a novel intervention: a textured mat with flexible nubs designed to provide a distinctive combination of texture and flexibility different from conventional unstable surfaces. Featuring small massage nubs made of flexible material arranged in a hexagonal shape, this mat aims to stimulate slow-adapting type I receptors and challenge postural equilibrium similar to unstable surfaces. We hypothesized that the innovative textured mat would demonstrate significant differences in enhancing balance control and lower limb muscle activation compared to standard foam pads in individuals with CAI. Our objective was to rigorously evaluate the effects of this mat compared to conventional foam and firm surfaces on lower limb muscle activity and balance among people with CAI, addressing a gap in current rehabilitation practices.
Material and methods
Study design
This investigation was structured as a within-subjects, repeated-measures experiment, meticulously assessing each participant across six distinct conditions: double-leg stance on a firm surface (D-Fi), foam surface (D-Fo), and textured mat (D-Tx), and single-leg stance on a firm surface (S-Fi), foam surface (S-Fo), and textured mat (S-Tx). The outcomes focused on CoM acceleration were evaluated using an integrated accelerometer sensor within the wireless EMG recording unit and the activity of ten lower limb muscles, quantified through mean rectified electromyography (EMG) values.
Sample size calculation
Utilizing G*Power (version 3.1.9.4) and referencing prior studies on the effects of unstable surfaces on muscle activity in CAI subjects, a minimum sample size was determined. With an effect size estimate of 0.2 and alpha and beta levels set at 0.05 and 0.20, respectively, the calculation indicated a need for 28 participants with unilateral CAI.
Participants
Twenty-eight participants were recruited based on specific inclusion criteria: age between 18 and 29 [4], a history of at least one significant ankle sprain leading to pain and functional loss at least 12 months prior to the study [1], at least two episodes of ankle “giving way” in the past six months [1], a Cumberland Ankle Instability Tool (CAIT) score below 24 [1], and no allergies to the materials used in the study. Exclusion criteria included neuromusculoskeletal disorders, recent lower limb trauma, surgeries on the lower limbs within the past year, current treatment for lower back or lower limb issues, recent head trauma, drug or alcohol consumption within 24 h before testing, impaired sole sensation, or inability to follow commands or complete testing.
Materials
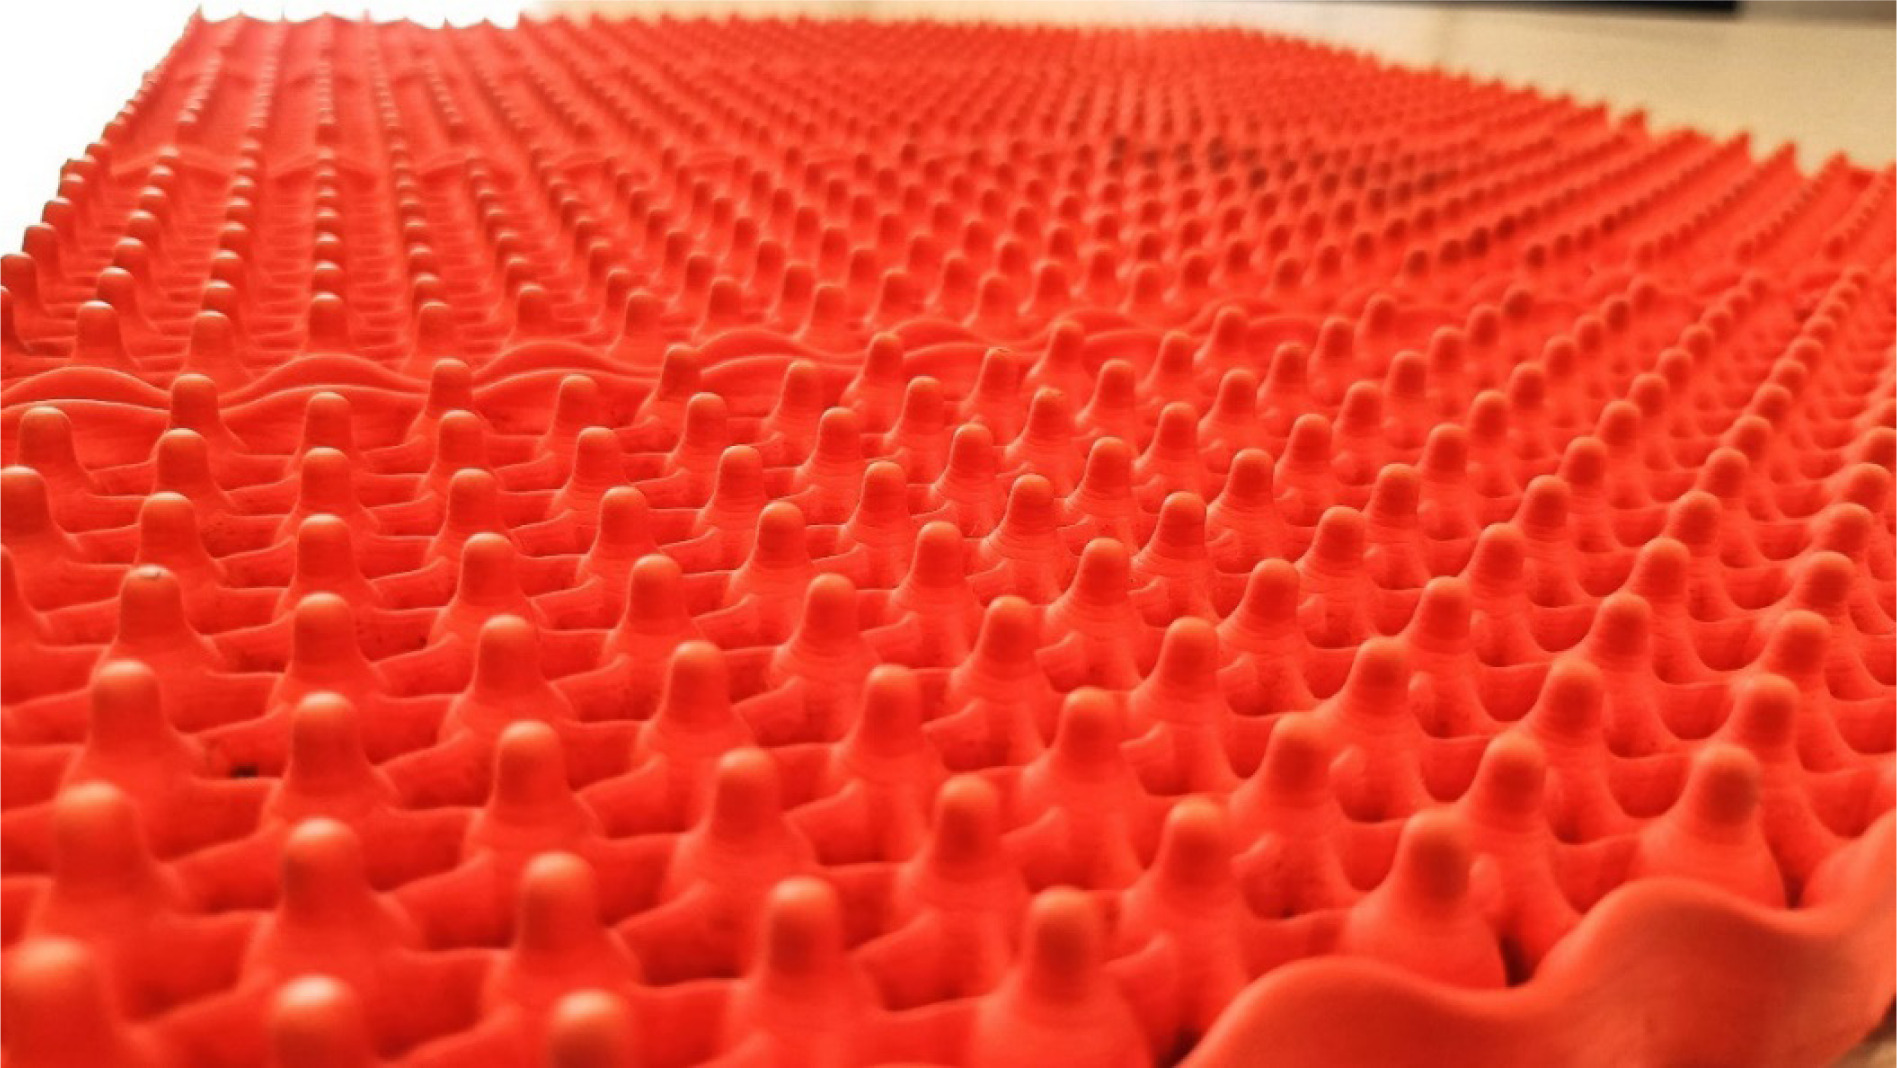
The study employed three surfaces: a control firm surface, a foam surface (AIREX®, width 14-inch, height 17-inch, thickness 0.05 m), and a textured mat (KONE-X Active mat, width 18.5-inch, height 22.5-inch, thickness 0.015 m, nub height 1-inch, 0.36 point/cm2) featuring a hexagonal texture with flexible tiny nubs (Figure 1).
Figure 1
The KONE-X Active Mat used in this study, measures 18.5 inches in width, 22.5 inches in height, with a thickness of 0.015 m. It showcases a distinctive hexagonal texture comprised of flexible tiny nubs, each standing 1 inch high, distributed at a density of 0.36 points per square centimetre, designed to enhance proprioceptive feedback and muscle activation during rehabilitation exercises
Procedures
Upon successfully enrolling in the study, each participant underwent a preliminary evaluation to ensure they met all the inclusion criteria, with particular attention to the sensory function of their soles. This assessment employed the Semmes-Weinstein monofilament test, utilizing a 10-gram monofilament across nine designated sites on each foot to accurately gauge light-touch pressure sensitivity. This meticulous approach, aligning with established methodologies fromprior research [19], ensured a robust assessment of the participant’s ability to perceive tactile stimuli, a crucial factor given the study’s focus on balance and proprioceptive feedback.
Following this initial sensory evaluation, participants were introduced to the experimental setup. A researcher facilitated the attachment of the EMG device. This step was critical for accurately measuring muscle signals and postural sway across the various test conditions. To ensure participants were adequately prepared for the balance assessments on the different surfaces, a practice session lasting between two to 5 min was provided. This familiarization process was designed to acclimate participants to the protocol and the surfaces they would encounter, thereby reducing variability in performance due to unfamiliarity.
The procedure involved participants performing balance tasks under six conditions based on stance (double-leg or single-leg) and surface type (firm, foam, textured mat). In this study, the single-leg stance was assessed by having participants stand on the affected limb, which was determined based on their history of CAI, with the contralateral hip and knee flexed to 90 degrees to ensure a standardized posture. Each condition was repeated three times to ensure data reliability. The order of the test conditions was randomized using a computer-generated sequence to reduce the likelihood that factors such as fatigue, learning effects, or other sequential influences could skew the data, ensuring that the results are more reflective of the true effects of the conditions being tested.
Participants were instructed to maintain a steady gaze forward at eye level and position their hands at their waist for each trial, ensuring a standardized posture. The precise positioning of their feet was meticulously measured and replicated across all trials to maintain consistent testing conditions. The researcher closely monitored adherence to these standards, ready to repeat any trials deviating from the prescribed stance or procedure. Deviations included touching the floor with the contralateral leg during single-leg conditions, stepping off the surface, or changing hand positions during measurements.
Data collection was precisely timed to capture 15 s of EMG and accelerometer data per trial, divided into a 2.5-second pre-sampling period, a 10-second active recording interval, and a 2.5-second post-sampling phase. Participants rested for 1 min between trials to prevent fatigue, and a two-minute break between different conditions minimized the potential effects of habituation or muscle exhaustion.
Concluding the balance assessments, participants underwent the isometric manual muscle test grade 3 (isoMMT3) for the same muscles monitored during the experimental trials. This procedure, designed to normalize the EMG data, involved participants performing voluntary movements against gravity, as outlined in Daniels and Worthingham’s Muscle Testing protocols [20]. The inclusion of rest periods between trials and tests ensured participants could perform at their best without the interference of fatigue [21].
Outcome measurements
Centre of mass acceleration
The study’s primary outcome, CoM acceleration, was meticulously measured to assess the participant’s balance and postural sway. Utilizing an integrated tri-axial accelerometer of the wireless EMG system (TrignoTM Wireless EMG system, Delsys, Boston, MA, USA), motion detection signals were captured at a sampling rate of 50 Hz. This innovative approach allowed for a precise approximation of the body’s CoM movements, essential for understanding the balance dynamics under different standing conditions. The accelerometer was strategically placed at the L5 vertebra, close to the body’s centre of mass, to ensure accuracy in capturing postural sway.
Accelerometer data underwent rigorous filtering using a 4th-order low-pass, zero-lag Butterworth filter with a 20 Hz cutoff frequency [22]. This step was crucial for eliminating high-frequency noise while retaining meaningful movement data. Gravitational acceleration was isolated by subtracting 9.8 m/s2 from the vertical axis data. The RMS values of CoM acceleration were normalized to the control condition (double-leg stance on a firm surface) for direct comparison of balance performance. The mean RMS values from three trials per condition were compared. CoM displacement in the AP, ML, and vertical axes was also analysed to assess postural stability. This comprehensive analysis, based on the ensemble averages of these trials, detailed participants’ balance capabilities.
Electromyography
For the precise measurement of muscle activity, EMG recordings were captured from the symptomatic side using a 10-channel wireless system (Trigno™ Wireless EMG system, Delsys, Boston, MA, USA). This system, notable for its high sampling rate of 1000 Hz, allowed for detailed, real-time analysis of muscle responses under various conditions. Prior to the application of the EMG electrodes, the skin at the designated sites was meticulously prepared—cleaned and shaven if necessary—to ensure optimal electrode-skin contact and reduce signal interference. The selection of muscles for EMG recordings encompassed a comprehensive array of lower limb muscles: GMax, GMed, rectus femoris (RF), vastus lateralis (VL), vastus medialis (VM), biceps femoris (BF), semitendinosus (ST), tibialis anterior (TA), medial gastrocnemius (MG), and peroneus longus (PL).
Adhering to the Surface ElectroMyoGraphy for the Non-Invasive Assessment of Muscles (SENIAM) recommendations [23], the placement of EMG electrodes was conducted with precision to ensure accurate and reliable muscle activity readings. The researchers, skilled physical therapists undergoing advanced training, performed electrode placement to minimize variability and improve data quality. Post-acquisition, raw EMG signals were processed using a 4th-order, zero-lag Butterworth band-pass filter (20-450 Hz) to isolate muscle activity from noise [24]. The processed EMG data from the central 10-second segment of each recording were converted to RMS values. These were normalized using isoMMT3 scores for inter-participant and intercondition comparisons. The mean RMS values from 3 trials were then averaged and compared between conditions.
Statistical analysis
Data analysis was conducted using GraphPad Prism version 9.5.1 (GraphPad Software, La Jolla, CA, USA). The Shapiro-Wilk test assessed the normality of data distributions. Given the non-normal distribution of data, non-parametric tests were applied for analysis. The Friedman test identified differences across the six testing conditions, considering the within-subjects design. Subsequent pairwise comparisons between surface conditions utilized the Dunn’s test. The significance level was set at 0.05. The results from these analyses were presented in terms of median and interquartile ranges (IQRs).
Results
Table 1 presents the demographic characteristics of the study participants. The study was completed by all twenty-eight participants, with a diverse representation in terms of gender and affected limb. Notably, the number of ankle sprains reported ranged from 1 to 10, and the episodes of ‘giving way’ in the past six months varied significantly among participants, with a range from 2 to 24.
Table 1
Demographic characteristics of participants in the study (n = 28)
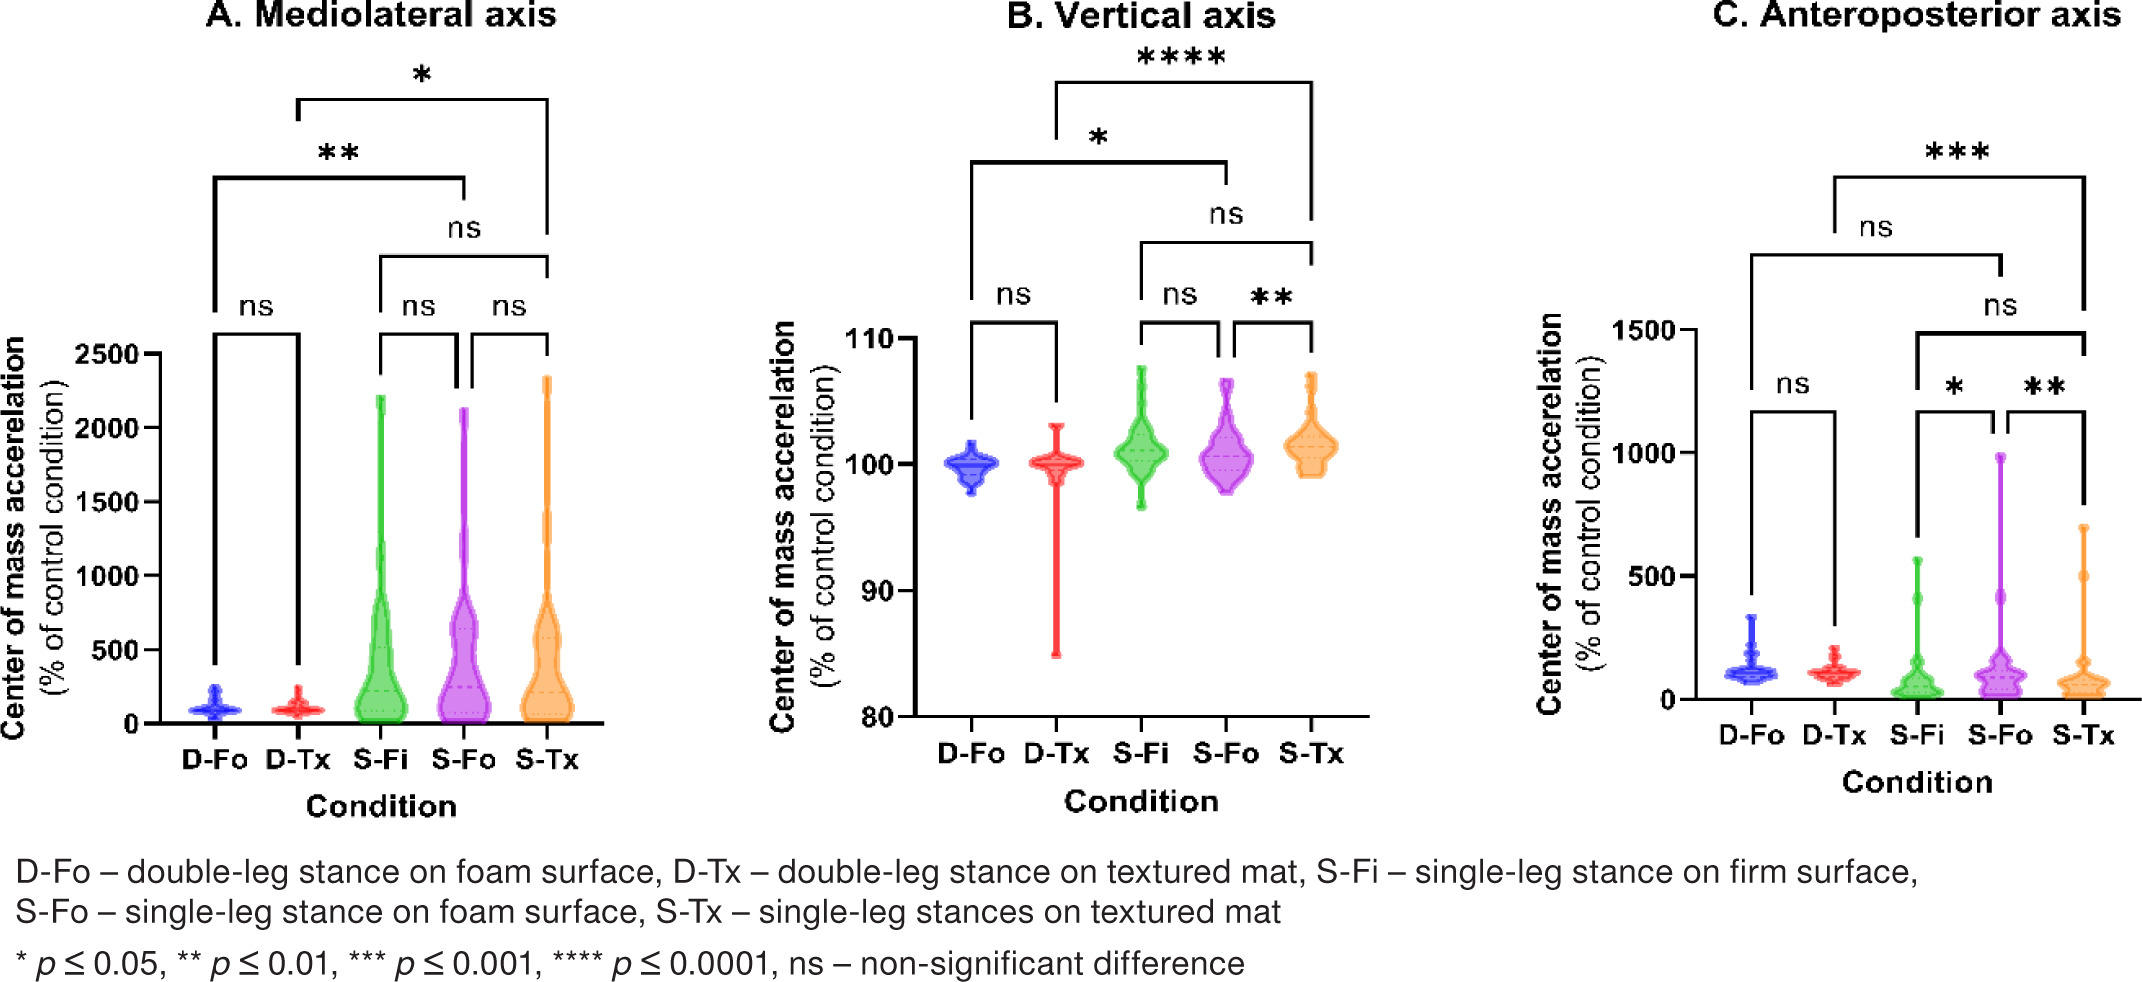
In Table 2 and Figure 2, we present a comparison with the double-leg firm surface, which served as the control condition for calculating percentage changes in CoM acceleration. In this context, 100% indicates no change from the control condition, providing a baseline for evaluating the effects of the textured mat, foam surfaces, and the impact of a single-leg stance. This comparison allows for a comprehensive understanding of how these variables influence balance relative to a stable, firm surface. Significant differences in CoM acceleration were detected using the Friedman test. The Friedman statistics for the ML, vertical, and AP axes were 17.49 (p = 0.0016), 42.11 (p < 0.0001), and 26.63 (p < 0.0001), respectively. These results show significant variability in CoM acceleration across surface conditions. Dunn’s multiple comparison tests further clarified the impact of standing and surface type on balance and postural control, as detailed in Table 2. As anticipated, there was a significant increase in CoM accelerations across all axes during single-leg stance compared to double-leg stance on the same surface, except for the AP axis in the foam surface condition. This highlights the challenge posed by a reduced support base. Analysis revealed that single-leg stances on a foam surface (S-Fo) resulted in higher CoM accelerations in both vertical and AP directions compared to a textured mat (S-Tx) or firm surface (S-Fi), indicating greater balance difficulty on the foam surface, as illustrated in Figure 2.
Table 2
Percentages of CoM acceleration during double- and single-leg standing on different surfaces: firm, foam, and textured mats (n = 28)
Figure 2
Comparison median (IQR) of percentage of CoM acceleration during double- and single-leg standing on different surfaces; firm, foam, and textured mats
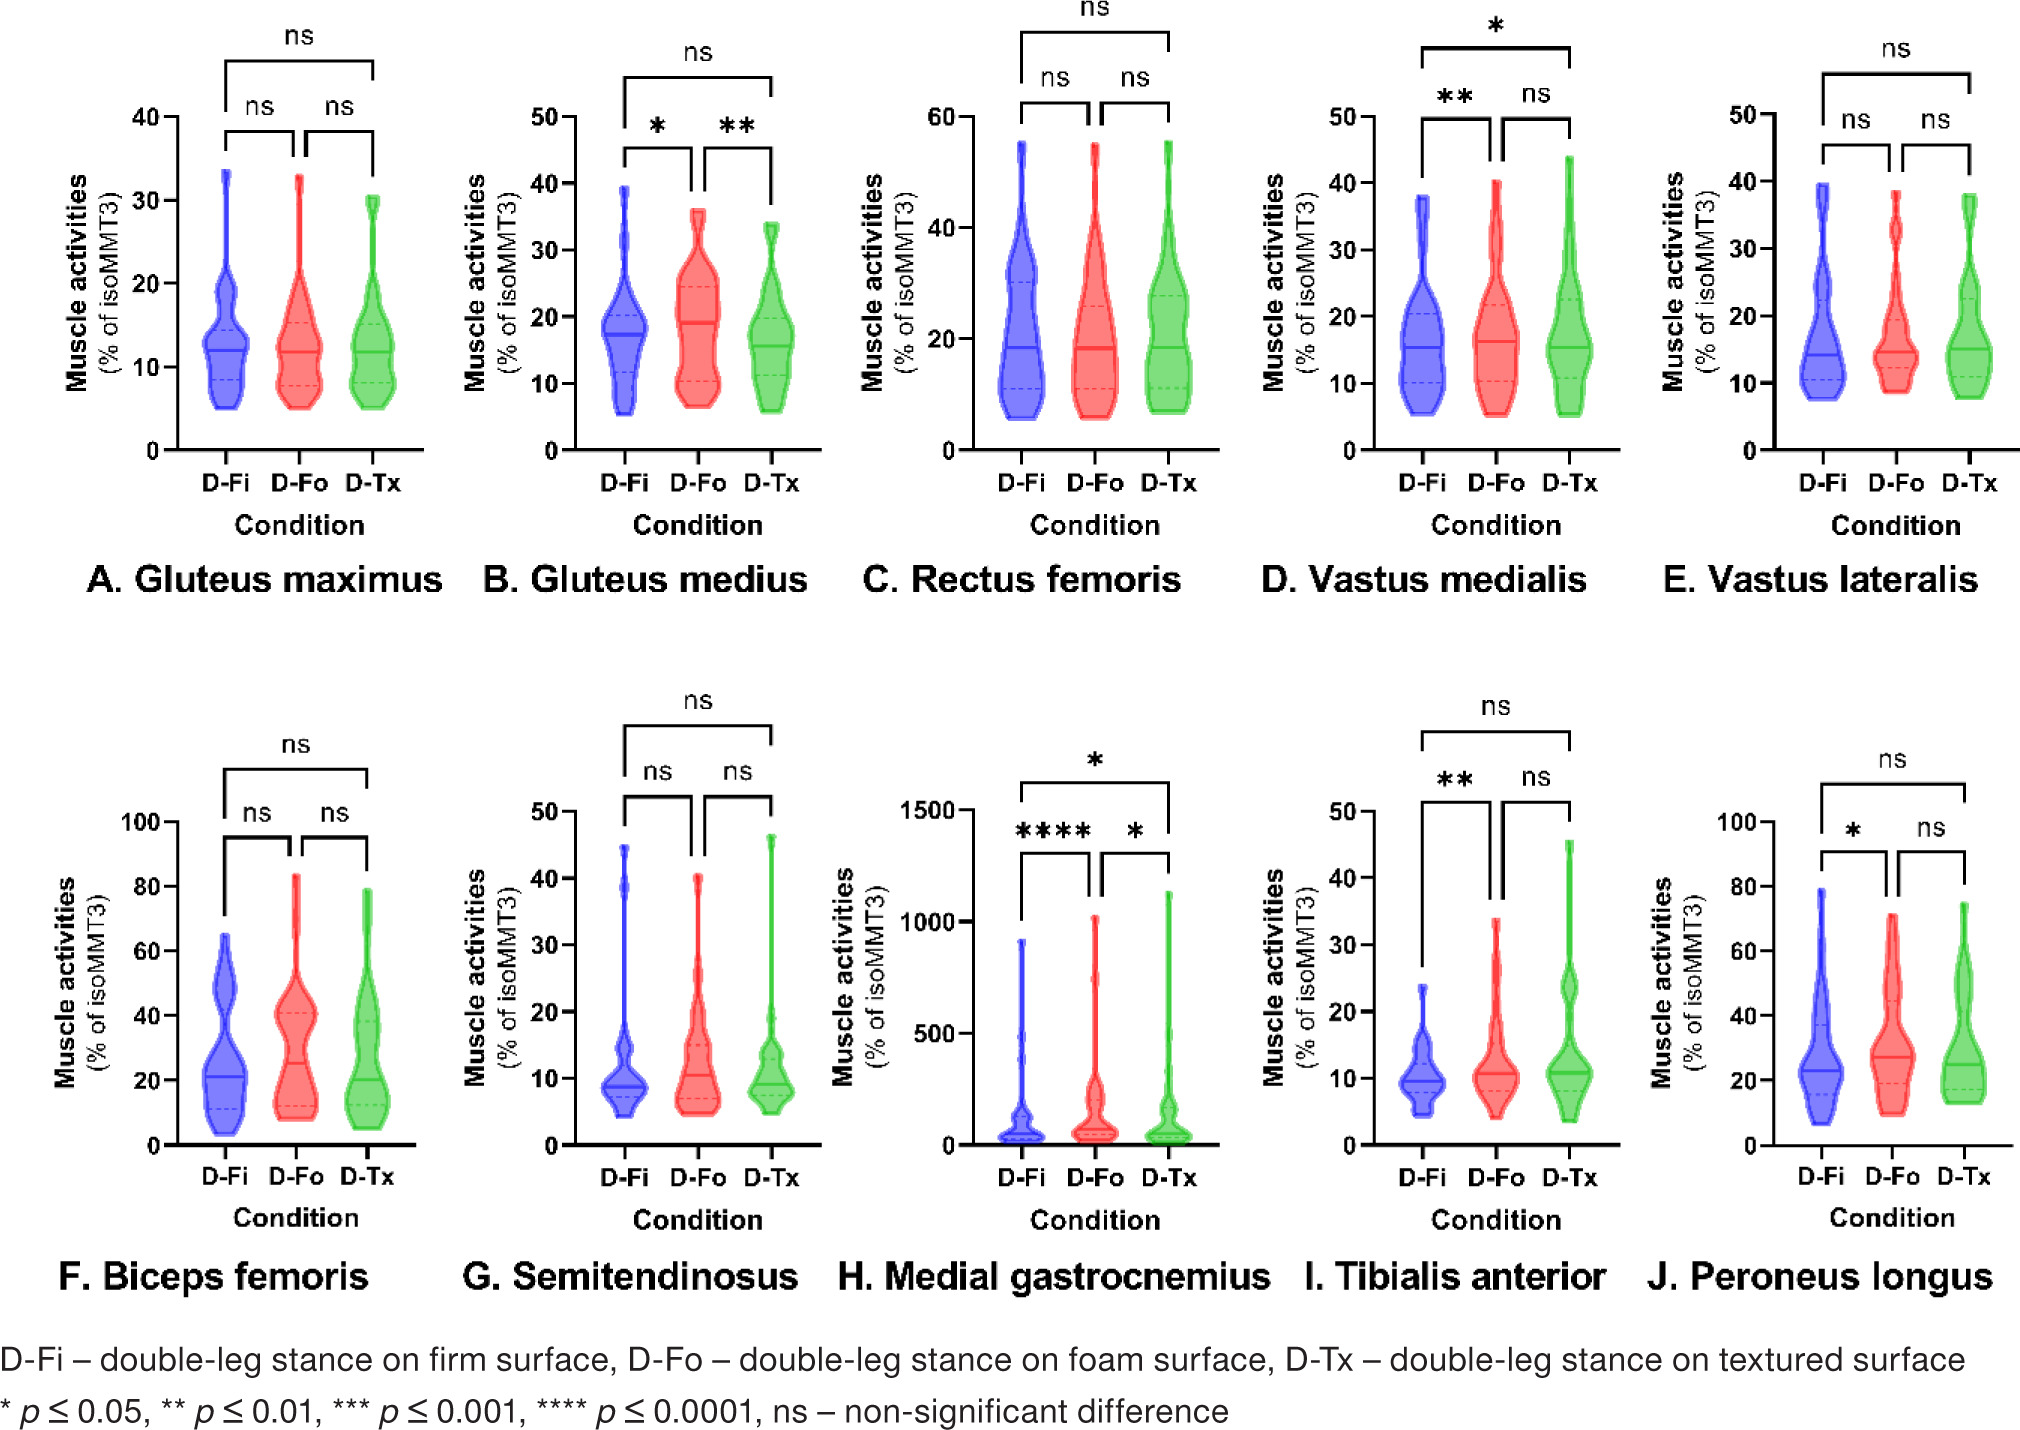
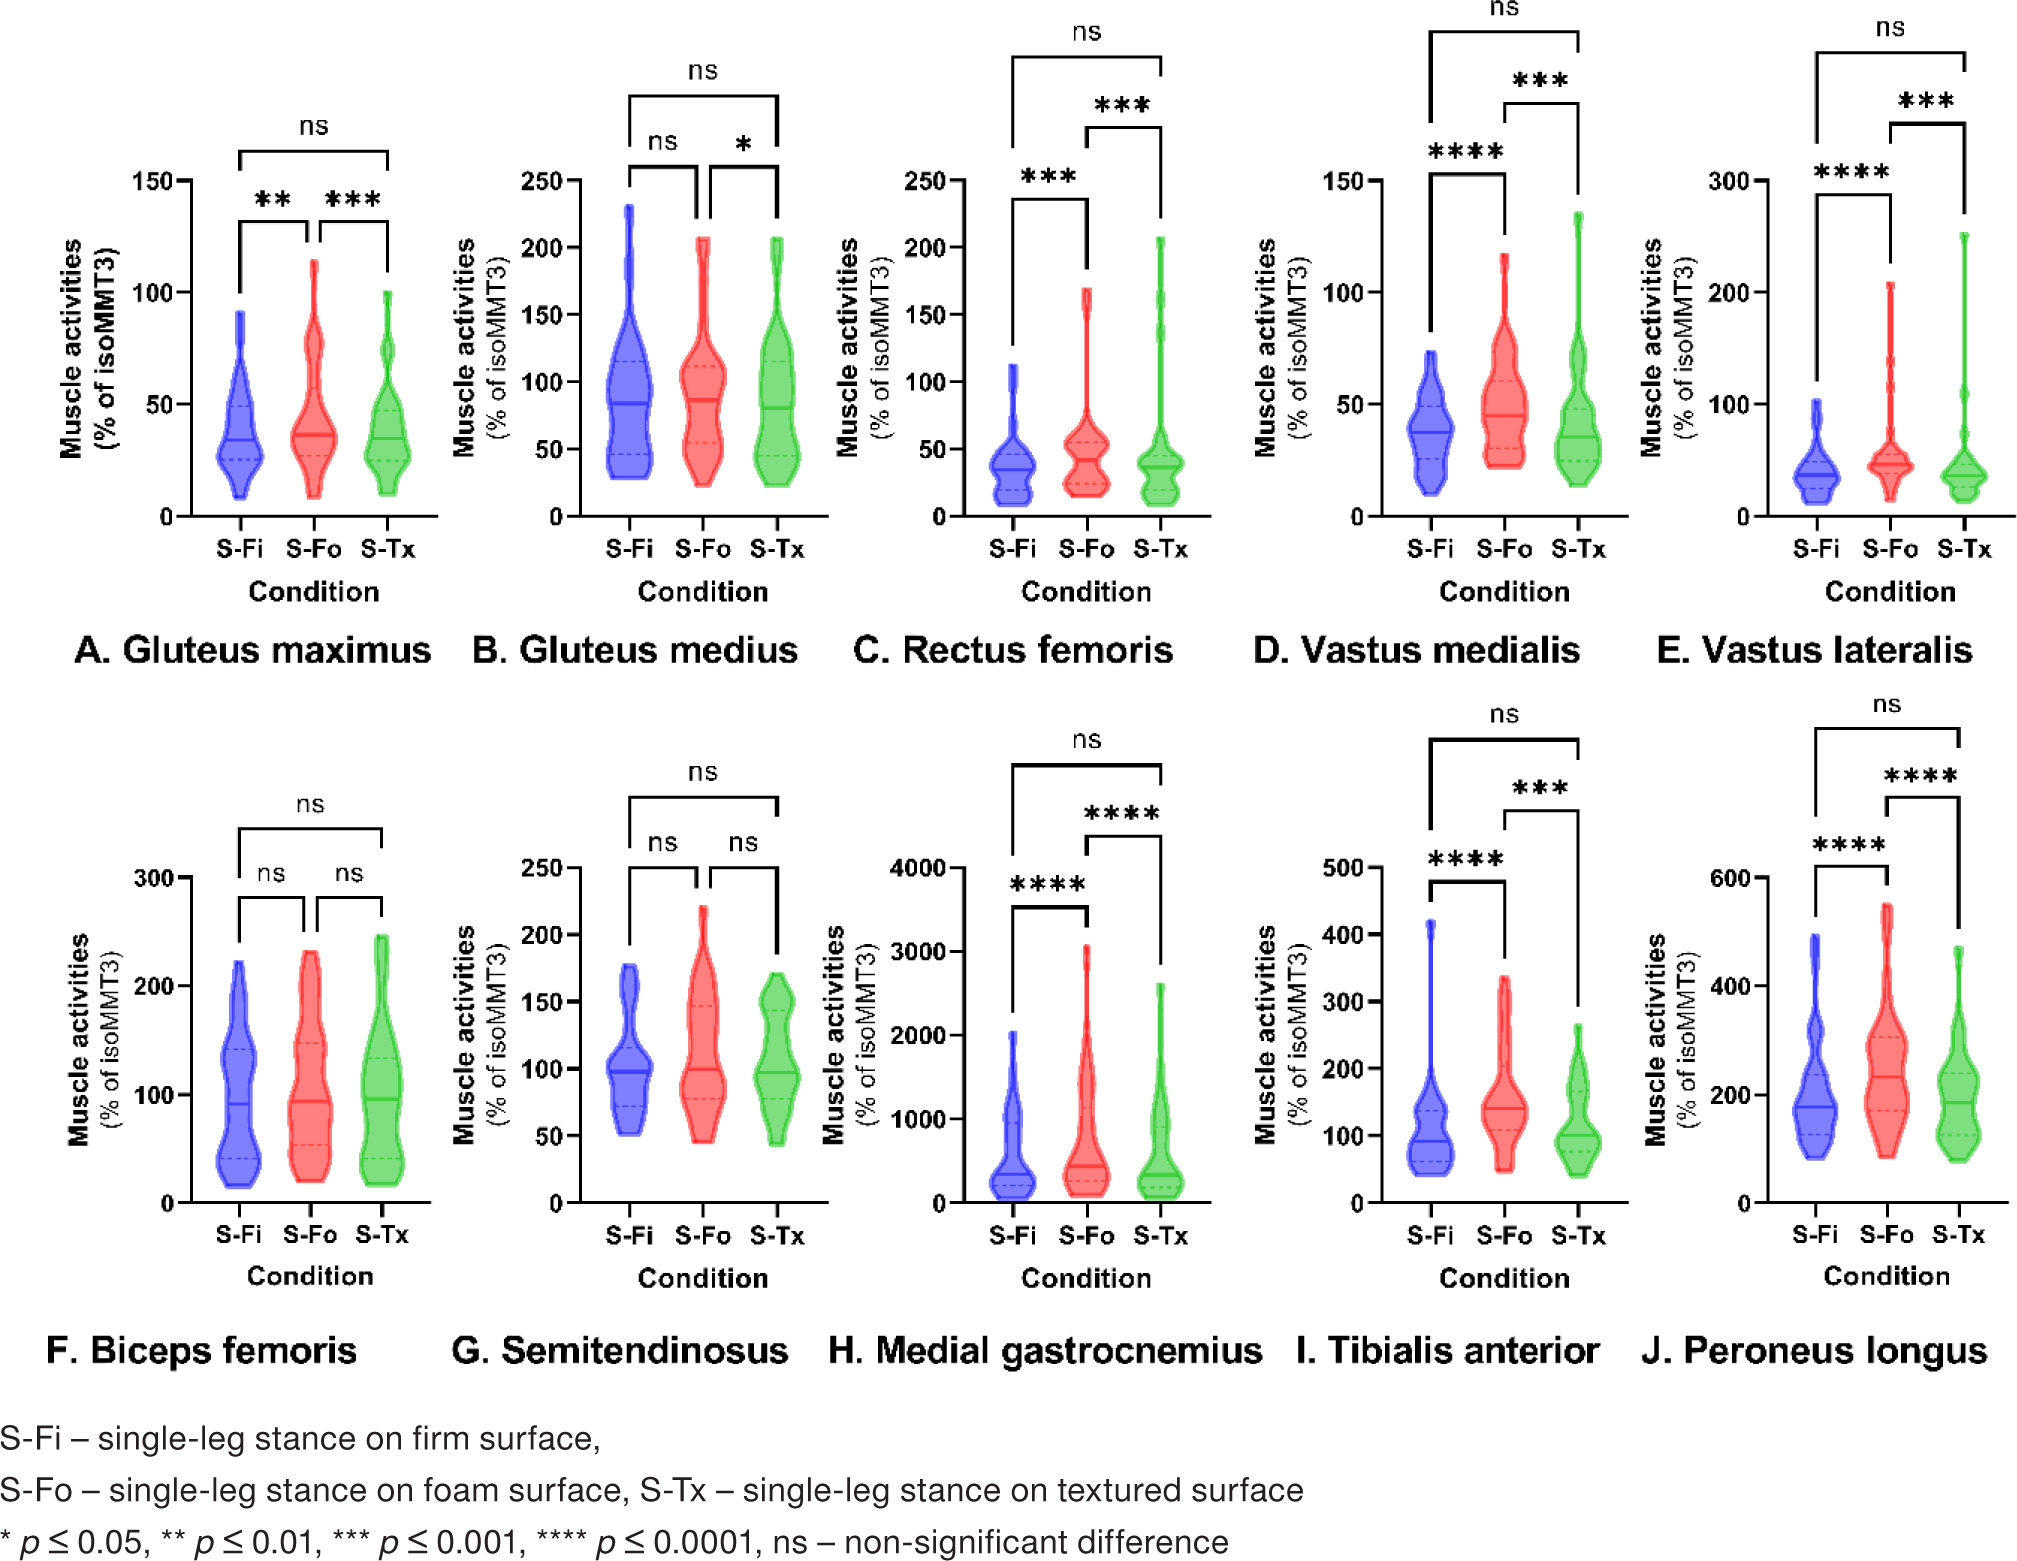
In Table 3, as well as in Figures 3 and 4, we focus on comparisons that are directly relevant to the study’s objectives, particularly the effects of different surfaces on muscle activity during various stance conditions. Comparisons between double-leg and single-leg tests on the same surface were not included, as our primary aim was to investigate differences between surfaces rather than differences between stances on the same surface. The Friedman test revealed significant differences in muscle activity, highlighting the nuanced nature of muscle coordination. Specifically, significant increases were observed in the Gmax (14.00, p = 0.0009), Gmed (6.929, p = 0.0313), RF (17.64, p = 0.0001), VM (8.559, p = 0.0139), PL (6.50, p = 0.0388), MG (19.50, p < 0.0001), and TA (10.07, p = 0.0065). Conversely, the VL, BF, and ST did not exhibit statistically significant activity changes. This distinction highlights the complex interplay of muscle responses under varying conditions. Statistically significant variations in muscle activity across all six conditions, as shown in Table 3, underscore the diverse effects of different surfaces on muscle activation. During double-leg stances, the Gmed and MG exhibited significantly lower activity on the textured mat (D-Tx) compared to the foam surface (D-Fo). In single-leg stances, the textured mat (S-Tx) resulted in lower muscle activity for all muscles except the BF and ST when compared to the foam surface (S-Fo). Conversely, both double-leg (D-Tx) and singleleg (S-Tx) stances on the textured mat elicited significantly higher muscle activity than stances on the firm surface (D-Fi and S-Fi), highlighting the complex effects of surface type on muscle activation (Figures 3 and 4).
Table 3
Percentages of muscle activity for firm, foam, and textured mats during double- and single-leg stances (n = 28)
Discussion
The objective of this study was to investigate the influence of textured mats on the postural sway and activation of muscles of patients who suffer from CAI. The purpose of this analysis was to shed light on the function that specialized rehabilitation surfaces play in improving neuromuscular control and balance. This study revealed an intricate relationship between surface type and neuromuscular responses, showing that muscle activation was consistently reduced on the textured mat compared to the foam surface in all scenarios. According to this discovery, the intrinsic instability of foam surfaces necessitates increased neuromuscular engagement to maintain balance. on the other hand, the textured mat may preferentially improve sensory feedback, which may result in the fine-tuning of proprioception and neuromuscular coordination.
The detailed analysis of muscle activation illuminated the textured mat’s capability for targeted muscle training. Despite a general reduction in muscle activity relative to the foam surface, the textured mat significantly bolstered activation in specific muscles - VM, MG, and TA during double-leg stances, and the TA alone during single-leg stances - when contrasted with the firm surface. This pattern of selective muscle engagement highlights the usefulness of the textured mat in the rehabilitation of CAI, particularly to enhance proprioceptive feedback and sharpen the neuromuscular adjustments that are essential for enhanced stability.
Our findings on the impact of textured surfaces on muscle activation are consistent with those of Tan et al.[25], who found that exercises on unstable surfaces, such as a BOSU® Ball or wobble board, led to greater ankle muscle activation compared to rigid surfaces. Both studies highlight the importance of using unstable or textured surfaces to enhance muscle engagement during balance tasks. While Tan et al. focused on functional rehabilitation exercises, our study extends these findings to balance and postural control in individuals with CAI. Additionally, our results regarding the influence of textured surfaces on balance and muscle activation are supported by the findings of Alfuth et al. [2 6]. Their biomechanical analysis of a single-leg stance using a textured balance board, compared to a smooth balance board and the floor, demonstrated that textured surfaces can significantly enhance proprioceptive feedback and muscle engagement, leading to improved stability during balance tasks. This further aligns with our findings that textured surfaces are beneficial in rehabilitation and training programs aimed at improving balance and postural control, particularly in individuals with CAI.
Contrasting our results with prior research, such as the studies conducted by Hatton et al. [27] and Palluel et al. [28], which reported a minimal impact of textured surfaces on postural parameters and EMG activity. Our study delineates that the textured mat has a subtle yet significant influence on muscle activation, which appears to be insignificant on firm surfaces. This variance might derive from our study’s unique focus on material and texture density, alongside the intentional stimulation of slow-adapting type I mechanoreceptors, known for their distinct response to variations in contact area size and shape [18, 29]. Furthermore, the location of receptive fields is randomly distributed across the plantar surface. Therefore, a higher concentration of texture can be beneficial in identifying subtle variations in the distribution of plantar pressure [29]. These findings suggest a sophisticated mechanism by which the textured mat amplifies sensory feedback more effectively than previously studied surfaces.
The CNS’s processing of afferent information from diverse receptors to regulate balance and posture emphasizes the critical role of sensory input in postural control maintenance [14]. Our study suggests that the textured mat’s design could circumvent the sensory redundancy often associated with double-leg conditions, thereby magnifying the mat’s influence on proprioception and neuromuscular control [30]. The omission of visual cues in closed-eye conditions likely heightened the mat’s sensory impact, illustrating textured surfaces’ potential to significantly contribute to rehabilitation by exploiting the body’s adaptive sensory processing capabilities for balance and stability improvement [30].
Our findings add depth to the discourse on selecting rehabilitation surfaces for CAI, advocating for a personalized approach that accounts for the individual’s rehabilitation phase. The textured mat emerges as a promising option in early rehabilitation stages, offering balanced proprioceptive feedback and muscle activation without substantially destabilizing balance, laying the groundwork for advancing to more demanding exercises on foam surfaces.
The strengths of our investigation lie in its pioneering analysis of textured mats for CAI rehabilitation and its methodological rigour in reducing participant variability while assessing multiple lower limb muscles to gauge the mat’s overall impact on neuromuscular activation. However, the main limitations of the study include the focus on individuals with unilateral CAI, which may not fully represent the variability seen in those with bilateral instability or other balance disorders. Another limitation is the use of a single type of textured mat, which restricts the ability to generalize the findings to other types or densities of textured surfaces. Furthermore, the study only assessed immediate effects and did not evaluate the long-term impact of textured surfaces on muscle activation and postural control. These limitations should be considered when interpreting the results, and future research should aim to address these gaps to provide a more comprehensive understanding of the effects of textured surfaces.
Conclusions
In summary, this study highlighted the importance of selecting suitable surfaces for CAI rehabilitation, focusing on their impact on muscle activation and postural control. The textured mat proved beneficial by enhancing activation in key lower limb muscles while controlling CoM acceleration. This suggested its value in tailored rehabilitation programs by facilitating both proprioceptive enhancement and targeted muscle strengthening. Future research should explore various textured surfaces across diverse patient populations to refine our understanding of surface characteristics in rehabilitation and improve individualized treatment strategies.