Introduction
A woman’s body undergoes considerable physiological and biomechanical changes during pregnancy to accommodate a growing fetus and gain weight [1], primarily in the lumbopelvic area [2]. Lumbar lordosis refers to the lumbar vertebrae and intervertebral discs wedging together to generate the spine’s ventral curvature between the first lumbar vertebra and the first sacral vertebra [3]. Over time, an abnormally curved spine can cause an imbalance in muscles due to increased stress on the body [4, 5]. Exaggerated curvature of the lumbar spine, or lumbar hyperlordosis, is one of the most significant postural abnormalities of the spinal column [5]. The normal lordosis angle is 30°, and any angle exceeding 40° is considered hyperlordosis [3]. These changes stress the ligaments and muscles in the lower back and pelvis, which complicates the body’s ability to transfer weight, lowers pelvic stability [5, 6], and causes a shift in the centre of gravity (COG). As the fetus grows and shifts its COG forward and upward, the spine must adjust to maintain stability [5], causing significant strain on the lower back and a transfer of the COG [4]. Pregnant women have a swayback posture [4], and when the upper trunk travels posteriorly to the lower body, it shifts the COG posteriorly and increases muscle tone in the head and neck, causing the head to shift anteriorly to compensate and prevent falls [5]. Therefore, it’s probable that changes in balance during pregnancy result from a reduced capacity to use one or more sensory systems for balance control [7].
Compared to healthy, non-pregnant female controls, pregnant individuals need more vision for balance [8]. Balance instability increases with gestational age when the eyes are closed, as muscle torques adjust constantly in response to sensory input from the vestibular, ocular, and somatosensory systems [8]. Furthermore, pregnancy contributes to joint laxity and fluid retention changes that compress soft tissues [9]. Due to physiological and biomechanical changes, pregnancy affects the kinematics of several joints [9]. Additionally, the general laxity of joints and changes in COG, particularly in the third trimester of pregnancy, may impact the kinematics of the temporomandibular joint (TMJ) [9, 10].
The TMJ is a multidimensional system connecting the neck, head muscles, and ligaments [10]. Therefore, postural deviation during pregnancy leads to changes in spinal configuration [5-9], which have a direct and indirect connection to the TMJ [11]. Temporomandibular disorders (TMD) may develop in pregnant women as a result of increased stress on the spine and TMJ muscles [11]. Clinical documentation shows that TMD is associated with neuromuscular and musculoskeletal disorders that affect the TMJ and masticatory muscles [11]. Furthermore, increases in oestrogen, progesterone, and relaxin levels during pregnancy [9] cause TMD [12]. These changes alter TMJ laxity and TMJ ligament flexibility. Another theory suggests that oes- trogens amplify certain TMJ inflammatory responses. During pregnancy, altered sleep patterns and body changes may also affect brain arousal [10], which can exacerbate teeth clenching, increase stress on the neck and shoulder muscles, force the TMJ to thrust forward violently, cause jaw sprains, and strain the ligaments that support the jaw muscles [12].
There is a lack of reliable research on pregnant women with TMJ kinematic changes and TMD. As such, this study compared changes in the lumbopelvic parameters during all trimesters of pregnancy and the postpartum period, as well as their impact on the TMJ. In addition, we aimed to identify coincidental disorders during pregnancy and reduce TMJ disorders by collecting comprehensive data and integrating it into antenatal and postnatal rehabilitation classes. The study assumed a significant difference in lumbopelvic parameters, TMJ kinematics, and TMD between pregnant and nulligravida women, which increases with pregnancy progression. Therefore, we determined the existence of these differences and their relationship to various trimesters and postpartum.
Material and methods
Participants
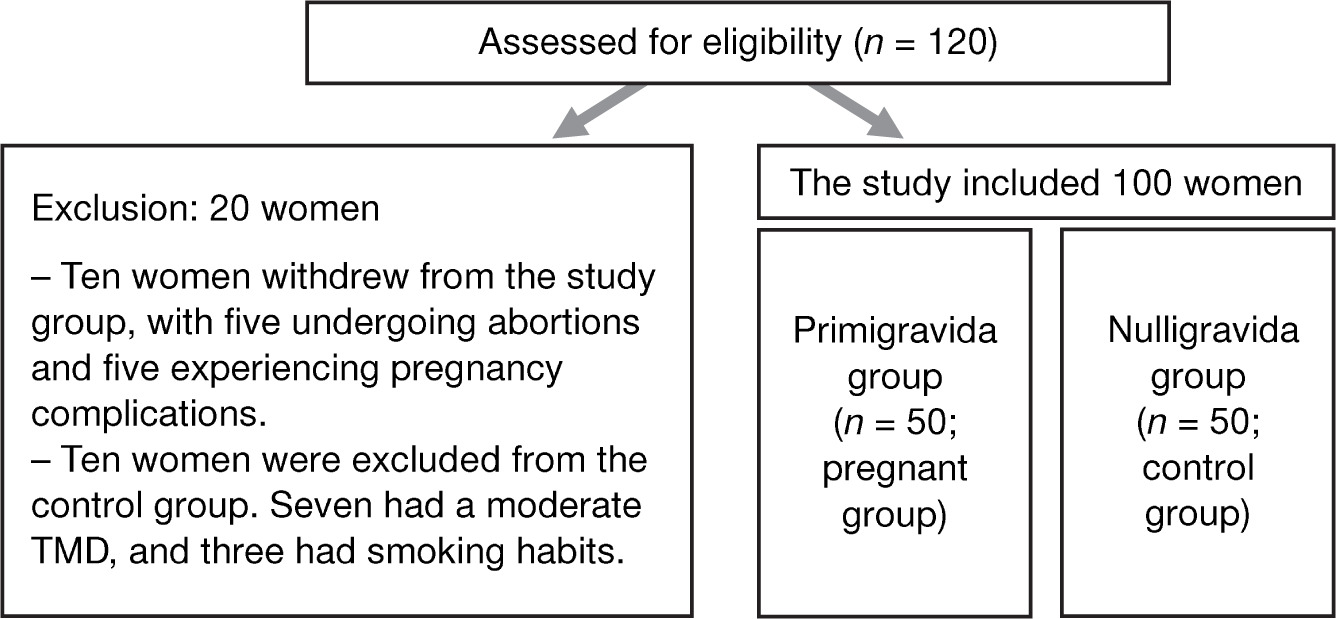
In this case-control study, the researcher conducted all assessments for both groups (pregnant and control groups) between October 2021 and October 2022. The pregnant group included 50 primigravida women, with 10 excluded because of abortion or pregnancy complications. The control group included 50 nulligravida females, with 10 excluded due to moderate TMD and smoking habits (Figure 1). The researchers recruited participants from the Elhosary Women’s Health Government Center in Giza, using flyers and in-person interviews. Demographic information, such as age and height, was collected, and inquiries were conducted into reproductive history, pregnancies, and hormonal treatments received within the previous six months.
Figure 1
A flow chart detailing the patients evaluated for eligibility and then incorporated into the research
Inclusion criteria were age 21 to 25 years, a body mass index (BMI) between 24 and 25 kg/m2, first pregnancy without complications, and a mean weight gain of 15 kg during pregnancy. The inclusion criteria for the control group were the same as the pregnant group, except that they had never experienced pregnancy or weight gain.
Exclusion criteria were a history of smoking or drug use, pregnancy complications, history of orthodontic, gynaecological, obstetric, and pelvic disorders, participants with general health problems, previous surgeries (orthognathic, orthopaedic), or systemic and neurological diseases. To decrease obesity hazards for the pregnant group based on biomechanical variables, the researchers excluded weight gain greater than 15 kg during pregnancy. The exclusion criteria for the control group were the same as those for the pregnant group, except for the related pregnancy issues. Also, the weight gain role never exceeded the normal BMI for those in the control group.
Questionnaire
During recruitment, the researchers collected personal information such as age, height, weight before pregnancy, and the number of previous births. Participants were given an S1 file containing a copy of the questionnaire, which was available in English and Arabic. The survey recorded weight, general health history, and gynaecological and obstetric history.
Procedure and outcome measures
Participants were thoroughly evaluated to ensure they had no existing health problems or conditions that could affect the results. During a pilot test with 10 people (5 in each group; Pillai V = 0.16), we used a data recording sheet to collect demographic information. This information was then left out of the final analysis so that we could find clinically significant differences between the groups. The main goals of the study were to look at biomechanical variables (lumbar angle, pelvic angle, and pelvic rotation), TMJ kinematics (vertical opening, lateral opening, and protrusion), and TMD. Patient interviews were used to gather index classification data (Fonseca questionnaire) and weight measurements. Due to the procedure’s nature, the analyst and therapist blinded the data, conducting evaluations solely for the outcomes. The variables were measured three times. The same examiner completed three assessments, recording the average between the trials at the end of each trimester, three months postpartum for the primigravida group, and the end of the corresponding menstrual cycle for the control group.
Body weight and height
To determine participant weight and height, each was asked to stand on a scale with their eyes facing forward, wearing light clothing, and barefoot [13]. Fur thermore, it was ensured that the weight gained during pregnancy was less than 15 kg, and the gestational age was calculated by adding nine months and seven days to the first day of their last menstrual cycle [14]. The 15 kg increase was specific for the pregnant group only and not the control group, out of courtesy [14].
Lumbar parameters
A No-Leak PT Inclinometer consisting of a rounded plastic inclinometer with a 360-rotating dial and a fluid indicator (SenseAid, NY, USA) (Figure 2) measured the lumbar angle. The process of measuring the lumbar angle involved palpation of the T12-L1 and L5-S1 spinous processes in standing participants and marking them with adhesive reflective markers. Next, the researcher firmly placed the inclinometer in the inter-spinal spaces, set its dial at T12 to zero degrees, and located it at L5 to determine the lumbar degree. The neutral angle values for the lumbar angle typically range between 20°-40° [3-6]. The bubble inclinometer, a popular tool for measuring the lumbar angle, has excellent intra-rater reliability (ICC = 0.92) [3]. Additionally, studies have observed the inclinometer’s reliability in measuring lumbar lordosis in healthy subjects, with ICC values ranging from 0.90-0.95.

Pelvic parameters
A mounted protractor calliper dial and palpation meter (PALM) (Performance Attainment Associates, MN, USA) (Figure 3) accurately measured pelvic inclination and rotation angles [15, 16]. The protractor was a semi-circular arc with a gradation of one degree on either side of the midline. To ensure precision, the researcher stood next to the participant in a standing position and assessed the anterior superior iliac spine (ASIS) and posterior superior iliac spine (PSIS) on both sides of the pelvis using the tips of the calliper arms. The researcher first palpated the area to identify the ASIS and PSIS and then applied adhesive reflective markers for enhanced accuracy. The protractor then measured the right and left pelvic inclination angles, and the difference in the pelvic tilt angles was recorded to obtain the pelvic rotation angle. This method’s intratester reliability stands at ICC = 0.88. The mean pelvic tilt angles ranged from 13 ± 6° [16].

Temporomandibular joint kinematics
The method of measuring the mandible’s range of motion was accurate and precise, with 300 mm 0.05 1/128 electronic digital callipers (Figure 4) used to provide a direct digital reading of the distance measured (Tri Circle, Shanghai, China) [17]. The calliper had two scales, one calibrated in inches and the other in cm with 10 mm gradation, ranging from zero to 12 inches and zero to 30 cm, respectively [17]. With a reading error of only 0.05 mm, we ensured that measurements were as precise as possible. For safety purposes, the calliper was sterilised before and after each assessment [17, 18]. During the physical examination of mandibular motion, the expected minimum range of vertical opening motion was 40 mm [17]. To measure the participant’s vertical opening, the researcher asked them to open their mouth as far as possible while sitting comfortably with a neutral neck position and used the digital calliper to measure the distance between the incisal edges along the midline of the upper and lower central incisors. One end of the calliper was placed against the incisal edge of one of the central incisors, and the other end was against the incisal edge of the opposing central incisor [17]. The protrusion measurement started from the physiological resting position of the jaw when the space between the maxillary and mandibular teeth averaged 3 mm. The participant was instructed to move their mandible forward without making tooth contact. Then, the space between the incisal edges of the mandibular central incisor and the maxillary central incisor was measured. The average range for protrusion is 6-8 mm [17]. Lateral deviation measurement started from the physiological rest position, and the participant was instructed to move their mandible toward the right and left as far as possible. Then, the distance from the labial incisal embrasure of the maxillary central incisor to the labial incisal embrasure of the opposing mandibular incisor was determined using the calliper. The average range of lateral deviation is 8-12 mm [17] on both the right and left sides. The ICC for mandibular movements was 0.9.

Clinical index classification (Fonseca)
The Fonseca Anamnestic Index is a widely used tool for evaluating the extent of TMD in epidemiological investigations [19, 20] and was used solely as an outcome measure. The questionnaire comprises ten questions, with three answer options (yes, no, and sometimes), scored as 10, 0 and 5, respectively. The total score determined the severity of the symptoms. The questionnaire categorised the patients into four groups, including those without TMD (0 to 15 points), mild TMD (20 to 45 points), moderate TMD (50 to 65 points), and severe TMD (70 to 100 points) [18]. The researcher also determined the participants’ level of TMD based on their TMJ movement limitations using several factors, such as pain, tenderness in the masticatory muscles, clicking sounds in the joints when the mouth opens and closes, and clicking sounds with a straight or convex pathway. The Fonseca Anamnestic Index is very reliable, with an ICC of 0.95 [19, 20].
Sample size
The G*Power software program (version 3.1.9.4) conducted a power analysis and determined that an E-test with two groups and four measurements required a minimum of 85 people. The calculation was based on 95% statistical power (I error probability) = 0.05, an error level probability (type I error) = 0.05, and an effect size of F = 0.43. To account for a 15% dropout rate, the sample was increased to 100, with 50 participants in each group.
Statistical analysis
Statistical analysis employed SPSS version 25 for Windows (IBM Corp., NY, USA). The investigation comprised two independent variables, the tested group (between-subject factor), with two levels: the pregnant group (primigravida) and the control group (nulligravi- da). The second independent variable was the testing time (within-subject factor), with four levels: the first, second, third, and fourth evaluation times. The dependent variables were the lumbar angle, right and left pelvic angles, pelvic rotation, TMJ vertical opening, TMJ left and right lateral opening, protrusion, BMI, and body mass. The researchers evaluated the data for normality and homogeneity of variance and verified data normality using the Kolmogorov-Smirnov test. Levene’s test evaluated the statistical assumption of homogeneity of variance between groups. Mauchly’s sphericity assessed the homogeneity of variance within each group. Meanwhile, a mixed-design multivariate analysis of variance (MANOVA) with a 2 x 4 factorial arrangement compared the variables of interest between the pregnant group, the control group, and the first, second, and third trimesters of pregnancy. We used non-parametric Chi-squared tests to determine how often each group’s clinical index classification (Fonseca) occurred.
Results
The indepandant sample t-test showed non-significant differences (p > 0.05) in the demographic data between both groups (Table 1). Pregnancy influenced all dependent variables, including lumbar angle, pelvic rotation, TMJ vertical opening, TMJ protrusion, and TMJ right and left lateral opening (F = 615.853, p = 0.0001). The measuring periods also had a significant effect on all of the dependent variables (F = 864.929, p = 0.0001, partial η2 = 995), while the two independent variables also interacted significantly with each other (F = 871.933, p = 0.0001, partial η2 = 995). As such, the assessment times changed how the tested group affected all dependent variables. Table 2 showed the descriptive statistics for all measured variables in both groups at all time points. The Chi-squred test for the Fonseca index was presented in Table 3.
Table 1
Participant characteristics
| Groups | Pregnant group (mean ± SD) | Control group (mean ± SD) | p-value |
|---|---|---|---|
| Age (years) | 23.05 ± 0.75 | 23.30 ± 0.59 | > 0.05 |
| Height (cm) | 163.60 ± 2.49 | 162.52 ± 3.66 | > 0.05 |
Table 2
Descriptive statistics for all dependent variables between both groups, including three trimesters of pregnancy and postpartum (pregnant group) and four evaluations for the control group
Table 3
The frequency distribution and chi-squared tests of clinical index classification (Fonseca) between groups
The Bonferroni post hoc tests for all dependent variables between the pregnant (primigravida) group and control (nulligravid) group (group effect), as well as the four evaluation times (time effect)
Regarding the group effect, the Bonferroni post hoc tests for all dependent variables between groups were significantly different (p = 0.001) at all time points except for BMI (p = 0.90) and body mass (p = 0.87) at the first trimester/evaluation.
Considering the time effect, the Bonferroni post hoc tests for all dependent variables among all four evaluation points were significantly different (p = 0.001) in the study group. In contrast, the control group showed non-significant differences for all dependent variables at all four evaluation phases (p > 0.05).
Discussion
The current study focused on biomechanical changes in the lumbopelvic complex in response to the growing fetus as pregnancy progressed. Also, the consequences of TMJ kinematic changes and disorders due to general body composition and mechanical alterations through out the trimesters of pregnancy were evaluated. There was a statistically significant difference in biomechanical variables between the two groups. In the pregnant group, there was an increase (p < 0.05) in lumber angle, right and left pelvic inclination, pelvic rotation, TMJ vertical opening, TMJ right and left lateral opening, protrusion, and BMI. Meanwhile, the control group experienced no changes (p > 0.05) in lumbopelvic and TMJ variables or BMI. Furthermore, there were substantial increases (p < 0.05) in the pregnant group compared to the control group across all four measurements, while the frequency distribution indicated that the pregnant group had more clinical signs and indications of TMD than the control group.
The study assumed a significant difference in lum- bopelvic parameters (p < 0.05) and TMJ kinematics, and among the total sample, all pregnant cases experienced some TMD, and few control subjects did. Indeed, the pregnant participants had mild TMD during the first (74%), second (62%), and third (60%) trimesters, though none did during the postpartum period. In the control group, subjects experienced mild TMD at the first (2%), second (4%), third (4%), and fourth (4%) time points. In the pregnant group, approximately 26% (first trimester), 38% (second trimester), 40% (third trimester), and 60% (postpartum) had moderate TMD throughout the assessment, while none of the control group did. With the exception of 40% of pregnant women in the postpartum period, no participants suffered from severe TMD.
The current study found that primigravida women had significantly higher mean values of pelvic tilt and rotation than nulligravida women. This finding is consistent with studies showing an increase in anterior pelvic tilt from 12 to 36 weeks of pregnancy [21, 22]. One explanation for the pelvic shift during pregnancy is that the alignment variations that appear throughout pregnancy may interfere with the pelvic bone’s ability to perform its function, which could result in pain and mechanical changes [21]. As body weight increases by more than 10 kg over 40 weeks of pregnancy, pelvic stability necessitates balancing the pelvic bones. Also, anterior pelvis width is greater in pregnant women than in nulligravida women [4, 21, 22]. Another explanation is that pregnancy-related hormones produce joint elasticity [1], increasing the likelihood of alignment distortion. However, variations in pelvic alignment are more related to hormonal weakening of the ligaments and symphysis during pregnancy [23]. In contrast, other studies have found no significant changes in the pelvic inclination of pregnant women [2].
In terms of changes in lumber angle, the current study found that primigravida women may experience lumber angle distortions more than nulligravida females. Previous research noted increased lordosis in the third trimester of pregnancy compared to nonpregnant participants [15]. As for lumber angle changes, as pregnancy progresses, lordotic angles [22] increase because of the ventral shift in the COG [7], which alters spinal alignment and muscular balance [8]. Lumbopelvic alignment alterations may occur due to increased backloads that affect rib position [22], which can occur through the non-uniform distribution of body weight and joint loosening. According to Conder et al. [4], the trunk changes posture during the third trimester due to increased growth hormone production and weight gain, which is in line with our finding that pregnancy affected body alignment during the second and third trimesters [21]. Elevated levels of the relaxin hormone, which peak between 12 and 14 weeks of pregnancy, can cause augmented ligament softness and affect the muscles and curvatures of the body [23]. Furthermore, these changes in relaxin levels can cause the spine to be out of place and cause pain [4].
In terms of TMJ kinematic changes, primigravida women had more mobility in their TMJ than the controls. A possible biomechanical explanation is that during pregnancy, the ventral shift of the COG causes changes in the spinal muscles [7, 8]. When the TMJ connects muscles and ligaments to the cervical region, it creates the “craniocervical-mandibular system,” an accessible complex [24]. The biomechanical change elevates the shoulders and alters the shape of the spine, causing cervical lordosis, thoracic kyphosis, and lumbar lordosis to increase in size to compensate [25] because the thoracic curve depends on the lumbar lordosis and C7. On the other hand, thoracic kyphosis can alter the appearance and orientation of the lumbar lordosis and pelvis [25]. Hence, cervical spine postural changes can cause TMD and vice versa [25]. Researchers have found that the cervical spine influences the lumbopelvic musculature [26], and TMJ hypermobility in pregnant women may be due to increased joint laxity during pregnancy [27]. Additionally, pregnant women experience systemic joint hypermobility throughout the trimesters of pregnancy [10]. The deep facial frontal line, which represents an internal link between the myofascial and visceral fascias, is a possible fascial explanation [26]. The facial line binds the jaw muscle to the foot’s soil, and the pelvic area connects the head of the hyoid and thorax complex to the hip joint, as well as the vaginal, abdominal, and thoracic cavities [26]. As a result, pregnancy-induced modifications in deep facial lines correspond to changes in TMJ [25]. Ligaments that are too loose in the second and third trimesters of pregnancy primarily cause hypermobility [23], which makes the TMJ less stable and leads to movement alterations [10].
Regarding TMD during pregnancy, the current study showed a statistically significant increase in TMD in primigravida women compared to controls. There were also significant differences throughout the trimesters. During pregnancy, changes in the head forward position can generate excessive strain on the masseter and digastric muscles, leading to an unbalanced TMJ [25, 27]. This imbalance can have a descending-chain effect on the body’s posture, and the mandibular condyle may move backwards, resulting in TMD [26, 28]. Also, morning sickness, a common occurrence among pregnant women, can cause forceful vomiting that can strain the jaw muscles and ligaments [1, 27], leading to discomfort and stiffness in the jaw joint [28]. This can exacerbate TMD issues and worsen morning headaches. It is crucial to remain vigilant for potential TMD issues, even though morning sickness typically subsides after the first trimester [28]. Elevated oestrogen levels could be responsible for TMD in pregnant women. Oestrogens increase joint laxity throughout pregnancy, and TMJ laxity may contribute to the development of these disorders [27]. Research has shown that the TMJ tissues centralise oestrogen receptors [1, 27], and as the plasma concentration of female hormones rises during pregnancy, it is reasonable to presume that the prevalence of dysfunctional signs and symptoms will increase [1].
The excess fluid and blood the body produces during pregnancy causes swelling and softens the skin by doubling the amount of fluid present, allowing it to expand as the baby grows [1-23]. After week 20, swelling typically develops and worsens throughout the following weeks until delivery [29]. Swelling of the face and neck may increase jaw strain and the area around TMJ, which could cause pain [29, 30]. However, we observed that pregnant women primarily experienced medium-severity TMJ pain in their ears and heads, with 50% of the second and third-trimester pregnant women showing mild systemic joint hypermobility [10, 28]. Increasing TMD in the postpartum period, particularly TMJ pain, can affect TMJ kinematics and decrease the range of motion due to pain. Various factors can exacerbate this condition during the postpartum period, such as sleep disturbance, emotional issues, and carrying a child, potentially affecting shoulder and neck muscles and increasing TMJ pain [29, 30]. The result of these studies agreed with Koca et al. [30], who revealed that there is an association between self-reported bruxism and myogenic TMD among postpartum women.
The findings of this study have significant implications for healthcare professionals seeking to understand and manage pelvic disorders, TMJ kinematic changes, and TMD in pregnant women. When performing assessments and developing treatment plans, clinicians should take into account the unique biomechanical differences and clinical presentation of pelvic disorders and TMD. Further research in this area is required to understand the underlying mechanisms of pelvic disorders and TMD during pregnancy and develop effective prevention of complications. Additionally, Future studies should compare the changes in the studied variables between primigravida women who gained body mass lesser and greater than 15 kg.
Despite its informative nature, the study had limitations. We did not analyse the hormonal profiles of the participants or measure the thoracic and cervical angles. Furthermore, the study did not evaluate the impact of biomechanical changes and TMD on quality of life. Moreover, the study did not incorporate multigravida subjects (additional functional tests for TMD were necessary to establish a definitive diagnosis and treatment plan for these women). To ensure optimal patient care and grasp the intricate connections between TMJ, TMD, and other body conditions, it is imperative to conduct more comprehensive evaluations and postpartum follow-ups.