Introduction
Movement learning can occur via demonstration and verbal instruction from a professional. then, learning processes retrieve information from visual, auditory, and kinaesthetic inputs [1, 2]. Movement and rhythm can be explained using auditory inputs (sound). Musicians and other professionals who rely on auditory inputs show easier learning using sound and better identification of sound patterns [3]. thus, understanding how humans decode and interpret sound waves is crucial.
The perception of sound is a particularity of the auditory system. Sound is mechanical waves propagating through the environment, sensed as vibrations in the liquid of the inner part of the ear, and then transformed into electrical impulses that are decoded in the central nervous system [4]. Recently, a mechanism called neural entrainment has been proposed to elucidate the role of auditory inputs in learning. It explains the synchronisation of neural responses with external rhythmicity, facilitating sound perception during movement [5].
Running is a cyclic and rhythmic activity. the sound emitted by a footstep is unique and generated by the foot–ground interaction, with frequencies ranging from low to ultrasound [6]. Phan et al. [7] demonstrated that sound could be used to assess the ground impact and joint overload during running. they indicated that running with less sound intensity decreased the ground reaction forces and altered the hip, knee, and ankle kinematic variables. Moreover, the combination of lower impact during running, weekly running distance, running speed, and rest between training could re- duce pain episodes after running. therefore, understanding running rhythm using auditory inputs may improve the overload and movement quality of runners.
Kinetic variables provide relevant information about the causes of sports injuries retrospectively. Also, early control over kinetic variables (i.e., impact) may reduce and eliminate pain and injuries [8, 9]. Sonification is a technique to transform biomechanical data (i.e., kinetic variables) into sound. It allows the analysis and interpretation of a condition or a functional task [10]. Sonification of kinetic variables may be applicable for diagnosing, intervening, and preventing pain and musculoskeletal injuries. therefore, this study aimed to identify sound markers that indicate load changes in runners reporting pain after running.
Material and methods
Subjects
Forty-three recreational runners participated in this observational study (15 females, 28 males) (Table 1). they were asked to reproduce the pace adopted in 10 km races for three minutes. the participants did not have a history of injury in the six months before the study assessments. the distribution of foot strike patterns among the participating runners was as follows: 0.7% exhibited a forefoot strike, 43.5% a midfoot strike, and 55.8% a hindfoot strike. Moreover, 11.6% of the runners demonstrated an asymmetrical foot strike pattern, determined with the RunScribe system (USA).
Table 1
Anthropometric data, speed, practice time, weekly distance run, and running experience of participants
Using a participant characterisation questionnaire, individuals were inquired about the presence or not of after running activity over the last month at the usual race distance. Each runner provided a positive or negative response, and if positive, identified the anatomical region where pain was experienced. they were categorised into four groups: without pain (WP); spine or hip pain (SHP); thigh or knee pain (TKP); and leg, ankle, or foot pain (LAFP).
The researchers did not evaluate pain intensity. concerning pain categorisation, the study did not distinguish between unilateral and bilateral pain, nor did it account for the number of segments with pain on the same side. When pain was present in more than one segment, the researchers categorised it based on the most proximal site of the pain.
The running experience was classified using a decision support system using fuzzy logic, as described by Roveri et al. [11]. this system considers four parameters to determine the running experience of recreational runners: practice time in years, training frequency and volume, and participation in races.
Procedures
Plantar pressure
Data on plantar pressure were collected using the interface between the foot, resistive insoles (Flexinfit™, Sensormedica, Italy) with 214 sensors (sampling frequency of 40 Hz) and running shoes. All participants wore the same model of running shoes during the data collection (Run Falcon 1.0, Adidas, Germany, Brazilian sizes 37 to 44). this shoe was characterised as neutral, featuring an EVA midsole with an Asker c 45 (soft) and outsole rubber with a Shore A 65 (medium hard). Additionally, they exhibit densities of 0.22 and 1.13, respectively. the footwear also has a drop (the height difference in the midsole from the heel strike point to the forefoot) of 9 mm.
For familiarisation, the participants were asked to run on a treadmill at a comfortable pace for three minutes. they were then asked to reproduce the pace adopted in a 10 km race for three more minutes. In this phase, data on plantar pressure from the last two minutes were considered for analysis. Data from the sensor insoles were sent via Bluetooth, processed by the Free-Step v.2.01.074 software, and exported for further processing using Matlab©. For plantar pressure analysis, the foot was divided into four regions: lateral and me-dial forefoot and lateral and medial hindfoot (Figure 1).
Figure 1
Representation of plantar pressure and foot areas: (1) lateral forefoot, (2) medial forefoot, (4) medial hindfoot, and (5) lateral hindfoot. Values are presented in kPa
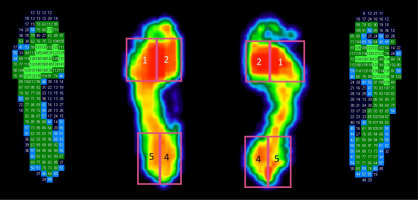
The average peak plantar pressure was calculated using the footsteps during the last two minutes on the treadmill, which refers to the maximum values of each foot area. the investigators used between 200 and 400 steps to calculate the averages for each runner.
Sonification
Sonification of the plantar pressures was performed using the twotone freeware. the researchers selected the c note in the first octave to convert the numerical data into sound corresponding to pressure levels. the sound file was decomposed using the Audacity© software into a spectrogram illustrating the main frequency components and their amplitudes.
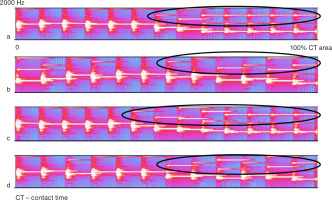
The spectrograms (Figures 2 and 3) associate the sound intensity (i.e., curve colours; white indicates high intensity) with the fundamental frequency relative to the c note in the first octave, (i.e., harmonics on the Y axis and relative time on the X axis). the fundamental frequency was set at approximately 264 Hz by the investigators. the harmonics are waves and multiples of the fundamental frequency. Harmonics are called octaves when presenting a double ratio [4]). the spectrogram from the sonification provided data of the right lateral forefoot and right lateral hindfoot.
Figure 2
Spectrogram of the plantar pressure of the right lateral forefoot for the groups: (a) without pain, (b) spine and hip pain, (c) thigh and knee pain, and (d) leg, ankle, and foot pain. Registered between 0 and 2000 Hz (Y axis)
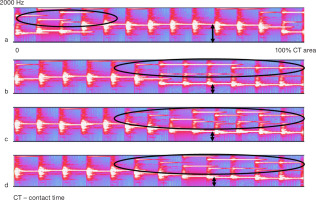
Figure 3
Spectrogram of the plantar pressure of the right lateral hindfoot for the groups: (a) without pain, (b) spine and hip pain, (c) thigh and knee pain, (d) leg, ankle, and foot pain
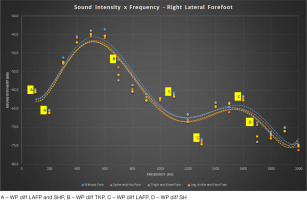
Quantitative data were reported using the frequency spectrum analyses of the sonification. the researchers calculated the averages of data frequencies in 100 Hz intervals for each group. Because the spectrogram showed few records at high frequencies, the range was set between 0 and 2000 Hz. Quantitative data are shown in Figures 4 and 5 in the Results section.
Statistical analysis
The data normality was verified using the Shapiro– Wilk residual test. Subsequently, linearity and data homoscedasticity were tested with Levene’s test. the plantar pressure data were then sonified. this result was transformed from the time domain to the frequency spectrum, and the mean intensity of each group was considered. the comparison between the groups, in the conditions without pain and with pain in the spine and hip; knee and thigh; and leg, ankle and foot, was performed using ANOVA, for independent measures. Possible differences between groups were identified for Bonferroni post hoc tests.
Ethical approval
The research related to human use has complied with all the relevant national regulations and institutional policies, has followed the tenets of the Declaration of Helsinki, and has been approved by the Universidade Federal de São Paulo Research Ethics committee (approval No.: 4825090).
Results
The sonification of the plantar pressures of the right lateral forefoot and right lateral hindfoot are shown in Figures 2 and 3, respectively. Each spectrogram illustrates each group. the other foot areas (medial and lateral forefoot and midfoot) did not differ among the groups. In the right lateral forefoot (Figure 2), WP showed harmonics at the beginning of forefoot contact (spectrogram a). In contrast, participants with pain showed harmonics during the end of forefoot contact. Moreover, the groups presented different main frequencies: WP showed a high frequency after half contact time (spectrogram a), while SHP, tKP, and LAFP showed lower frequencies (spectrograms b, c, and d).
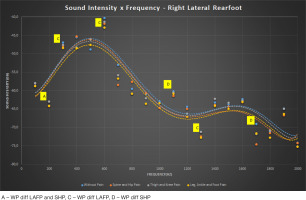
Figure 4 shows the 6th-order polynomial trend curves. they represent the mean sound intensity by frequency (100 Hz intervals) of the right lateral forefoot. Values were obtained from analyses of the spectrum frequencies of the spectrograms. High sound intensity was observed in runners without pain. However, the peak sound intensity occurred at higher frequencies in runners without pain than in those with pain. It was noted that the sound intensity for superficial heel pain (SHP), total knee pain (tKP), and lateral ankle foot pain (LAFP) differed from that of runners without pain (WP) at specific frequencies (100, 200, 700, 1100, 1300, 1600, and 1700 Hz for the right lateral forefoot; and 200, 300, 600, 1100, 1330, and 1700 Hz for the right lateral hindfoot), as indicated in Tables 2 and 3 and Figures 4 and 5.
Table 2
Sound intensity (Db) from the right lateral forefoot. Bonferroni post-hoc identified groups statistically different from WP in frequencies from 0 to 2000 Hz
Table 3
Sound intensity (Db) from the right lateral hindfoot. Bonferroni post-hoc identified groups statistically different from WP in frequencies from 0 to 2000 Hz
Figure 5
Frequency spectrum after sonification of plantar pressures of the right lateral hindfoot for the groups: without pain (WP); spine and hip pain (SHP); thigh and knee pain (tKP); and leg, ankle, and foot pain (LAFP)
For the right lateral hindfoot (Figure 3), WP showed harmonics predominantly in the same frequency range (spectrogram a). SHP, tKP, and LAFP showed a pattern that included harmonics at various frequencies during the end of contact (spectrograms b, c, and d, respectively).
Figure 5 shows the 6th-order polynomial trend curves of the right lateral hindfoot. For all groups with pain except SHP, a higher sound intensity was observed at 500 Hz. the harmonics (between 400 and 600 Hz) were more intense in LAFP than in other groups.
Discussion
The present study aimed to identify sound markers for movement changes in runners. the qualitative and quantitative analyses of the spectrograms indicated differences between the runners with and without pain after running. Qualitative differences were identified in the right lateral forefoot and right lateral hindfoot.
Regarding the right lateral forefoot, participants with pain presented harmonics during the end of contact, also presenting a high sound intensity around the fundamental frequency (300 Hz). WP showed harmonics at the beginning of contact when the fundamental frequency was also observed.
Vicinanza and Williams [12] sonification to analyse the kinematics of healthy runners. Using sound and frequency, the authors observed a specific representation of lower limb coordination, demonstrating the transition between walking and running in the spectrogram, with the curves changing at a certain frequency. Our study observed small differences in the spectrogram curves between runners with and without pain, highlighting the use of sonification to analyse movement. Sonification could also serve as an intervention by using the sound produced during running to stimulate the auditory channel.
Interventions based on the sonification of kinematic and temporal data (i.e., hand grip, foot strength, pull length, and bench slide) were used by Effenberg et al. [13] with indoor rowing. the authors compared rowing among three groups: (i) feedback of the sound produced by a device and a video of a single rower as an example; (ii) feedback with the sonification of interventions and the video; and (iii) a control group watching only the video. the groups with auditory feedback (i and ii) showed better rowing learning than the control group. Furthermore, the group with sonification showed enhanced learning in the variables related to the lower limbs. According to the authors, these variables are associated with movement coordination as a whole, also called ‘lower limbs – trunk – upper limbs’ or whole-body coordination, which is crucial for rowing. Our results suggest that similar movement occurs during running since most movements are related to the foot-ground interaction.
In a review conducted by Schaffert et al. [14], the authors emphasised that athletes can anticipate and predict movements using sound information (emitted by themselves or others) by increasing their alertness to the environment and the behaviour of their opponents. thus, sonification may comprise subtle information and is an alternative to providing feedback to athletes. Different nuances within the same note may offer more information than feedback given by therapists or coaches.
Sonification may be relevant for retraining or correcting movements using the auditory channel to acquire information about the movement. Previous studies showed that auditory feedback increases movement work [13] and optimises movement by enhancing the efficiency of energy expenditure [7,15]. However, according to Phanpho et al. [16], data visualisation during a movement, especially generated by measurement equipment, was less effective in changing the foot-strike. Even though sonification transforms numerical data into sound and provides immediate feedback, identifying flaws in movement efficiency may improve it.
Sonification also offers information about the different foot areas observed in the spectrogram. Runners with pain showed more harmonics during the end of contact in the forefoot. this area has more joints than the hindfoot. Also, during pain, individuals may present movement variations that overload the forefoot. Because the sonification used data on plantar pressures, the loads were assessed and presented as harmonics with higher sound intensity (i.e., white bands in the spectrogram). these results may be due to the mechanism of kinematic compensation, in which injuries in specific joints lead to compensation in other joints [17].
In this study, participants complained of pain after running but did not present an injury. Besides injury, fatigue can alter the foot strike pattern [18] or modify the coordination pattern of several muscles [19]. Also, harmonics may indicate fatigue in specific sound frequencies in runners with pain, which is not visible in the pressure values.
Sonification may be an additional technique for movement analysis and therapeutic interventions. It can be used with other methods, such as visual feedback, to provide information to athletes using many sensory channels. transforming data into sound favours movement correction when verbal commands are imprecise. Moreover, sonification could be optimised if athletes understand what needs to be changed using sounds instead of information from measurement equipment. An ecological alternative for runners is using smartphones and headphones, which can assess biomechanical variables using accelerometers or inertial motion units and transform the data into sounds, providing them with a method of understanding these variables.
Conclusions
Our results indicated differences between runners with and without pain after running, using sonification. Also, the frequency spectrum indicated a difference in the sound intensity produced between groups at specific frequencies. Data sonification translates biomechanical data into sound, and the sensitivity of the auditory channel may indicate differences in move- ments. In this case, sonification indicated plantar overload in runners with and without pain after running.
Sonification may be used for diagnosis and/or intervention. Sound information may address subtle movement corrections, unlike verbal commands. Lastly, sonification helps explore a sensory channel that influences movement learning.

