Introduction
Sports sciences were strongly influenced by the an- alytical approach, in which large quantities of infor- mation, quantitative research methods, and big data serve to study athlete performances [1]. This approach overvalues the athlete’s characteristics as the most important predictors of performance, instead of con- sidering the relationship between the subject and the environment [2]. Studies about the influence of the en- vironment on an athlete’s performance can be devel- oped through different perspectives, considering the birthplace, social environment (e.g., coach, family, and peer influence), the infrastructure and equipment available for training, and the weather characteristics, among others [3, 4].
Endurance sports have been the subject of exten- sive study with researchers using different theoretical and methodological approaches [2, 5]. Recently, triath- lons have received increased attention since they rep- resent one of the most challenging sports practiced worldwide [6–8]. Investigations into triathlon perfor- mance have been developed through different topics, such as nutrition [9], training [10, 11], physics [12, 13], and environmental factors in the prediction of perfor- mance [14]. For triathlons, in which the athletes are constantly exposed to constraints through the race courses, investigating the influence of environmental variables could provide valuable information for ath- letes, coaches, and event organizers [15–17].
From the previous literature, it has been empha- sized that pacing is influenced by wind velocity, topog- raphy, and other competitors [18]. Similarly, hot and humid conditions slow triathletes and increase the rate of withdrawal in the IRONMAN® World Champion- ships in Kona (Hawaii) [19]. However, no data is avail- able on the role the event location has on the IRONMAN® triathletes’ performance, where athletes have to cover 3.8 km swimming, 180 km cycling, and 42.195 km running. Considering the particularities of a triathlon, the role of the event location on the athlete’s perfor- mance can be influenced by different characteristics, including the natural environment (e.g., altitude, tem- perature, and humidity) [5], the type of terrain on the bike course (e.g., hills and turns) [19], and the water temperature [20, 21].
For professional triathletes competing in IRONMAN® 70.3, a previous study showed that lower temperatures and dynamic terrain are important characteristics of some race courses, with better swimming performance achieved in geographically protected and calm waters where the course was straight with a minimum of turns [22]. Thus, choosing the best location may help athletes to improve their performance. We aimed to analyse a large data set, covering a big portion of tri- athlon events worldwide, to identify the fastest race courses for professional IRONMAN® triathletes com- peting between 2002 and 2022. With this knowledge, these professional IRONMAN® triathletes can better select a race course to achieve the fastest race time.
Material and methods
Study design, data set, and data preparation
This is an exploratory study using information ob- tained from the official website of IRONMAN® Triath- lons (www.ironman.com). We considered all the race records from professional IRONMAN® triathletes com- peting between 2002 and 2022 in all IRONMAN® triathlon races held worldwide, as well as the informa- tion related to each specific location. Race record data included the triathlete’s gender, nationality, overall race times, event location, and year. Location data included the type of race course for each split discipline and the average air and water temperatures on race days. After processing the data and cleaning up any invalid records, a resulting set of 7,078 professional race records (4,235 from males and 2,843 from females) from 2,354 unique triathletes from 69 different countries of origin were used for analysis. The data covers a total of 380 IRON- MAN® PRO races celebrated between 2002 and 2022 throughout 55 different event locations. We did not control for the repeat participation of IRONMAN® tri- athletes and instead considered each sample inde- pendent.
Statistical analysis
The distributions of the full race times were checked for normality by plotting their histograms. Records were then aggregated by event location, and descrip- tive statistics, including mean, standard deviation, and minimum and maximum values, were calculated for each location. The statistical significance of the differ- ences in the time between the race locations was in- vestigated with factorial ANOVA tests. A confidence interval of 95% was adopted. We then built a regression model using the XG Boost algorithm, with the triath- lete’s sex and country of origin, the event location, water temperature, and air temperature as predicting vari- ables and the finish time as the predicted variable. The model-agnostic SHAP library was used to inves- tigate how each of the predictors influenced the model output. All statistical analyses were performed with Python 3 (www.python.org/) in a Google Colab note- book (https://colab.google/), both freely available.
Results
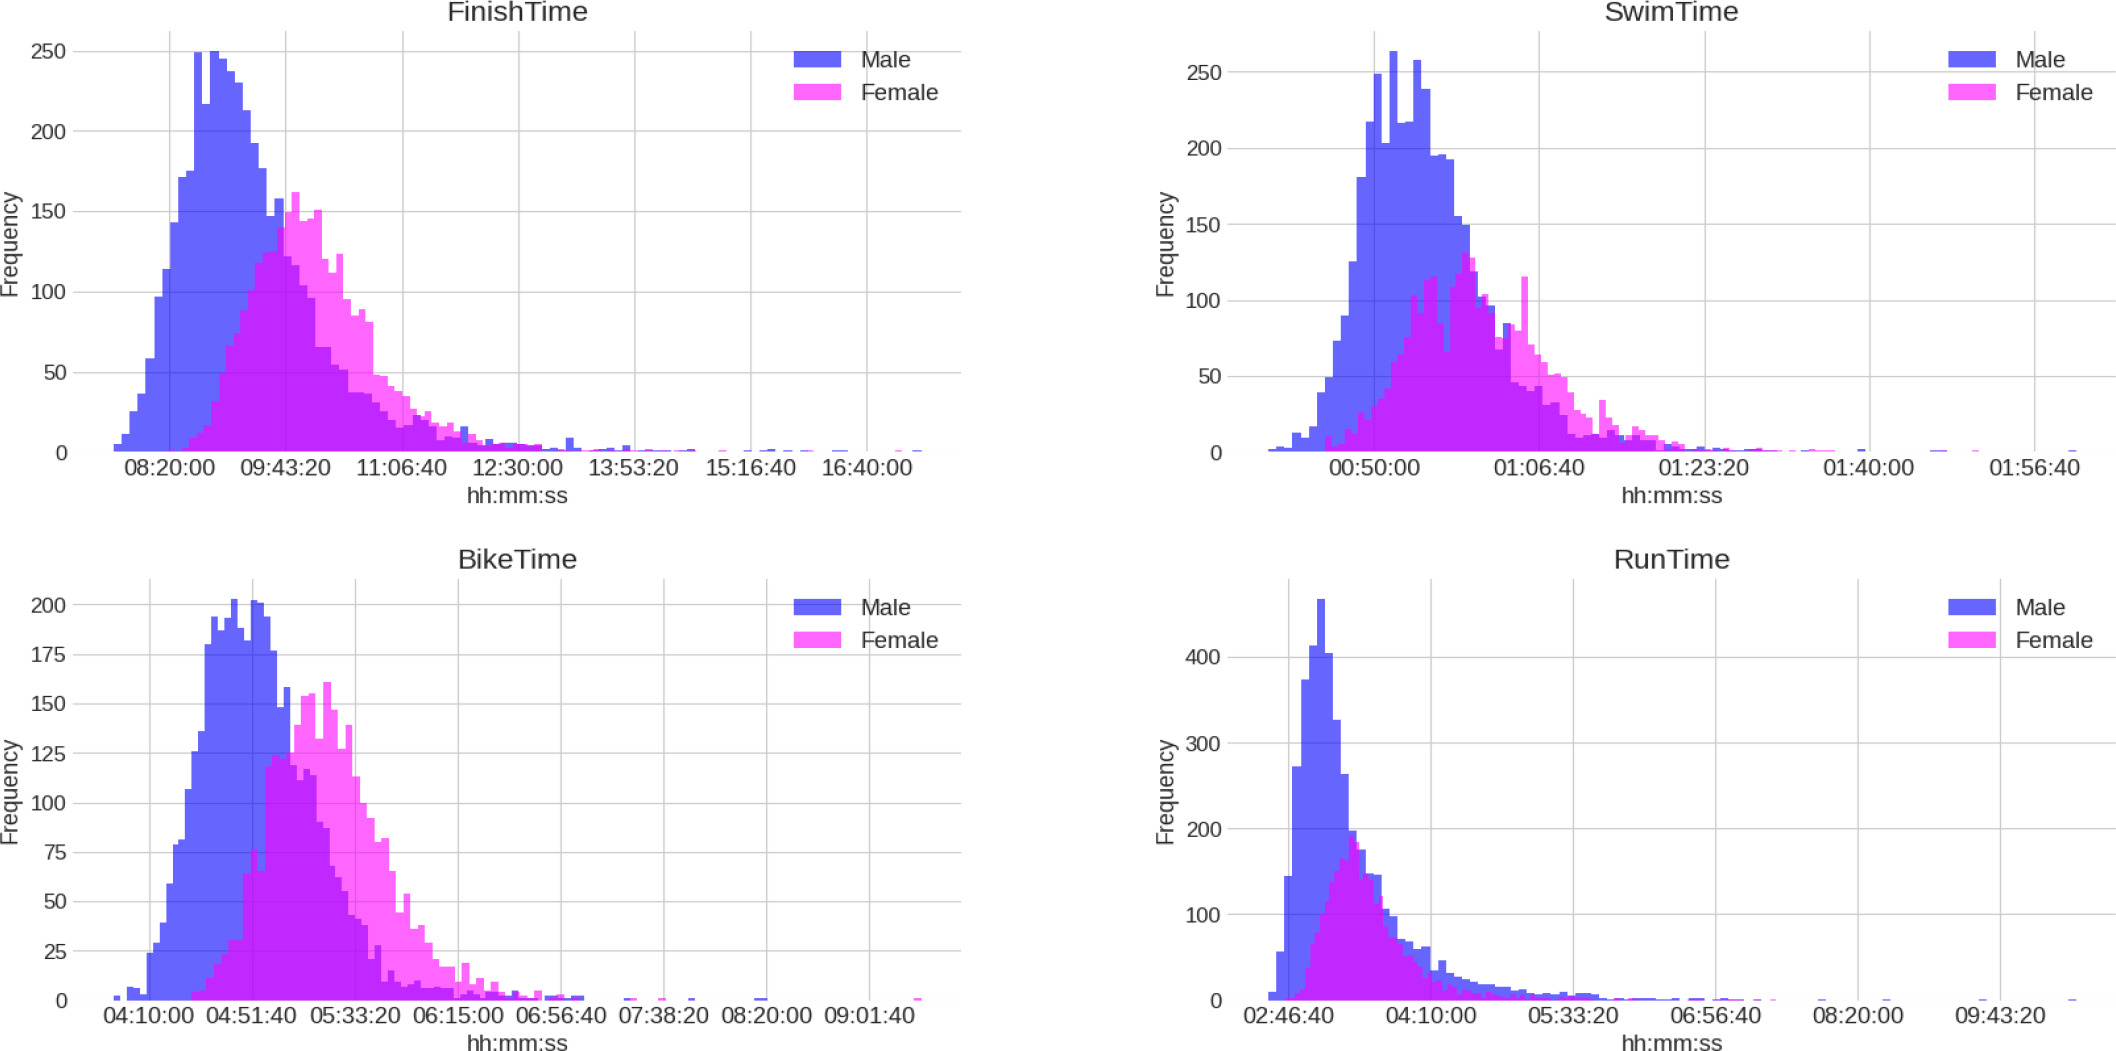
The dataset consisted of 7,078 race records of pro- fessional IRONMAN® triathletes competing in 380 dif- ferent events in 55 different event locations. Table 1 describes these 55 IRONMAN® race locations for pro- fessional athletes along with the number of races, the number of records, and the unique IRONMAN® triath- letes in each of them. The table is sorted by number of records. Figure 1 presents the histograms for the professional IRONMAN® triathletes competing between 2002 and 2022, exhibiting a normal distribution in shapes and similar variances.
Table 1
Details of the IRONMAN® PRO race locations between 2002 and 2022
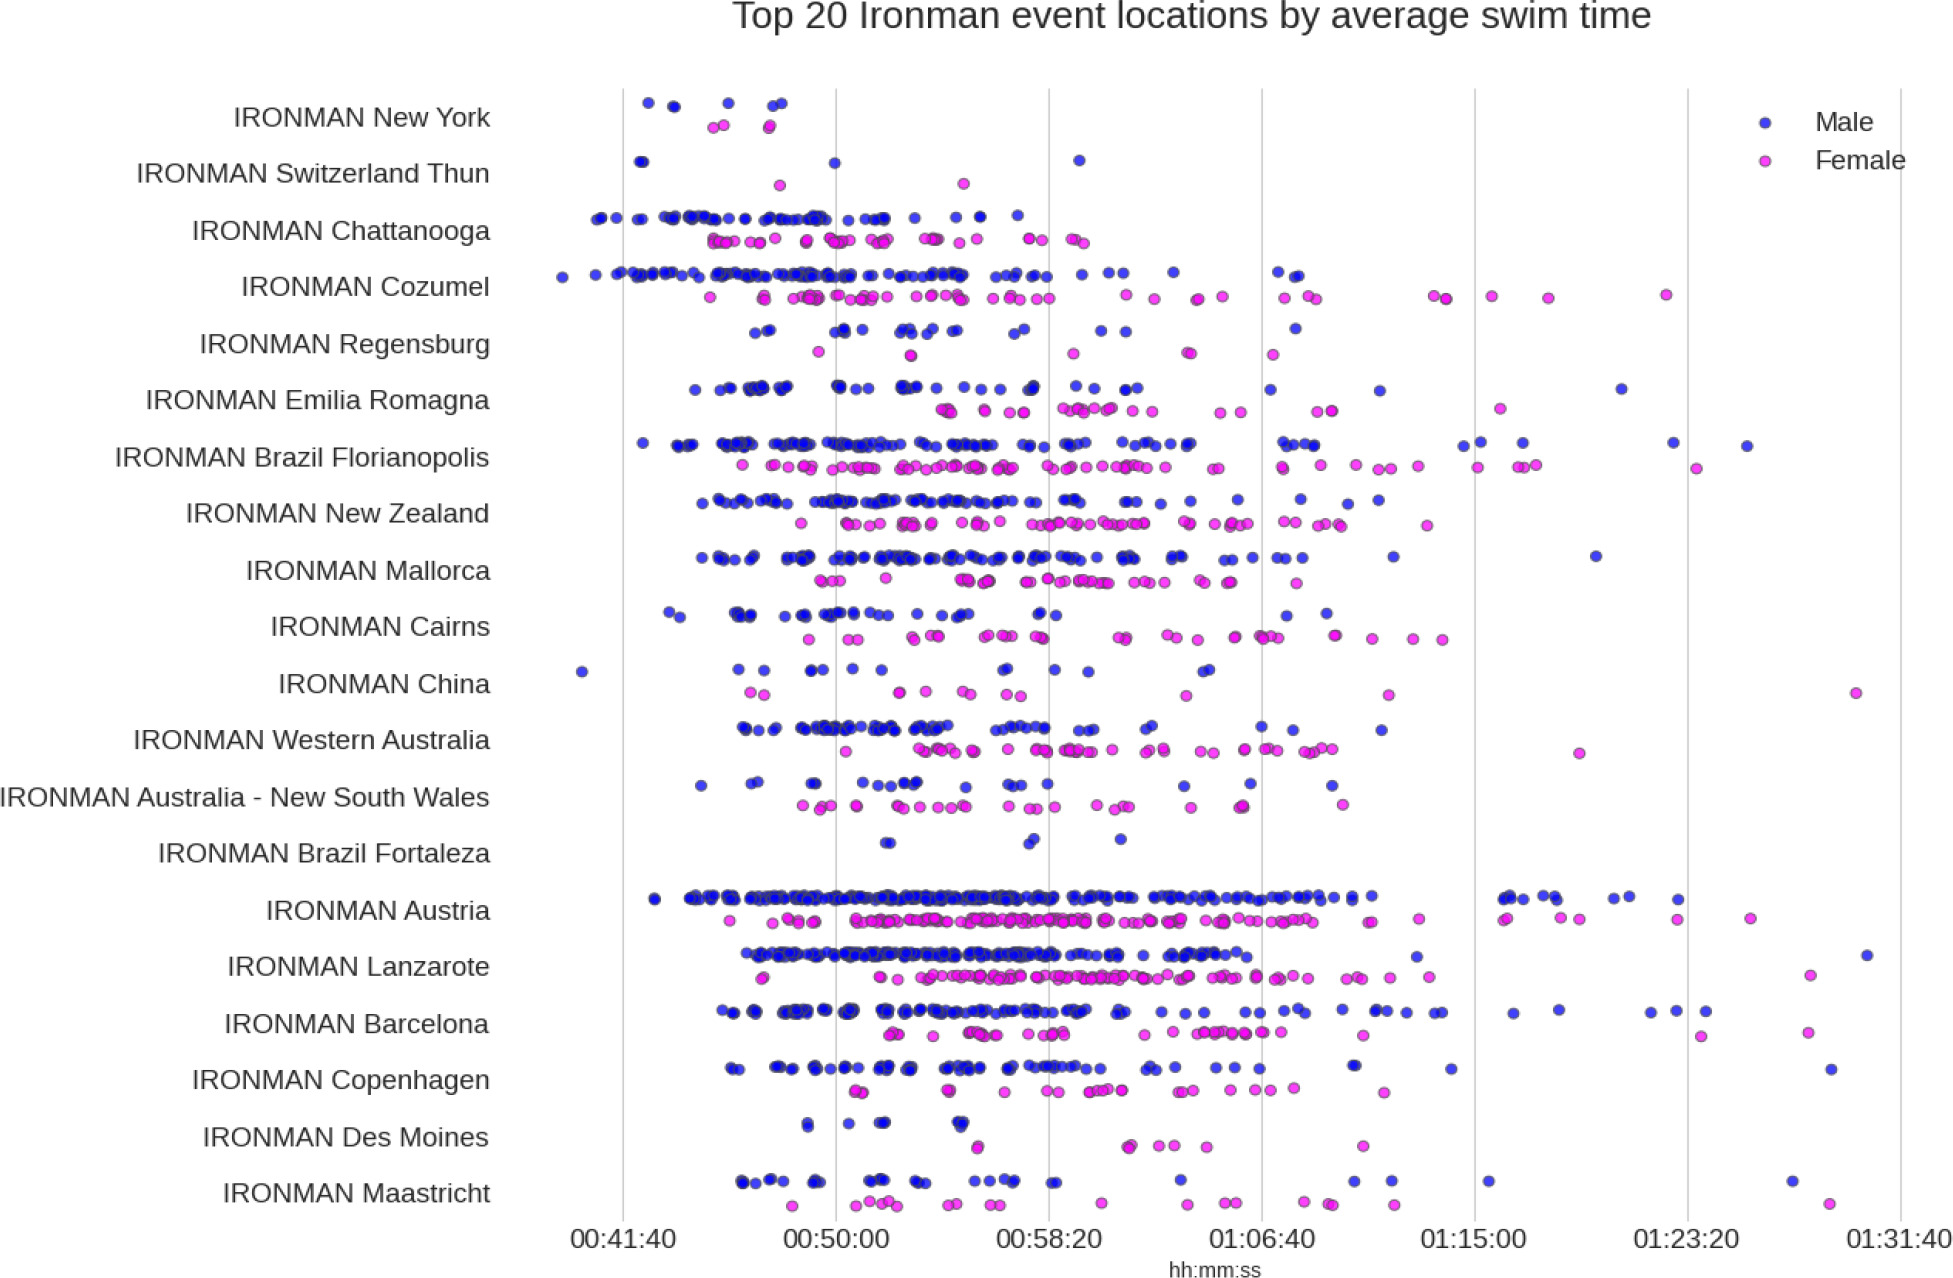
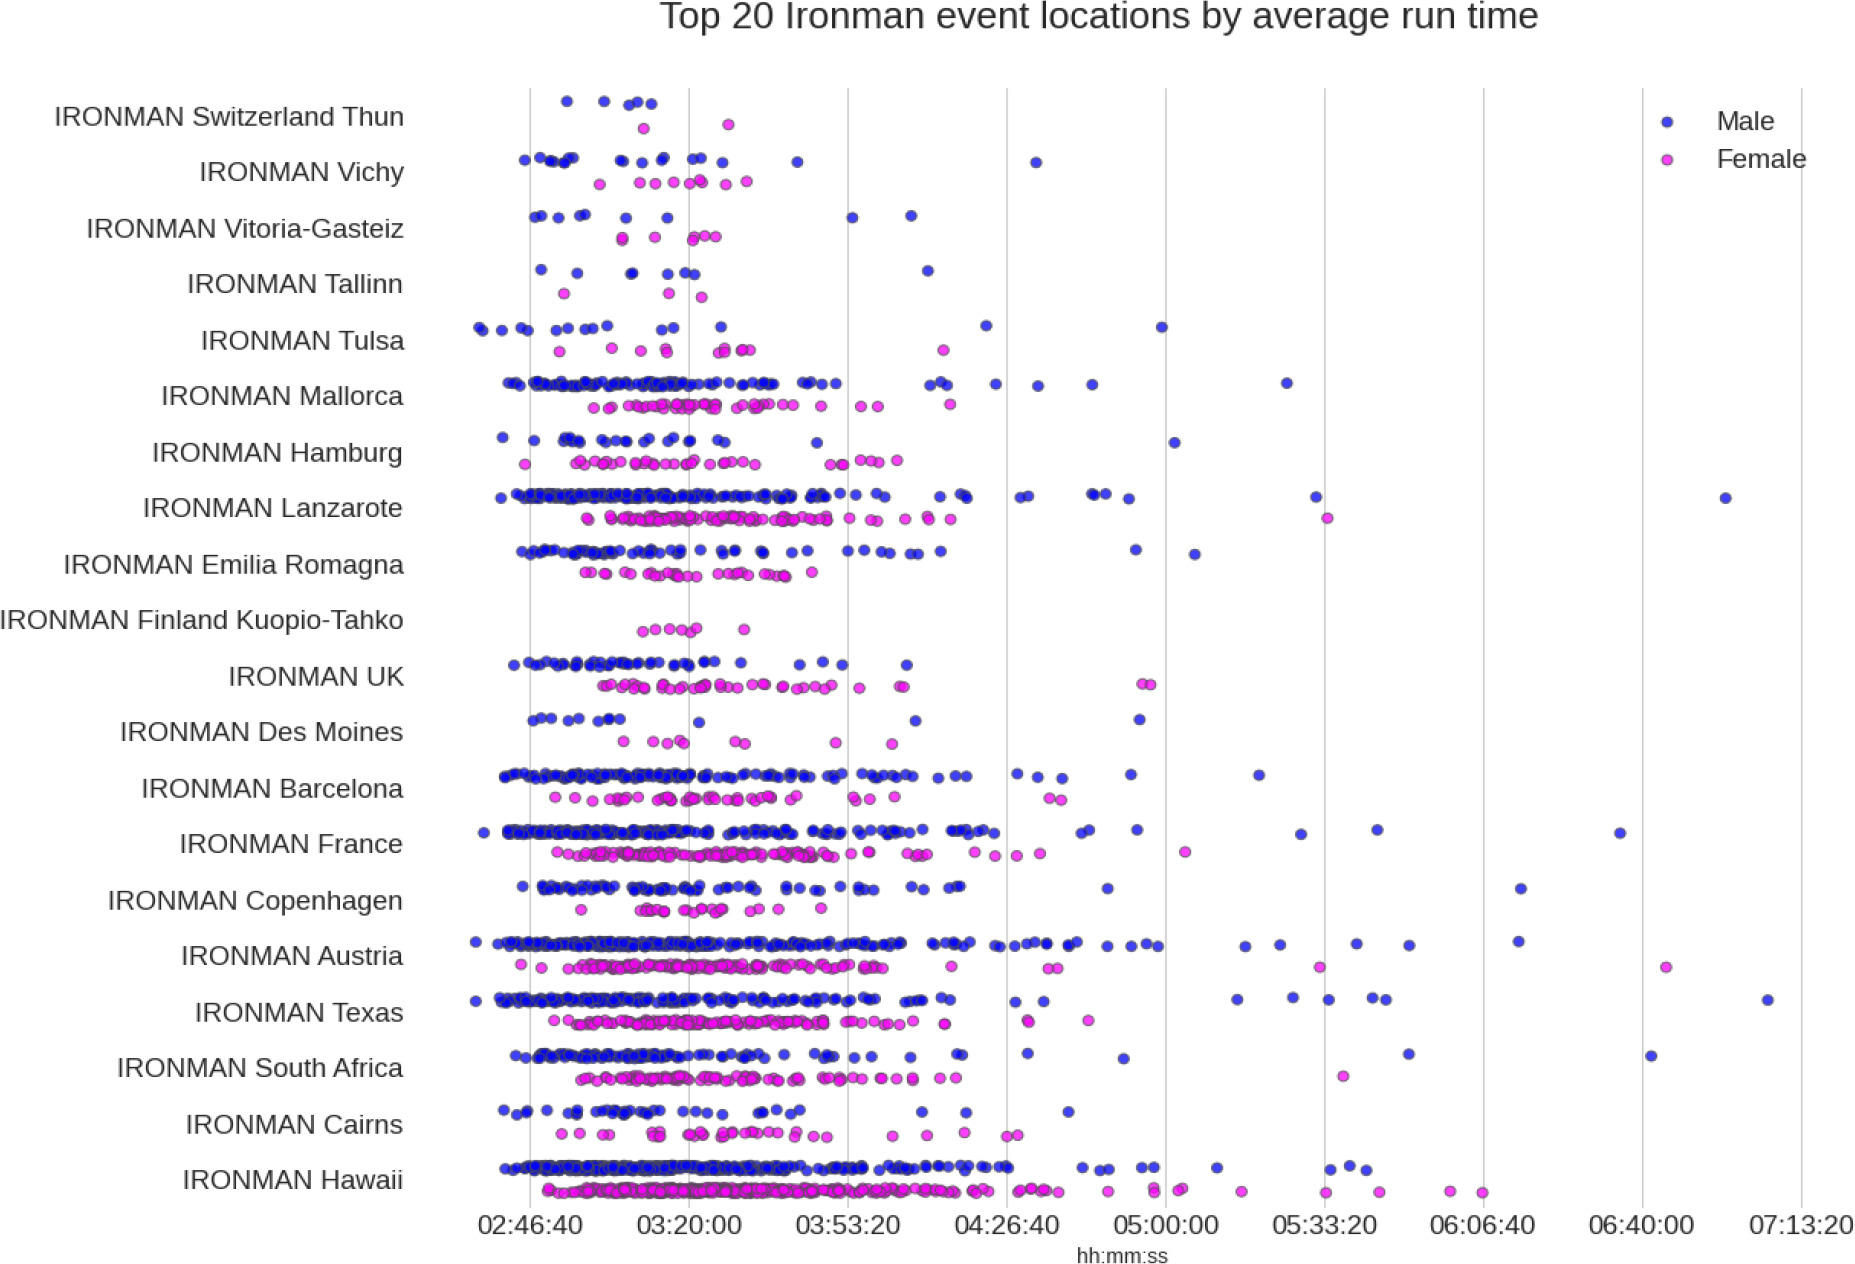
Tables 2–5 and Figures 2–5 present the 20 fastest IRONMAN® race courses based on overall race times and split times, as well as descriptive information for water temperature, air temperature, and basic charac- teristics of swimming, cycling, and running courses. Based on the average finish times, it was possible to verify that the fastest overall IRONMAN® race times were achieved during the IRONMAN® Tallinn (09:00:30 ± 00:40:13 h:min:s), followed by the IRONMAN® Swit- zerland held in Thun (09:01:10 ± 00:22:43 h:min:s), and the IRONMAN® Des Moines (09:03:51 ± 00:47:53 h:min:s, Table 2). The descriptive information showed that for swimming, the first five courses were mainly in a lake (Table 3), while for cycling, it was on rolling or hilly courses (Table 4). For running, most of the courses were characterized as flat (Table 5). The fastest swim courses were found in IRONMAN® New York, IRON- MAN® Switzerland (Thun), and IRONMAN® Chatta- nooga (Figure 3). The fastest cycling courses were in IRONMAN® Des Moines, IRONMAN® Barcelona, and IRONMAN® Tallinn (Figure 4). And the fastest run- ning courses were found in IRONMAN® Switzerland (Thun), IRONMAN® Vichy, and IRONMAN® Vitoria- Gasteiz (Figure 5).
Table 2
Data tables of the 20 fastest IRONMAN race courses based on overall race times
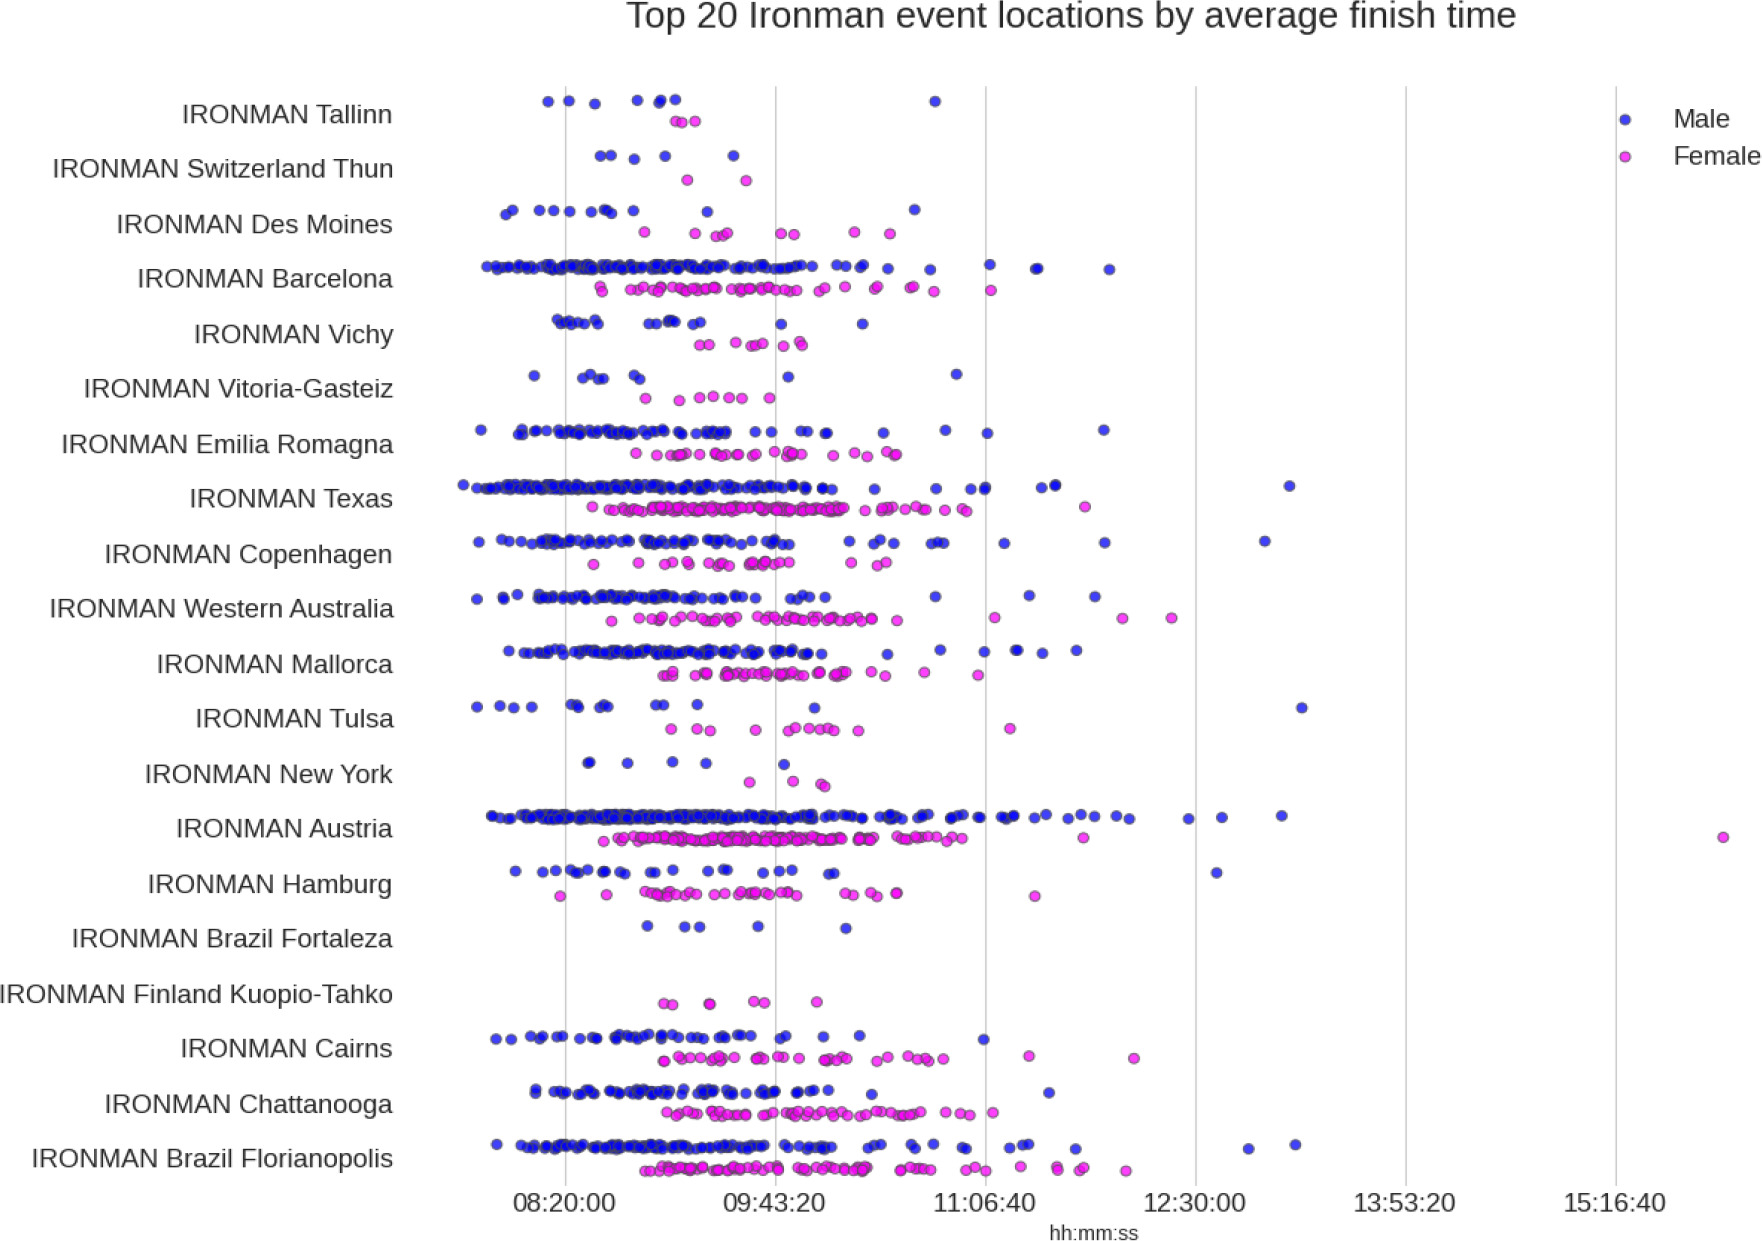
Table 3
Data tables of the 20 fastest IRONMAN race courses based on swimming split times
Table 4
Data tables of the 20 fastest IRONMAN race courses based on cycling split times
Table 5
Data tables of the 20 fastest IRONMANR race courses based on running split times
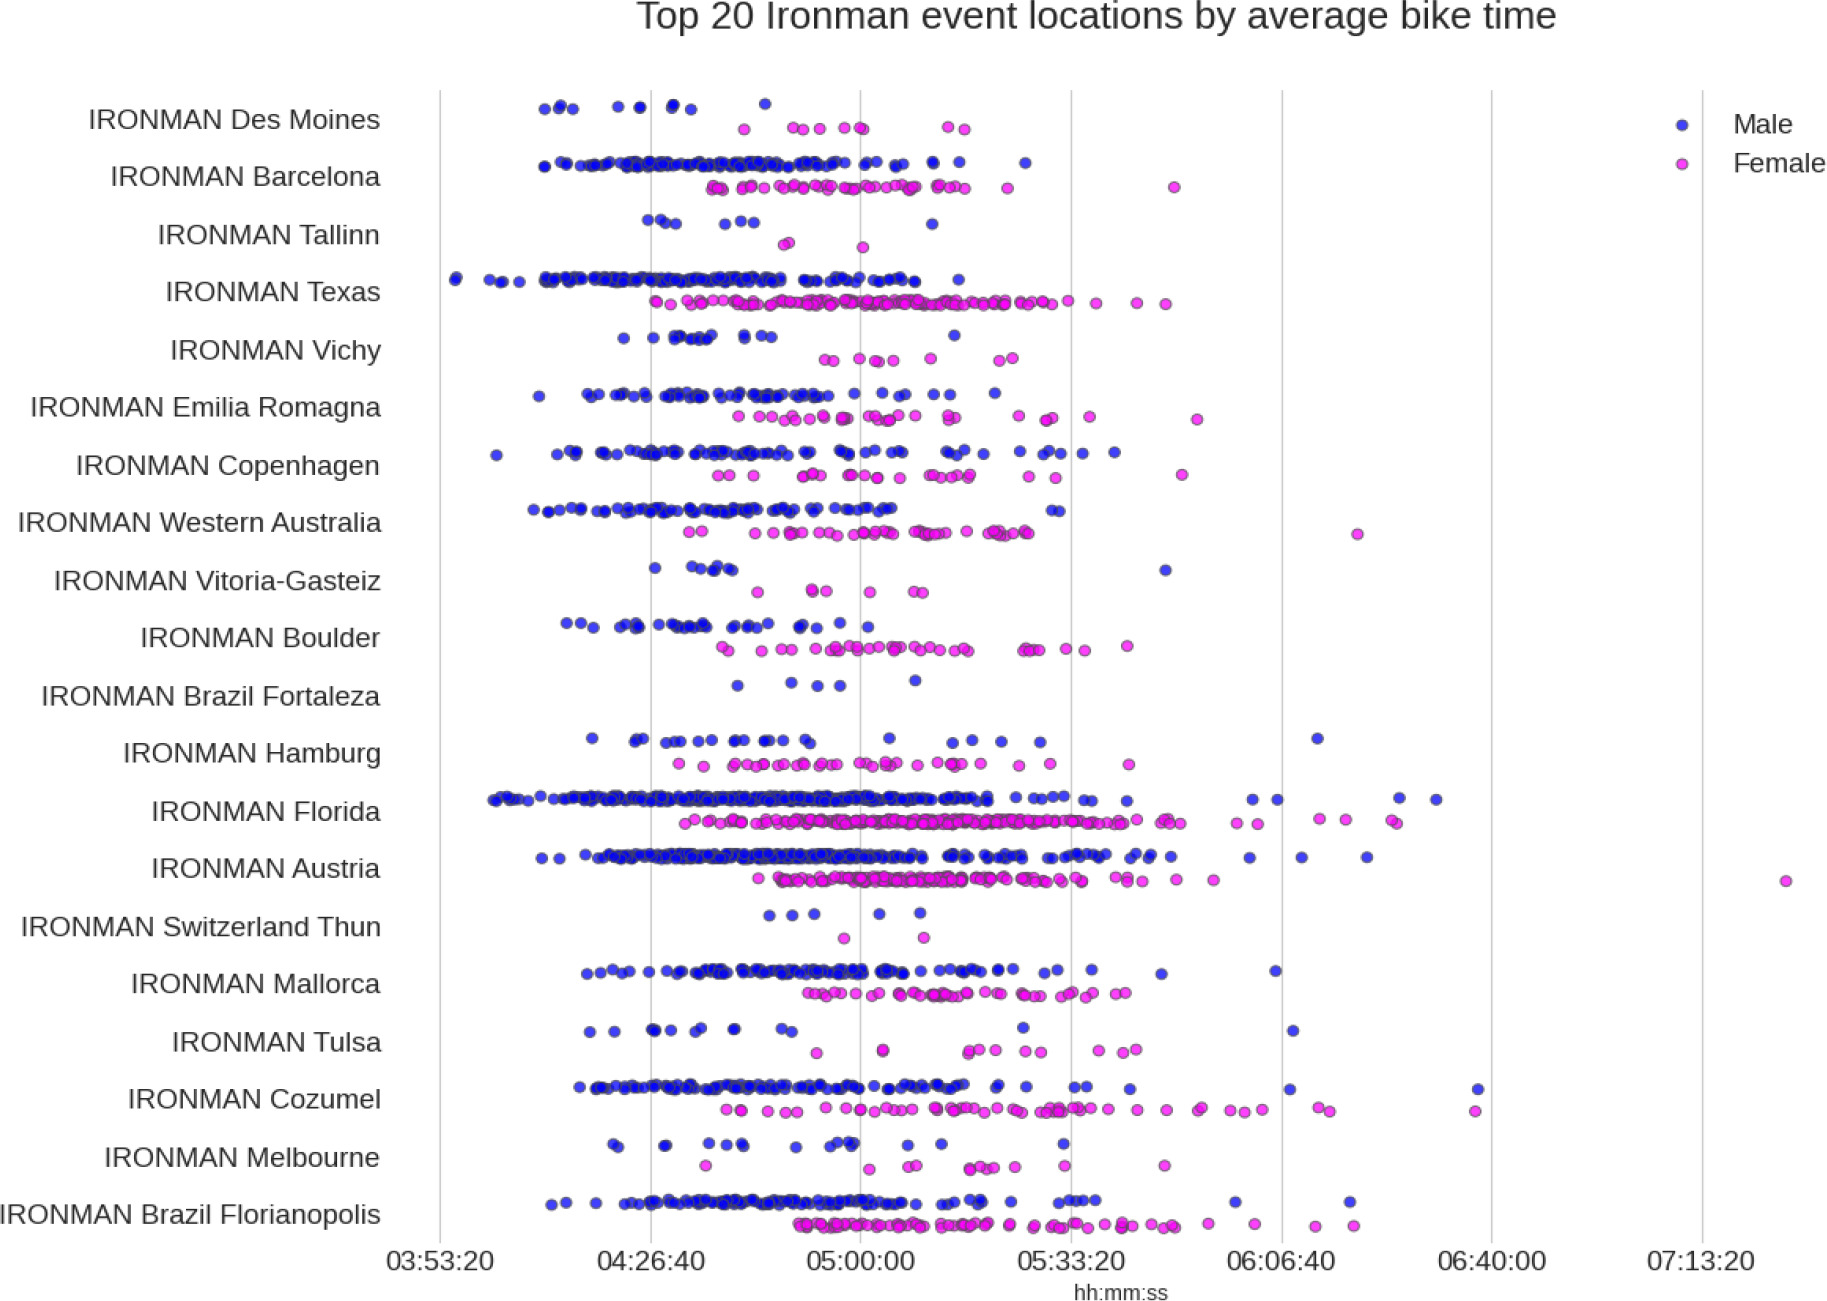
For cycling, there exist statistically significant dif- ferences in the cycling performance between sex groups and (almost) the event locations and race course types (p = 0.0572), as well as their combined effect. All cy- cling course types are represented in the top positions, including rolling, hilly, and flat.
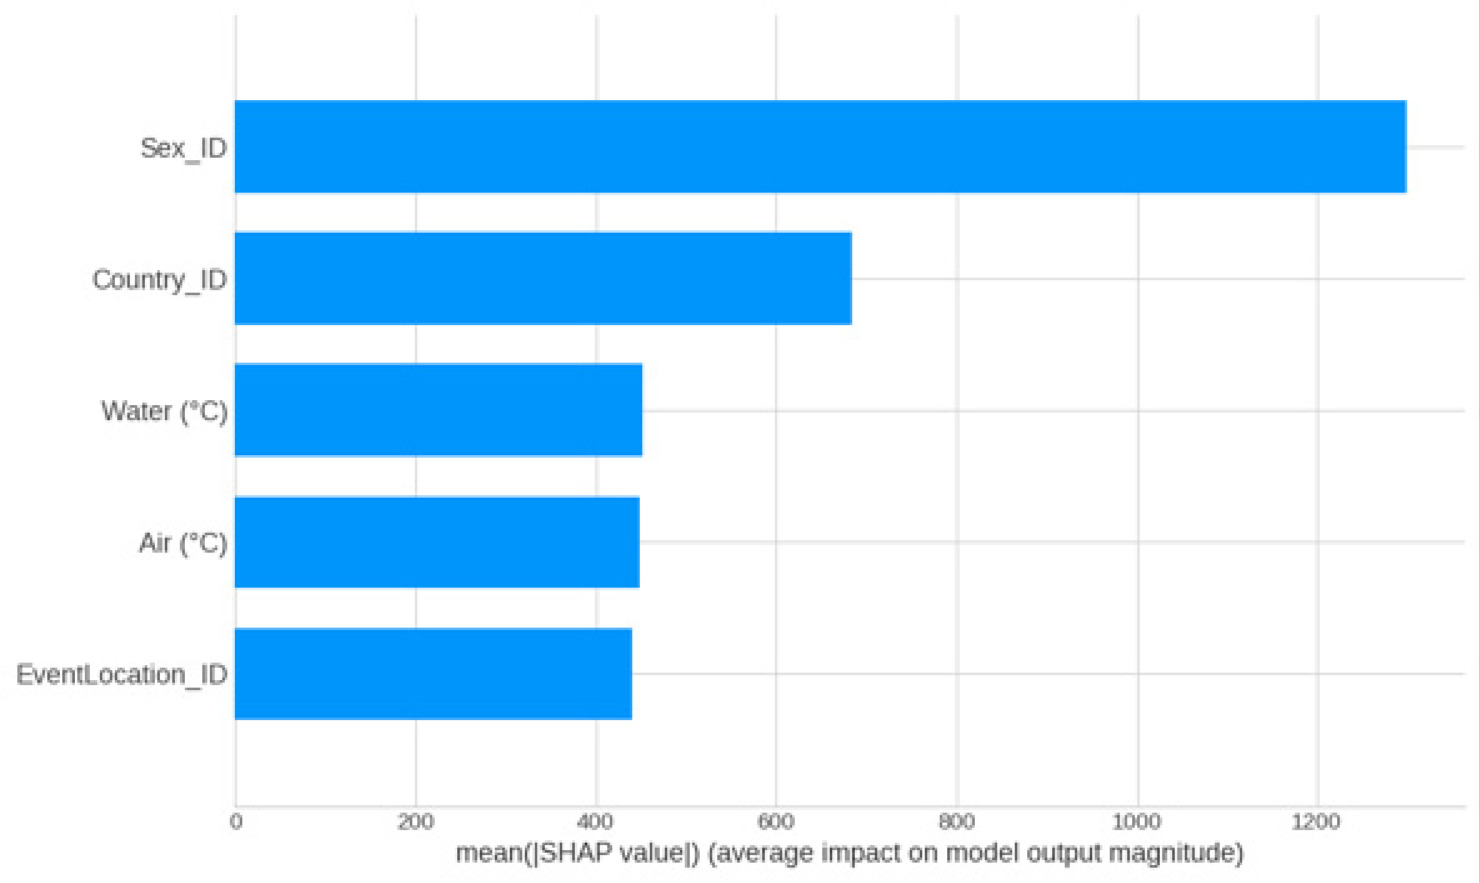
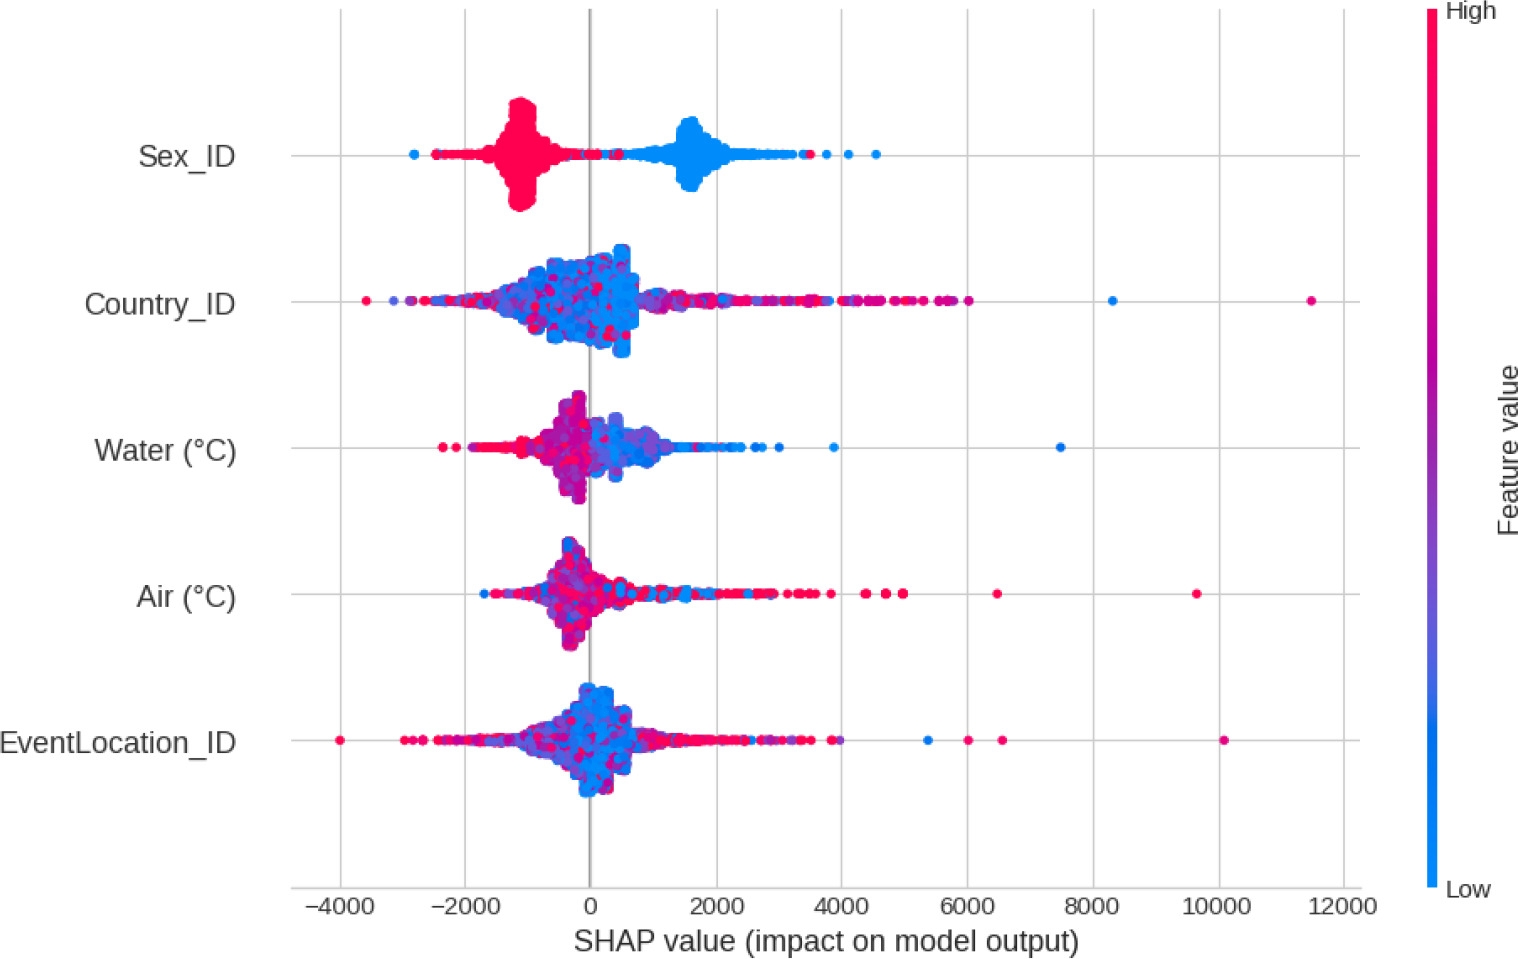
Figure 6 presents the results of the relative feature importance for the variables included in the predic- tive analysis. Interestingly, the country of origin had a higher impact than the event location. Based on the results, it was possible to verify that sex is the most important variable that influences finish time, with women (blue dots) adding between 2000 and 3000 s to the men’s times (Figure 7). Low water temperature values resulted in longer full race finish times, similar to the temperatures in which the warmest tempera- tures shortened race finish times. For the event location and country, the findings showed that the highest IDs (corresponding to the smallest samples) seemed to give extremely positive or negative outputs.
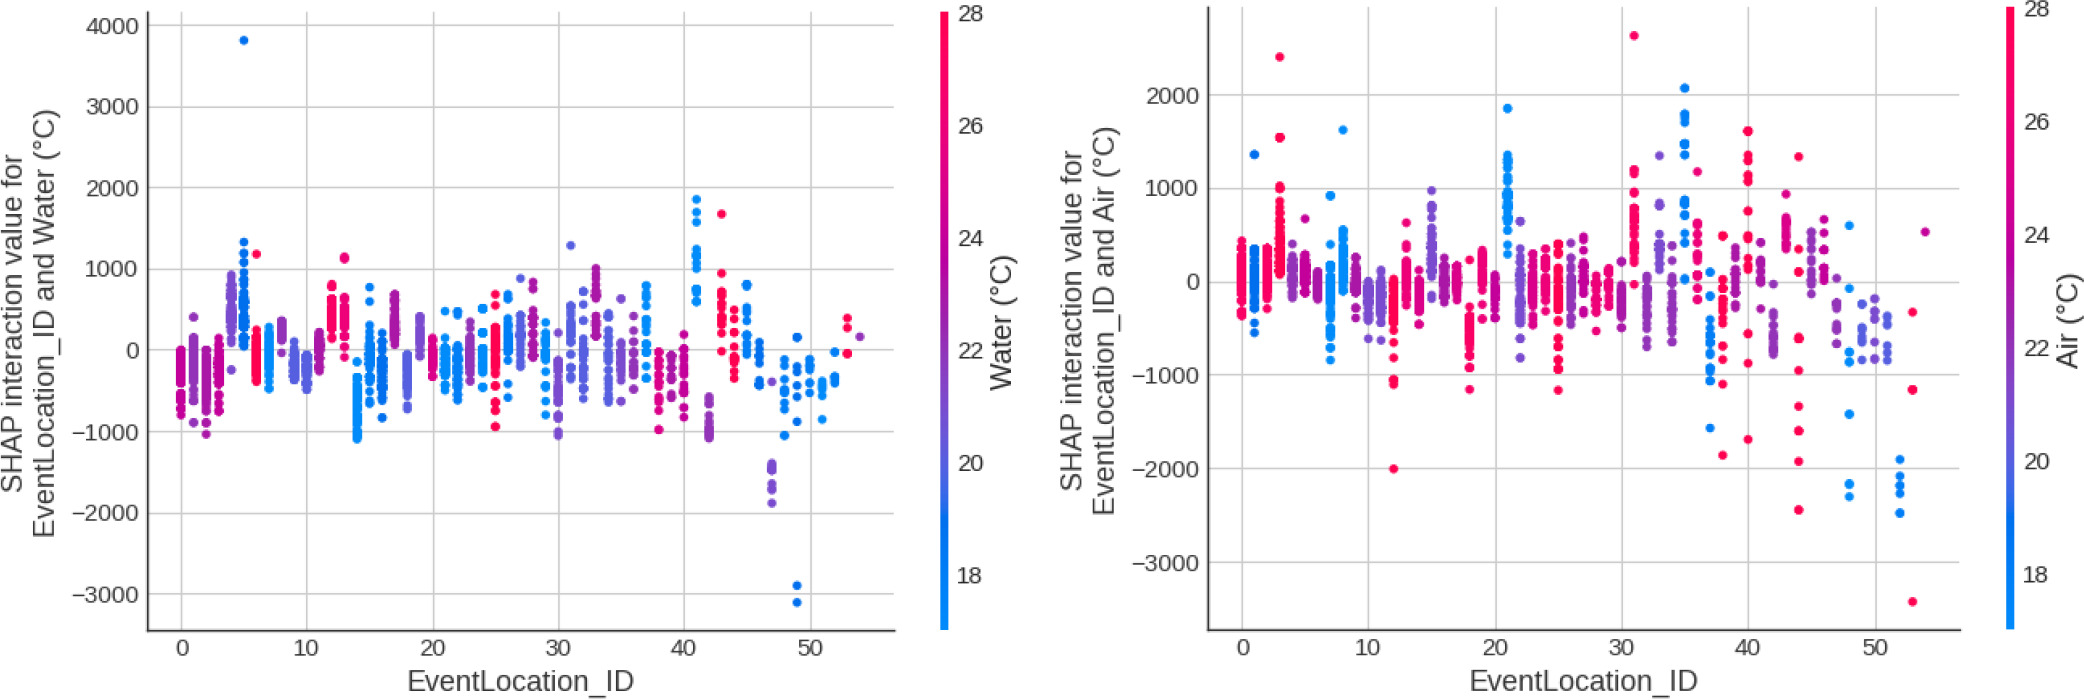
Specifically for the interaction between event loca- tion, water, and air temperature, Figure 8 shows that for both variables, event locations with a higher num- ber of records presented water temperatures between18 and 24°C, with those between 18 and 20°C sub- tracting about 1000 to 3000 s off the finish time. For the air temperature, it was shown that countries with a higher number of records showed a lower air tem- perature compared to those with fewer records.
Discussion
This study was intended to determine the fastest overall IRONMAN® race locations for professional ath- letes competing from 2002 to 2022. Our main find- ings showed that IRONMAN® Tallinn was the fastest; the descriptive data revealed that most of the fastest finish times were found in courses characterized by swimming in a lake, cycling on a rolling course, and running on a flat course. Sex was the most important variable influencing finish times, low water tempera- tures impaired performance, and warmer tempera- tures increased race finish times. It is important to mention that studies evaluating the race courses in IRONMAN® competitions are scarce in the scientific literature, which can be associated with a greater in- terest in understanding the individual factors related to the performance of athletes. However, as environ- mental conditions influence endurance performance [5, 14, 23], it is important to advance knowledge on this topic.
The first important finding was that the fastest race course is IRONMAN® Tallinn in Estonia. Despite the lack of evidence in the scientific literature to under- stand these results, it is important to adopt a critical and reflexive approach. The IRONMAN® Tallinn is relatively new, with a total of two editions and 11 fin- ishers. It can be considered an important bias in our analysis since we did not consider a minimum number of records or editions for inclusion. However, based on the descriptive information about the race courses, it was shown that in Tallinn, the swim course is one loop in Lake Harku, the cycling course is rolling, and the running course is flat [24]. The benefits of swimming in a lake can be explained by the possible lower drag due to the lake’s calm water. The water waves and cur- rents change the fluid flow and increase wave drag. Moreover, calm waters tend to have higher tempera- tures [25]. Finally, the lower the water temperatures, the higher the drag on swimmers [26]. For these rea- sons, competing in lakes seems beneficial for IRON- MAN® athletes.
Regarding the cycling course, it was shown that a rolling course can be related to better performance since it favours athletes cycling in pelotons. This in- creases motivation given the adversary’s presence and helps to spend less energy and sustain higher speed during the race [27]. Despite no studies being devel- oped to understand the influence of the race course and the triathletes’ performance in detail, previous findings reported a negative effect of uphill courses, in- cluding increasing risks of falls and injuries as a result of fatigue and a higher metabolic energy supply rate [28].
Another important aspect of the results is the en- vironmental temperature, more precisely, water and air temperature. It was shown that event locations with a higher number of records seem to present water tem- peratures between 18 to 24°C, with those between 18 and 20°C subtracting about 1000 to 3000 s off the finish time. Considering air temperature, it was shown that events with a higher number of records also showed a lower air temperature compared to those with fewer records. Previous studies showed that the minimum ideal water temperature for triathletes should be 12°C in wetsuits and 16°C without wetsuits [29]. For exam- ple, the fastest race course (i.e., IRONMAN® Tallinn in Estonia) showed the lowest air temperature and pre- sented a water temperature of 18°C. Despite this, we see that the actual water temperatures in IRONMAN® com- petitions are always above those levels, reaching, in some cases, up to the high 20s. As mentioned above, higher water temperatures are associated with less drag [26]. The same is observed for on-land (cycling and running) races [30]. This is because the higher the temperatures, the lower the drag. These findings high- light the role of both topographic characteristics and environmental conditions for endurance activities.
Another important result was the influence of sex. It highlights that women and men presented different performances across these courses. It is well docu- mented that sex performance differences range from 12% to 18%, depending on the distance and individual characteristics [31]. Usually, these differences are ex- plained by morphological and physiological differences. For example, elite female athletes present a higher body fat compared to men, which could help during swim- ming but penalizes a woman’s performance during cycling and running [32]. For the physiological profile, women tend to present lower VO2max results com- pared to men and show a higher difference in aerobic capacity between cycling and running tests. These results indicate the importance of adopting specific ap- proaches to training, but also understanding the spe- cificities of the race course on the performance of men and women.
Although this study used a large set of data from professional IRONMAN® triathletes competing dur- ing two decades in all IRONMAN® races held world- wide, some limitations should be acknowledged. We did not control for multiple participations and the dif- ferences in the frequency of athletes competing in dif- ferent courses over time. Also, there is a lack of data about training, nutrition, equipment, and previous ex- perience, which could influence the preparation, race strategy, and, consequently, performance. Similarly, we do not have information about the age of peak per- formance of the athletes, which could influence the performance across the different seasons of the year. Another important limitation is the information about the precise temperatures is an approximation based on the mean values obtained for each event location over time. On the other hand, the strength of the pre- sent research was the novel information it provided and the potential practical applications for IRONMAN® triathletes. Since these races are held all over the world, participation infers a large demand in terms of finan- cial cost, time, traveling-related fatigue, and sleep dis- turbances. Therefore, the practical information about the fastest races would be expected to aid triathletes in making optimal decisions about competing in races with favourable courses. Furthermore, the knowledge of the fastest split times would help triathletes com- pete in races with optimal characteristics for a specific split. These results might also help race organizers cre- ate faster races to attract more participants.
Conclusions
Based on this descriptive approach, the fastest race courses for triathletes competing between 2002 and 2022 were the IRONMAN® Tallinn, followed by the IRONMAN® Switzerland Thun and the IRONMAN® Des Moines. Most of the fastest finish times were found in courses with swimming taking place in a lake, cy- cling on a rolling course, and running on a flat course, with lower water temperatures impairing performance, similar to the warmest air temperatures.