Introduction
Football is one of the most widely followed sports in modern society, with a global reach and substantial economic and social implications [1]. Driven by a passion for the game, thousands of children and adolescents engage in football for leisure, health benefits, and with aspirations of becoming professional athletes.
In high-performance training environments, young soccer players and teams concentrate on multiple dimensions essential for optimal athletic development. These include technical skill execution, tactical understanding, psychological aspects, and physical performance [2].
Within the technical domain, various factors are examined to enhance the efficiency of skill execution. In this context, laterality plays an important role in sports. Typically, one lower limb – referred to as the dominant or preferred foot – is used more frequently than the contralateral limb during technical actions such as passing, shooting, and dribbling [3].
As a result of this preference, lateral asymmetries are commonly observed in human motor behaviour, manifesting in both preference and performance levels of limbs in tasks requiring gross and fine motor coordination. These asymmetries have been attributed to both genetic factors, such as differences in cerebral hemisphere development, and environmental influences, including the frequency and intensity of limb-specific practice [4].
Considering the specific demands of each sport, football is classified among those characterised by bilateral asymmetry, due to motor tasks such as kicking and directional changes [5]. Moreover, the high volume of training and competition, combined with the preferential use of one lower limb, contributes to lateral imbalances. These imbalances may result in differences in strength, power, and range of motion between limbs.
In this context, asymmetry refers to performance discrepancies between body limbs during motor tasks [6, 7]. In sports science, various tools are employed to enhance athletic performance and reduce injury risk [8]. Among these, the identification of lower-limb asymmetries has gained prominence in recent research.
Several studies have proposed reference values for asymmetry indices in biomechanical variables. For instance, Rutkowska-Kucharska [9] adopted a 10% asymmetry index as a safety threshold when analysing lower-limb strength parameters in jump tests involving young football players. Generally, thresholds between 10% and 15% are commonly used in the literature [10].
Over time, research has focused on quantifying inter-limb differences to identify asymmetries in physical capacities such as postural control [11], strength and power [12], ground reaction forces, and muscle torque during horizontal and vertical jumps performed by young football athletes [9].
In the football context, Thomas et al. [13] evaluated differences between the dominant and non-dominant limbs during directional changes, comparing the performance of male and female players. Their analysis included variables such as hip, knee, and ankle joint angles and angular moments in the sagittal plane, as well as knee abduction angles and angular moments in the frontal plane.
Despite the recent growth in research on female football players, the available scientific data remains limited and inconsistent, especially when compared to the extensive research on male athletes. Given the increasing participation of women in football, it is essential to expand and deepen our understanding of their physical, technical, and tactical characteristics through high-quality research [14, 15]. Therefore, the primary objective of this study is to provide quantitative data on technical asymmetries in a sample of female football players, contributing to the existing knowledge base and addressing a critical gap in the literature.
Studying lower-limb asymmetries in young female football players is particularly relevant, as this age group is undergoing critical phases of physical and technical development. Early identification of imbalances during this period can inform targeted corrective strategies, potentially enhancing performance and reducing injury risk. Accordingly, the objective of this study was to characterise angular kinematics and quantify asymmetry between the dominant and non-dominant limbs during the execution of technical skills in young female football players.
Material and methods
Participants
This study included 22 elite female football players from the Under 15 (U15) and Under 17 (U17) categories, all of whom competed in state, national, and international championships during the year of data collection. The sample was intentionally selected. The group had a mean age of 14.79 ± 1.21 years, a mean body mass of 52.05 ± 9.26 kg, height of 1.57 ± 4.73 m, body mass index (BMI) of 20.81 ± 3.16 kg/m2, and a mean body fat percentage of 21.29 ± 6.51. The dominant support limb was determined based on self-reported responses from the participants. Accordingly, nineteen (19) athletes were classified as right-footed and three (3) as left-footed. Among them, nine (9) frequently played as defenders and fullbacks, eight (8) as midfielders, and five (5) as forwards. Goalkeepers were excluded from the study due to the distinct biomechanical demands of their position.
To assess their maturation stage, the calculation of Peak Height Velocity (PHV) age was performed [16]. At the time of data collection, one athlete was classified as being in the pre-PHV stage, one in the PHV stage, and all others in the post-PHV stage.
Inclusion criteria were: (I) athletes who participated in official regional and/or state competitions during the data collection year; (II) a training frequency of three to five times per week; and (III) presentation of a free and informed consent form signed by parents or legal guardians. The exclusion criterion was the presence of any type of muscle or skeletal injury at the time of data collection.
Study design and procedures
This is an observational study with a cross-sectional design, which allows the analysis of biomechanical and asymmetry variables at a single point in time, without experimental interventions [17].
Anthropometric evaluation was conducted by measuring body mass (kg) and height (m). Subsequently, the body mass index (BMI in kg • m–2) was calculated by dividing body weight (kg) by height squared (m2). Body fat percentage was quantified using a skinfold calliper to measure the thickness of specific skinfold sites on the body [18].
Following the anthropometric assessment, each participant performed a warm-up lasting approximately 10 min. The warm-up protocol mirrored pre-match routines and included running, bilateral and unilateral jumps, and joint mobility exercises [9].
To ensure familiarity and reduce variability, athletes were given time to acclimate to the laboratory environment, equipment, researchers, and testing procedures. The order of tests and the sequence of limb assessments were randomised to minimise potential order effects.
Technical skill execution – including heading, kicking, passing, and dribbling – was performed in a controlled laboratory setting to facilitate precise kinematic data collection. For each skill, five valid trials were recorded using the dominant limb and five using the non-dominant limb. Valid trials were defined by clear visualisation of body markers and accurate execution of the intended movement [2, 19–22].
Measurement instruments
Three-dimensional kinematic analysis
The kinematic data for soccer technical skills were collected using the Vicon® system, which consists of six MX T10 infrared cameras and a digital camera, with an acquisition frequency of 500 Hz. The cameras were calibrated for a volume of 2.0 m3.
The full-body Plug-in Gait biomechanical model was constructed based on the positioning of 39 retroreflective spherical markers placed on anatomical points of interest on both sides of the body and on the upper and lower limbs. Marker placement included the following regions: head (left/right frontal region; left/right occipital region), thorax (C7 and T10 vertebrae, clavicle, sternum, and right scapular body), upper limbs (bilateral: glenohumeral joint, humeral, lateral epicondyle of the humerus, forearm, radial and ulnar styloid processes, metacarpophalangeal joint of the middle finger), pelvis (bilateral anterior superior iliac spine and posterior superior iliac spine), and lower limbs (bilateral lateral thigh, knee joint line, tibial, lateral malleolus, calcaneal tuberosity, head of the second metatarsal).
A static position was recorded at the reference system’s origin, with the Z-axis oriented vertically (cranial-caudal) and perpendicular to the laboratory floor, the Y-axis oriented mediolaterally, and the X-axis horizontally and in the anteroposterior direction. Marker tracking and reconstruction during the execution of technical skills were performed automatically using the Nexus software (Vicon® system).
The kinematic evaluation allowed the calculation of joint and segment angles on both the right and left sides, according to the following conventions: flexion (+) and extension (–) of the head, neck, thorax, knee and foot; anterior (+) and posterior (–) pelvic tilt; and dorsiflexion (+) and plantarflexion (–) of the ankle. Table 1 presents the joint segments, their definitions, and the corresponding technical skills in which they were evaluated.
Table 1
Kinematic analysis of soccer technical skills
Football technical skills
The biomechanical analysis protocol for technical skills was developed based on existing literature and adapted to align with the objectives of this study, the available instrumentation, and the physical constraints of the testing environment.
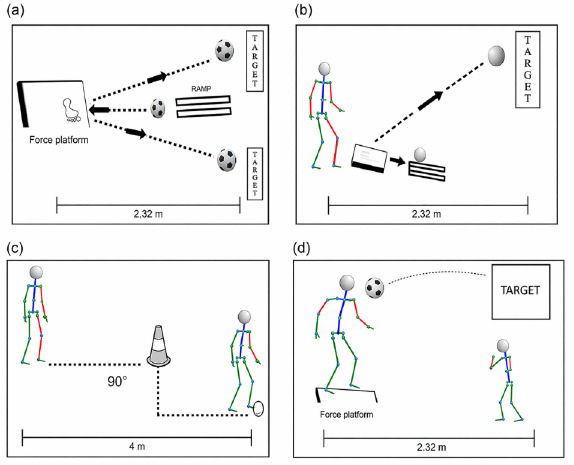
A ramp composed of two wooden tracks (50 cm in height, 90 cm in length) with an inclination angle of 30° was used to standardise the direction, position, and approach speed (3 m/s) of the ball toward the athlete. The ball was positioned diagonally to the athlete’s right or left, depending on which limb executed the action [22, 23]. The ball used was the Topper Samba II Official Field Soccer Ball, featuring stitching, a circumference of 68–70 cm, a weight of 410–450 g, and calibrated on the testing day.
Three foam targets were made for the technical tasks of kicking, passing, and heading. Each target consisted of a square (40 cm per side) with a smaller square at the centre (10 cm per side). The targets were fixed on the laboratory wall at a distance of 2.32 m in the anteroposterior (X) direction from the athlete. The central target was positioned 1.20 m above the floor.
For kicking, athletes were instructed to kick the ball using the instep toward the centre of the target on the wall in front of them. The ramp was placed 40 cm above the floor. For passing, the ball approached the athlete from the ramp on the side opposite the leg performing the pass. The ball was to be touched with the inside of the foot and directed toward the target with only one contact. The targets were placed on both the athlete’s left and right sides to allow for passes with both feet [22, 24].
For heading, athletes were instructed to perform a quick, maximum jump, heading the ball at the highest point possible, while positioning their lower limbs alternately, one in front of the other, and using a technique resembling actual game situations [25]. The ball was thrown manually to the participant at a comfortable height and a distance of 3 m, simulating a low-speed ball situation [26, 27].
Athletes were instructed to head the ball in such a way that the ball’s trajectory remained below their vertical position at the time of impact and toward the rectangular target (40 × 40 cm) positioned in front of them, similar to the target used for assessing kicking accuracy [28, 29].
For dribbling, athletes were instructed to move the ball forward and, upon approaching the cone, perform a change of direction at approximately 90° and resume moving forward. A tape was placed on the floor to guide the athletes with precision. Dribbling was performed with both the right and left lower limbs. The horizontal distance for performing the skill was approximately 4 m, with the cone positioned 2 m from the starting line. Attempts were considered accurate if the athlete maintained ball control throughout the movement, avoided contact with the cone, and followed the designated path. For three-dimensional reconstruction, the selected attempt corresponded to the moment when all retroreflective markers were visible to the system.
Table 2 provides an overview of the protocol used for the biomechanical assessment of football technical skills.
Table 2
Description of the biomechanical assessment protocol for football technical skills
Figure 1 provides a visual representation of the bio-mechanical protocol applied during the assessment of technical football skills in a controlled laboratory setting.
Calculation of the normalised symmetry index
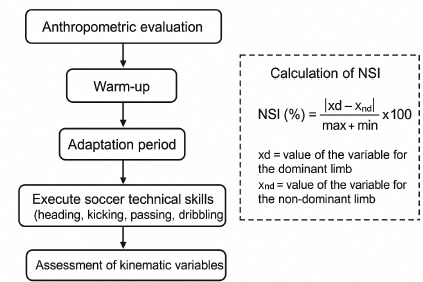
The normalised symmetry index (NSI) was calculated to identify differences between the dominant and non-dominant limbs in the biomechanical variables of this study [30]. This index was created to propose an appropriate formula for the kinematic and kinetic variables. The NSI yields percentage values ranging from 0 (perfect symmetry) to 100 (perfect asymmetry), facilitating data interpretation.
The calculation was performed using the angular amplitude values of the body segments and joints during the execution of each soccer technical skill. For this, the five valid recordings for each skill were considered. In the formula, the numerator represents the difference between the variable for the dominant limb and that for the non-dominant limb in one of the attempts. This calculation was performed individually for each of the five valid trials per athlete, and the final asymmetry value was obtained by averaging these five results.
The result is expressed as a percentage and normalised for the data range from zero to one hundred. A value of 0% represents perfect symmetry between the limbs on both sides, while a value of 100% represents total asymmetry. Negative values indicate a preference for the dominant limb, and positive values indicate a preference for the non-dominant limb.
Figure 2 presents an overview of the experimental procedures used for the biomechanical assessment of the technical football skills in the laboratory setting.
Statistical analysis
The data were organised in spreadsheets, and statistical analyses, as well as graph generation, were conducted using the GraphPad Prism® and IBM SPSS Statistics® software. Angular amplitude for each body segment and/or joint was calculated, representing the difference between the maximum and minimum angular values obtained. The NSI was calculated from the angular amplitude values of the dominant and non-dominant limbs. The angular amplitude data are described using the mean, standard deviation, median, and interquartile range. NSI values are expressed as percentages (%).
The Shapiro–Wilk normality test revealed that the data did not follow a normal distribution. The angular amplitude of body segments and joints during the technical skills of heading, kicking, passing, and dribbling was compared between the dominant and non-dominant lower limbs using the Wilcoxon test. Statistical significance of the results was assumed at p < 0.05. Effect size r was calculated and interpreted based on the following thresholds: r > 0.10 as a small effect, r > 0.30 as a medium effect, and r > 0.50 as a large effect [31].
Results
Table 3 presents the description of the angular amplitude values of body segments and joints during the execution of each soccer technical skill, as well as the comparison between the dominant and non-dominant lower limb. The data are expressed as mean, standard deviation, median, and interquartile range. In the heading skill, two athletes did not complete the task with the dominant side limb (n = 20), and two others failed to complete the task with the non-dominant side limb (n = 20). For the kicking skill, one athlete did not complete the task with the dominant limb (n = 21), and four did not complete it with the non-dominant limb (n = 18).
Table 3
Mean (standard deviation), median (interquartile range) of the of body segments and joints during execution of football technical skills
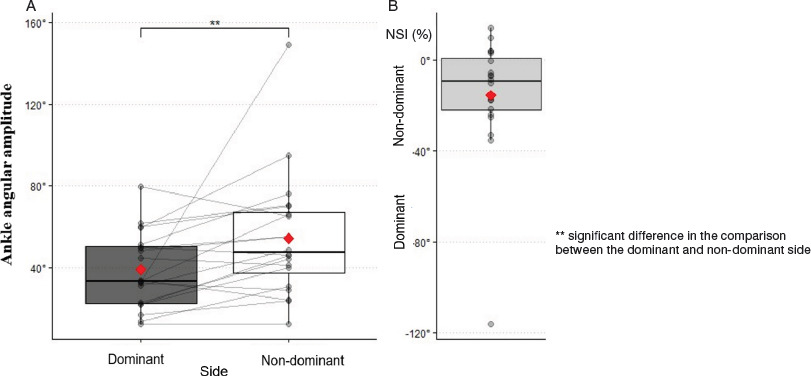
In the heading skill, the angular amplitude of the non-dominant lower limb’s ankle was significantly greater than that of the dominant lower limb (p < 0.001). The effect size was also estimated at r = 0.63, which is considered large (Figure 3).
Figure 3
(A) statistical difference between dominant and non-dominant sides for ankle angular amplitude during the heading technical skill (n = 20), (B) normalised symmetry index (% NSI)
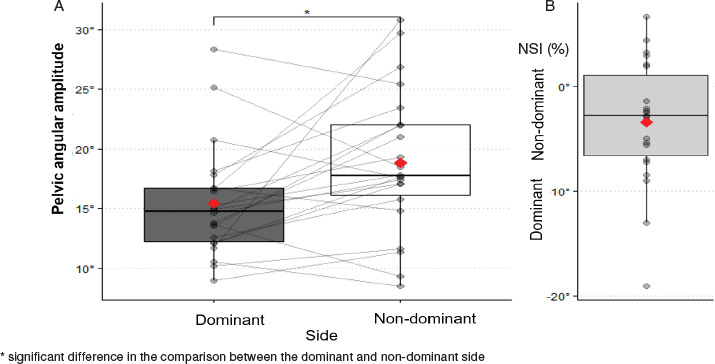
For the passing skill, the angular amplitude of the pelvis was significantly higher on the non-dominant side compared to the dominant side (p < 0.001), with an effect size of r = 0.52, also indicating a large effect (Figure 4).
Figure 4
(A) statistical difference between dominant and non-dominant sides for pelvic angular amplitude during the passing technical skill (n = 22), (B) normalised symmetry index (% NSI)
The comparative analysis of angular amplitudes during the execution of technical soccer skills (passing and heading) did not reveal statistically significant differences between dominant and non-dominant sides. However, some variables showed a considerable effect size in favour of the dominant side.
In the heading skill, the angular amplitude of the knee exhibited a moderate effect size (r = 0.36), with a higher mean angular value for the non-dominant side.
For the kicking skill, a moderate effect size (r = 0.42) was observed for the knee’s angular amplitude, as well as for the ankle (r = 0.41) and foot (r = 0.30) angular amplitudes, with higher angular values for the non-dominant side.
In the passing skill, a moderate effect size (r = 0.37) was noted for the ankle’s angular amplitude, with higher values for the non-dominant side. In the dribbling skill, moderate effect sizes were observed for the knee (r = 0.33), ankle (r = 0.39), and foot (r = 0.30) angular amplitudes, with higher angular values for the non-dominant side in the ankle and foot.
Figure 5 presents the normalised symmetry index (NSI) between the dominant and non-dominant sides, calculated from the angular amplitude values. Negative values indicate a preference for the dominant side, while positive values indicate a preference for the non-dominant side. NSI values are expressed as a percentage.
Figure 5
Asymmetry index (NSI) of the angular amplitude of body segments and joints during the execution of technical football skills
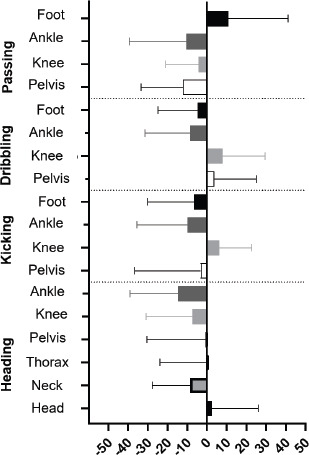
Normalised symmetry index (%)
In the heading skill, the most significant disparity between the dominant and non-dominant sides was observed in the ankle joint, with an asymmetry index of 14.77% (± 24.16%), indicating a preference for the dominant side. The other asymmetry indices, except for the head segment, also showed a tendency toward the dominant side.
For the kicking skill, the highest asymmetry index was observed in the ankle joint (9.87% ± 25.70%), favouring the dominant side. The dominance preference was also evident in the pelvic and foot asymmetry indices.
In the dribbling skill, the highest asymmetry was found in the ankle joint, at 8.47% (± 23.02%), favouring the dominant side. The foot showed an asymmetry index of 4.58% (± 20.27%), also favouring the dominant side, while the knee and pelvis exhibited slight preferences for the non-dominant side.
In the passing skill, the highest difference was observed in the pelvic joint, at 12.31% (± 21.04%), favouring the dominant side. The ankle and knee also favoured the dominant side, with asymmetry indices of 10.51% (± 28.84) and 4.19% (± 16.77%). respectively. However, the foot showed an asymmetry index of 10.83% (± 30.20%), favouring the non-dominant side.
Discussion
The primary objective of this study was to investigate asymmetry between the dominant and non-dominant sides in terms of angular amplitude during the execution of technical skills in young female athletes.
The mean asymmetry values (NSI) remained within the reference limits of 10–15%, as described in the literature. Statistically significant differences in angular amplitude were observed between the dominant and non-dominant sides in the ankle joint during the heading skill and in the pelvis during the passing skill, both showing large effect sizes, indicating the potential relevance of these asymmetries to technical performance.
In both cases of significant difference, a greater angular amplitude was observed in the non-dominant limb. One possible explanation is the presence of compensatory mechanisms or individual variations in movement execution. Although no significant differences were found for the other skills and joints, the moderate effect sizes observed in several variables suggest that lateral preference might be practically relevant.
In the heading skill, the non-dominant ankle showed a significantly greater angular amplitude compared to the dominant side. This movement is essential for enhancing the jump required for heading, directly impacting the effectiveness of this skill [28]. Almansoof et al. [32] emphasise the importance of proper ankle movement for performance and injury prevention, particularly in actions involving jumping, directional changes, and weight-bearing. The dorsiflexion angle, for instance, contributes to stability and impact absorption. This is essential for maintaining balance and appropriate mechanics during heading, which helps to prevent biomechanical compensations that could increase injury risk [33]. The higher angular amplitude observed in the non-dominant ankle in this study may indicate a compensatory movement to enhance balance.
In the passing skill, the non-dominant pelvic angular amplitude was significantly higher than that of the dominant side. The angles of the pelvis and hip help orient and stabilise the body, facilitating thorax rotation and increasing passing accuracy. This skill is tactically crucial for maintaining ball possession, advancing on the field, and creating scoring opportunities [34].
Boyne et al. [35] conducted a systematic review comparing kicking biomechanics between genders and skill levels, concluding that differences in performance were more influenced by skill level than by inherent gender differences. The angular amplitude results in this study suggest that different technical skills may require distinct movement patterns, underscoring the role of biomechanical knowledge in optimising execution.
Although the average NSI values remained within the accepted range, considerable variability and a general preference for the dominant side were observed across several variables. Identifying asymmetry values that exceed reference thresholds may support the implementation of individualised or team-based training programs aimed at correcting imbalances.
Raya-González et al. [36] analysed asymmetry in young female football players, noting significant asymmetry in change-of-direction tests. Fox et al. [37] also found that lower limb asymmetries moderately impact athletic performance, particularly in directional changes and sprints.
Given that the sample consisted of U15 and U17 athletes, promoting bilateral development and encouraging players to build confidence using both sides of the body may foster more versatile athletes capable of executing a wider range of movements and techniques. Kahla et al. [38] advocate for increased bilateral training as athletes progress from U12 to U15, and recent findings by Maio et al. [39] demonstrate the effectiveness of targeted interventions – such as mini-trampo-line exercises – in reducing unilateral asymmetries.
Based on the findings, the hypothesis that angular amplitude and asymmetry index differ significantly between the dominant and non-dominant lower limbs, with greater amplitude on the non-dominant side, was partially confirmed. While significant differences were noted in the ankle and pelvis, other skills and joints showed non-significant but practically relevant differences. These findings underscore the importance of ongoing assessment and training strategies to promote balanced performance across limbs.
Low asymmetry values, such as those observed in this study, may reflect positive adaptations to sport-specific demands or individual biomechanical characteristics. Furthermore, asymmetry values within the 10–15% range are not typically associated with an increased injury risk. It is essential to interpret asymmetry within the broader context of sports movement complexity, considering current scientific evidence and increasingly individualised assessment methods [40].
A limitation of this study was the reliance on statistical significance and reference asymmetry values (10 to 15%), which may overlook the influence of sample size and variability. Future research should involve larger samples to improve the statistical power and incorporate an effect size analysis to better understand the impact of asymmetries on biomechanical and technical performance in female football. These limitations should be considered to avoid generalising the findings to populations with different characteristics.
Conclusions
This study contributes to the understanding of angular asymmetries between the lower limbs in young female football players, revealing a tendency to favour the dominant side during specific technical skills – particularly heading and passing – most notably in the ankle and pelvic joints. Although the asymmetry values remained within the commonly accepted reference range of 10–15%, the observed differences suggest potential compensatory mechanisms that may influence technical execution and overall performance.
The identification of greater angular amplitudes in the non-dominant ankle and pelvis underscores the importance of implementing individualised training strategies aimed at promoting balanced development across both sides of the body. Importantly, decisions regarding intervention should not rely solely on arbitrary thresholds or normative data; rather, they should be informed by individualised assessments that consider whether asymmetries may contribute to performance limitations or increased injury risk.
Future research involving larger and more diverse samples is recommended to validate these findings and further explore the biomechanical and technical implications of limb asymmetries in women’s football.
Such studies will be essential for advancing evidence-based training practices and supporting the development of more balanced and versatile athletes.
Research data for this article
Data not available. The data that was used is confidential. The raw data associated with this manuscript will not be immediately shared as it is part of a larger, ongoing research project. Future publications are planned based on further analysis of this comprehensive data-set. Releasing the data at this stage would prematurely disclose findings and potentially jeopardise the integrity and novelty of subsequent analyses. We commit to considering data sharing after the completion of the entire research program.