Introduction
Recovery after acute exercise is a crucial factor when planning consecutive training sessions, as it helps reestablish homeostasis in systems affected by physical and metabolic stress [1]. During this phase, adaptations occur in the nervous, cardiorespiratory, and muscular systems, including tissue repair, removal of metabolites, and replenishment of energy substrates [2, 3]. These adaptations enhance mechanical efficiency and optimise performance in subsequent training sessions. inadequate recovery time can limit performance, increase the risk of injury, and contribute to overreaching, or, eventually, overtraining [4, 5]. Although metabolites such as lactate are removed within hours [6], full recovery requires more complex processes, like restoring muscle glycogen, repairing tissues, balancing electrolytes, and recovering from residual stresses (e.g., autonomic and hormonal regulation), all of which take more time and involve various biochemical pathways [7]. To assess recovery status and optimise load adaptation in training programs, coaches and athletes use various methodologies, including monitoring resting heart rate (HR), evaluating muscle electrical activity via electromyography [8], measuring biomarkers like creatine phosphokinase (CPK) to detect muscle tissue damage [9], analysing serum cortisol levels to monitor stress responses [10], and tracking lactate accumulation during standardised submaximal exercise [11]. other measures may include HR variability (HRV) markers, assessed both at rest and during standardised exercise [12]. HRV has been widely used in sports because low HRV is associated with high physiological stress, making it sensitive to training overload and an indicator of incomplete recovery or chronic maladaptive conditions, such as overreaching in athletes [13]. While HRV is a valuable tool for monitoring recovery, it primarily reflects autonomic balance. To enhance its effectiveness, HRV should be combined with other recovery monitoring methods [14].
Recently, we proposed a simple tool named “heart rate cost (HRC) of submaximal running,” which can be measured during an athlete’s warm-up and may predict markers of aerobic fitness [15, 16]. HRC may indicate how much effort the heart (and, indirectly, all systems involved in HR responses) must exert to meet the energetic demands of exercise. As a marker of internal load, HRC may practically reflect the integrated readiness of physiological systems to handle imposed demands, making it useful for predicting aerobic fitness, as previously suggested [15] and potentially valid for monitoring training recovery. For instance, if an athlete is fatigued or presents lower physical fitness, the HR for a given submaximal running speed would be higher, leading to an elevated HRC. Thus, although HRC may be proposed as a simple index of physical status [15, 16], its validity for recovery monitoring requires further investigation.
Most methods for collecting biological markers to monitor recovery require specialised equipment, laboratories, and trained personnel, which can limit accessibility for amateur athletes. Additionally, the literature highlights a lack of cost-effective and user-friendly methodologies for assessing the post-training recovery status [17]. in this context, straightforward and affordable approaches, such as HRC during submaximal running, are essential. This method predicts aerobic fitness [14, 15] and may assess the physical recovery status, forming the central hypothesis of the present study. Therefore, the present study evaluated the effectiveness of HRC during submaximal running as a simple, non-invasive, and cost-effective tool for monitoring recovery following an acute high-intensity training session. This analysis was conducted by employing HRC alongside other measures regarded as gold standards for monitoring exercise training recovery in athletes.
Material and methods
Volunteers for this study included 15 healthy, physically active males aged 18 to 31 years. All were recreational runners who also engaged in strength training, participating in both activities 2 to 3 times a week, with sessions lasting 30 min to 2 hours each. The sample size met the minimum requirement to achieve a power > 0.90 for the methods and analyses used. The inclusion criteria for this study were no history of chronic diseases, no bone or muscle injuries within the past 12 months, and no use of medications or supplements for at least 30 days before the study. The exclusion criteria included a failure to complete the entire protocol, non-adherence to the designated rest period before assessment, and use of substances that could influence physical performance.
Experimental design
Volunteers were instructed to refrain from exercise for at least 48 h before participating in the study. Notably, in the 10 days prior to participation, volunteers completed 2–3 conventional strength training sessions of up to 1 hour each and 2 running sessions of up to 45 min at low to moderate intensity, followed by at least 2 days of complete rest before the study. They then underwent anamnesis, body mass measurements, blood pressure (BP) assessments, and resting HR evaluations for 15 min, as presented in Figure 1. HRV was measured for 20 min and venous blood samples were collected for analysis of CPK, testosterone, and cortisol.
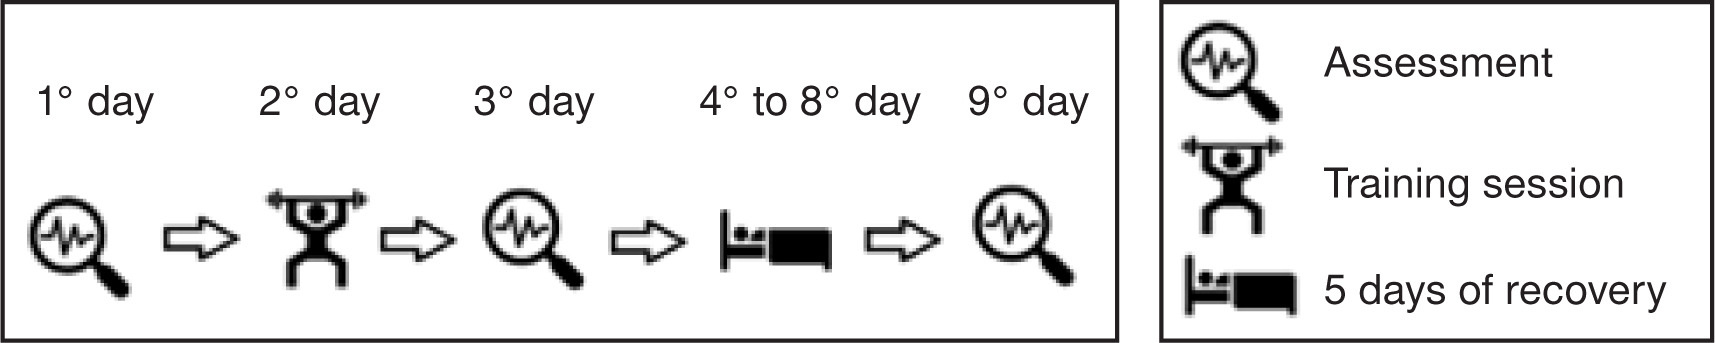
Additionally, participants’ pain perception was assessed using a standardised pain scale, and neuromuscular performance was evaluated through a vertical jump test. A 6-minute submaximal run was conducted to assess the HRC of submaximal running [15]. The following day, participants engaged in high-intensity interval training on a treadmill, followed by a strength training session.
The described procedures were conducted on three occasions: one day before the training session, 24 h afterwards, and after five consecutive days of post-training recovery.
Anamnesis
The anamnesis encompassed inquiries concerning individuals’ personal health histories and their levels of physical activity. Additionally, participants were assessed using the Muscle Pain Perception Scale. Pain classification was determined using a visual analogue scale, a continuum ranging from 0 to 10. on this scale, a score of 0 denoted the absence of pain, while a score of 10 signified a high level of pain [18].
Anthropometric, hemodynamic, and HRV assessments
Height measurements were conducted using a wall stadiometer Sanny® (Sanny, São Paulo, Brazil). Participants were meticulously positioned to ensure optimal accuracy; their feet, buttocks, shoulder blades, and the posterior portion of their skull were firmly in contact with the wall. During the measurement process, participants were kindly instructed to take a deep breath to ensure precision.
A Filizola® (Filizola, São Paulo, Brazil) mechanical weighing scale with an accuracy of 100 grams was used to determine the total body mass of the participants to obtain the body mass index (BMi) using the formula: mass/(height)2. Circumference measurements were taken using a flexible, non-elastic measuring tape Sanny® (Sanny, São Paulo, Brazil), with a scale in centimeters. The percentage of body fat was obtained through the three skinfolds protocol (chest, abdomen, and thigh) [19] by using a Cescorf® (Cescorf, Porto Alegre, Brazil) scientific adipometer. BP and HR were obtained after a 15-minute period of rest employing a Microlife® electronic device model BP 3BT0-A (Microlife, Widnau, Switzerland).
For the HRV measurements, R-R intervals were recorded over 20 min using a Polar® RS800CX HR monitor (Polar Electro, Kempele, Finland). Participants were instructed to refrain from consuming coffee or other stimulants for 24 h prior to the assessments. Following data collection, a detailed analysis was conducted using KubiosHRV Scientific Lite software to extract HRV markers (Kubios oy, Kuopio, Finland). The mean filter was applied to eliminate artefacts. Subsequently, data were extracted and analysed in both time and frequency domains. The following metrics were assessed: HF, the relative power of the high-frequency band (0.15–0.4 Hz) in normal units; LF, the relative power of the low-frequency band (0.04–0.15 Hz) in normal units; and the LF/HF ratio. Additionally, SD1, the standard deviation of the Poincaré plot perpendicular to the line of identity, and SD2, the standard deviation along the line of identity, were calculated. The SD1/SD2 ratio was also computed to evaluate long-term versus short-term interval variations [12].
Blood collection and measurements
Blood samples were collected from the antecubital vein using disposable needles and syringes after asepsis of the site, 30 min before the experimental exercise tests. Each sample was drawn into two 4 ml Vacutainer tubes with EDTA (BD, Franklin Lakes, NJ, USA). After collection, blood samples were kept refrigerated at 8°C until centrifugation at 1,500 × g for 15 min in an Eppendorf 5702 Series centrifuge (Eppendorf, Hamburg, Germany). Subsequent analysis of CPK, testosterone, and cortisol levels was performed. CPK was measured using the CPK UV Kinetic Method (Bioclin, Labtest, Wiener Lab, Belo Horizonte, Brazil), a widely used technique for assessing CPK enzymatic activity in serum samples. Testosterone and cortisol measurements were performed using the electrochemiluminescence method (Elecsys 2010, Roche Diagnostics).
Vertical jump
Participants underwent a vertical jump test using a Jump System Pro Cefise® contact platform (Cefise, Nova odessa, Brazil). Each participant performed two attempts to record their maximum vertical jump height (cm). They received detailed instructions to initiate the jump from a 90° position with flexed hips, executing a vertical leap to achieve the greatest possible height.
HRC of submaximal running determination
Participants performed a 6-minute submaximal run on a treadmill with an incline of 1.5% to determine their HRC. The participants were instructed to select, during the first minute of the test, a running speed corresponding to a rating of perceived exertion (RPE) scale between 12 and 13, using a 20-point RPE scale [20]. Then, the speed was kept constant for the remaining 5 min. in previous studies carried out in our laboratories, we observed that this exercise intensity (RPE between 12 and 13) allows, during the fifth minute of running, the participant to reach a HR between 80 and 85% of their maximum predicted based on their age [15]. Thus, although HR was measured throughout the test, only the final value reached in the fifth minute of running was recorded, and the corresponding submaximal speed was considered in the HRC calculation.
The HRC was calculated by dividing the HR recorded at the end of the test by the running speed in meters per minute, as shown in the example below:
Treadmill speed: 11.5 km/h
HR in the fifth minute of testing: 176 bpm
Speed in meters per minute (m/min):
(11.5*1000)/60 = 191.66
HRC = 176 bpm/191.66 = 0.91 bpm
Training session
The training session consisted of six bouts of high-intensity running on a treadmill, each lasting 1 min, followed by 1-minute rest intervals. Participants targeted a RPE between 19–20 on the Borg scale. Following the running, they completed 10 strength exercises: bench press, seated row, barbell curl, high pulley triceps, Smith machine squat, pec deck, front pull-down, machine biceps, machine triceps, and leg press at 45°. The resistance exercises were performed in a circuit format, with 8–10 repetitions at approximately 70–80% of one-repetition maximum (1RM), with 10–15 s of transition between exercises.
Statistical analysis
Statistical analyses were conducted using the SPSS 20.0 statistical package and GraphPad Prism 8.0.2 software. The Shapiro–Wilk test was employed to assess the normality of the data, which are presented as means and standard deviations. For the variable CPK, the standard error of the mean was applied. Comparisons across time points were made using ANoVA for repeated measures with Sidak post hoc tests. Since the data for the pain perception scale, CPK, testosterone concentration, and testosterone/cortisol ratio did not follow a normal distribution, the Friedman and Wilcoxon tests were applied to assess potential differences among these variables at the studied time points. The Pearson correlation coefficient (r) was used to evaluate potential correlations between the investigated variables. Moreover, delta variation ( ) of recovery was calculated as the difference between values at 5 days post-training and 24 h post-training for the studied variables. Correlation analyses were then performed to assess the relationships between these delta variations.
Effect sizes for group mean differences between each time point in the ANoVA were classified as follows: minimum (d 0.41), moderate (d 1.15), and strong (d 2.70). For correlations (r), the categories used were minimum (r 0.2), moderate (r 0.5), and strong (r 0.8) [21]. The observation of the sample power was carried out post hoc using the G*Power 3.1 software with an alpha of 0.05. For the HRC, the post hoc statistical power was > 0.90. The chosen level of statistical significance was set at a p-value 0.05.
Results
Table 1 displays information on sample characteristics. The post hoc statistical power analysis for HRC revealed a value > 0.90.
Table 1
Sample characterisation (n = 15)
Table 2 presents the means of the HRC, HRV indices, the level of significance, and the deltas of the differences between the measured moments.
Table 2
Heart rate variability indices (n = 15)
[i] HRV – heart rate variability, HRC – heart rate cost of running, SDNN – standard deviation of NN intervals, RMSSD – root mean square of successive RR interval differences, pNN50 – percentage of successive RR intervals that differ by more than 50 ms, HF – relative power of the high-frequency band (0.15–0.4 Hz) in normal units, LF – relative power of the low-frequency band (0.04–0.15 Hz) in normal units, LF/HF – ratio of LF-to-HF power, SD1 – Poincaré plot standard deviation perpendicular to the line of identity, SD2 – Poincaré plot standard deviation along the line of identity, SD1/SD2 – the ratio between variations in long-and short-term intervals
An upward trend in HRC was observed 24 h post-training, followed by a significant reduction after 5 days of recovery (p < 0.05) compared to values measured 24 h post-training. The effect size differences were characterised as small between resting periods and HRC at 24 h post-training, as well as between resting periods and HRC after 5 days of recovery. However, a moderate effect size was noted between the 24-hour and 5-day recovery measurements (Figure 2).
Figure 2
Means and effect sizes (d) of heart rate cost (HRC) at three time points (n = 14). Data are expressed as mean ± standard deviation
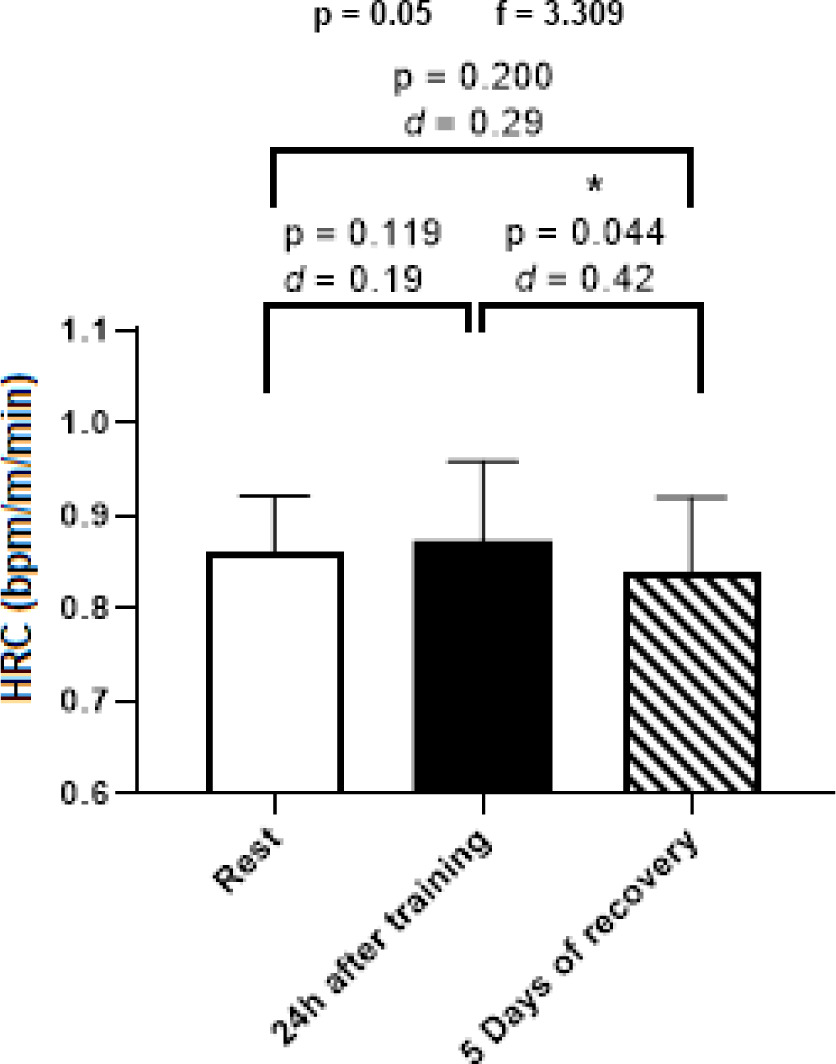
Table 3 presents the concentrations of the hormones testosterone and cortisol and the testosterone/cortisol ratio. No significant differences were observed among the three measurement points for these variables.
Table 3
Concentrations of testosterone, cortisol, and the testosterone/cortisol ratio in different time points (n = 15)
A statistically significant change was noted in CPK values between the resting periods and 24 h post-training, as well as between the 24-hour post-training and the values measured after 5 days of recovery (Figure 3).
Figure 3
Means and effect sizes of creatine phosphokinase concentration (CPK) at three time points (n = 14). Data are expressed as mean ± standard error of the mean
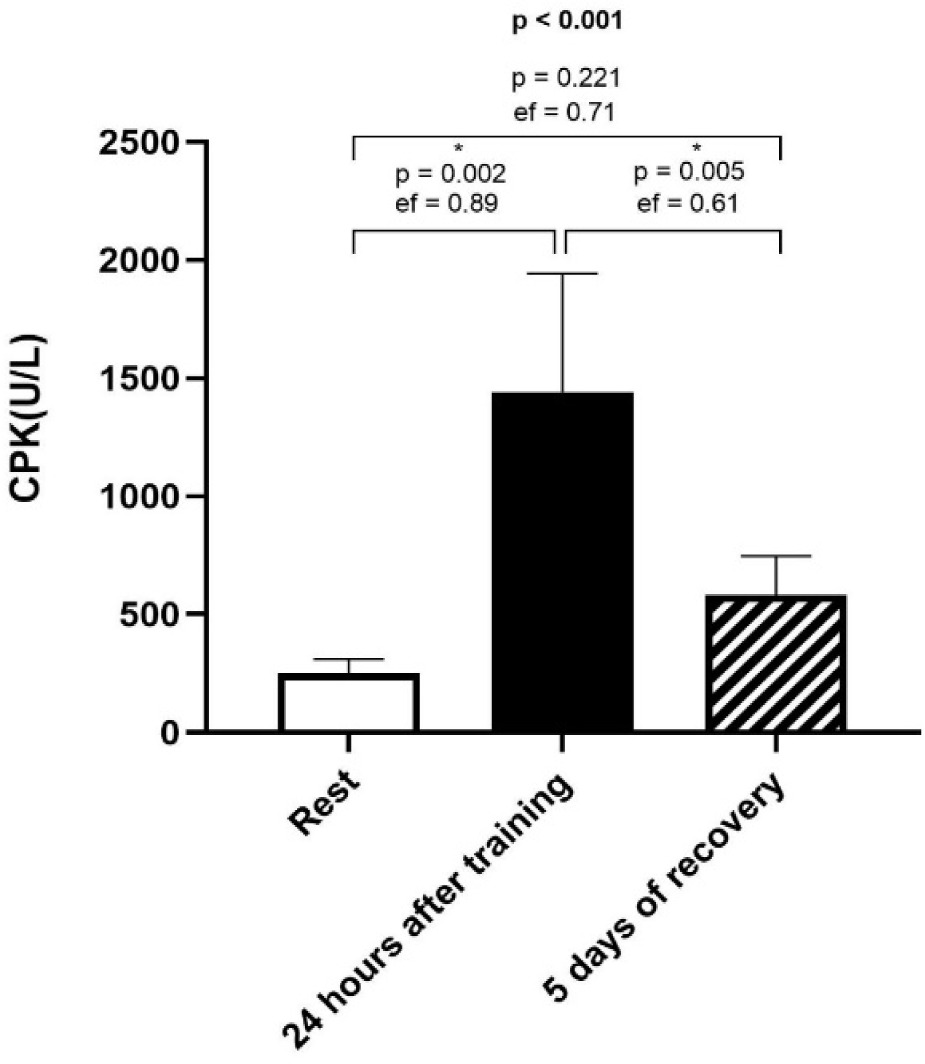
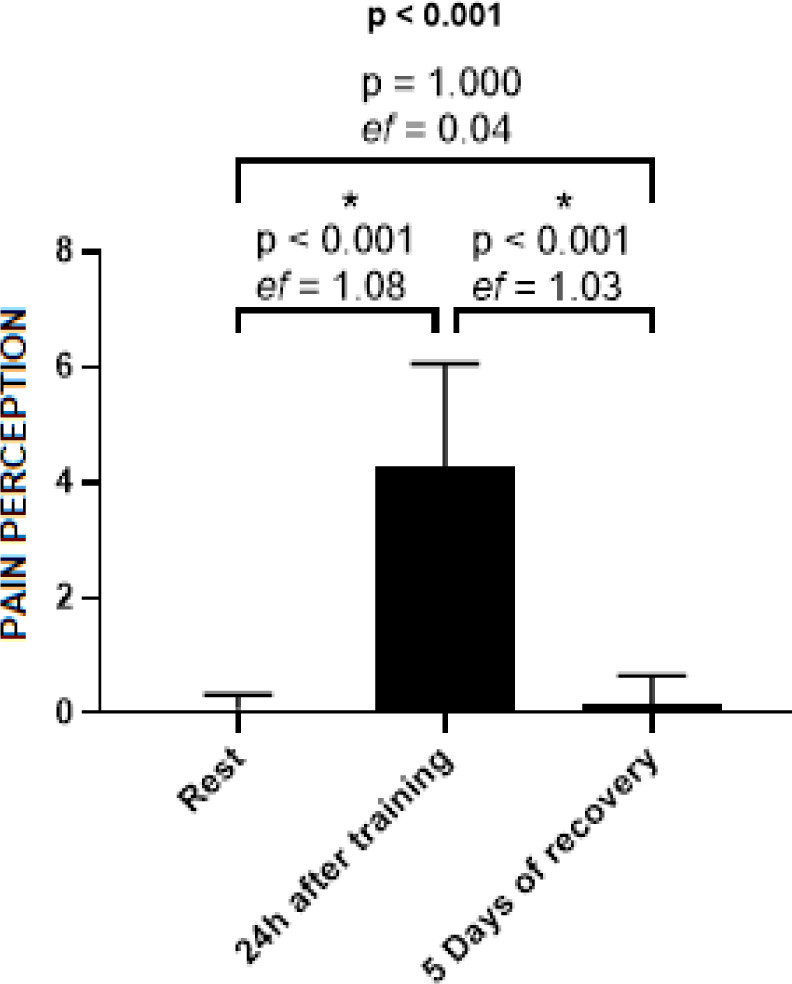
Figure 4 illustrates a statistically significant increase in the pain perception scale at 24 h post-training compared to both resting values and those measured after 5 days of recovery.
Figure 4
Means and effect sizes of pain perception through the pain scale at three time points (n = 15). Data are expressed as mean ± standard deviation
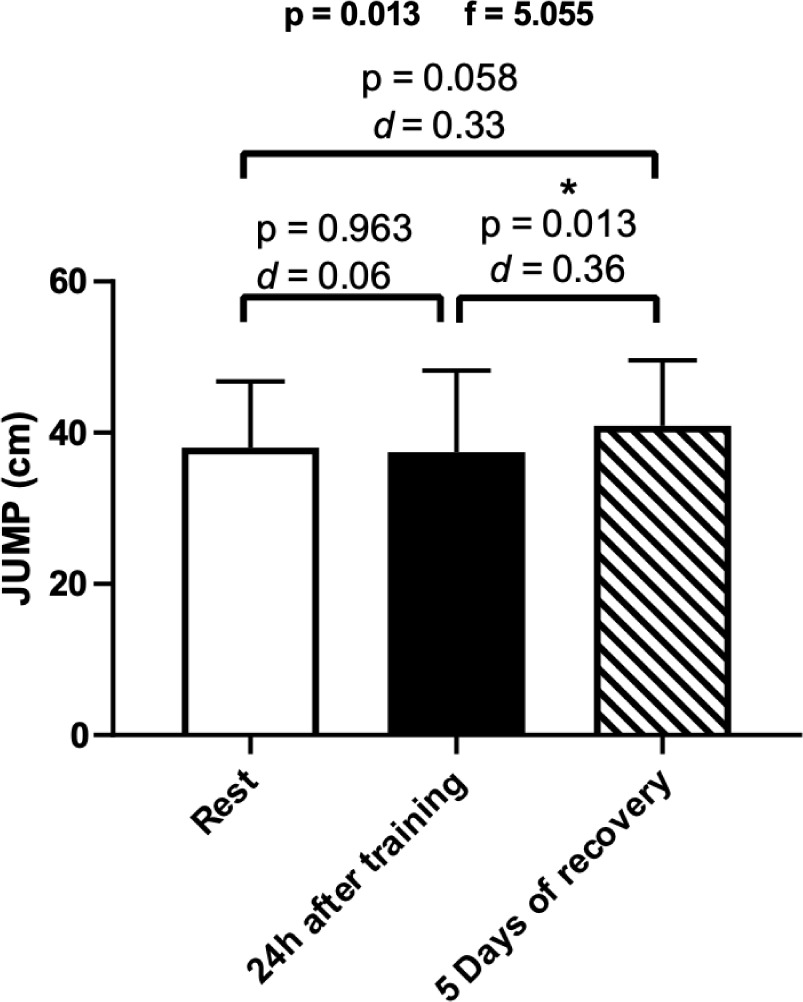
A statistically significant difference was observed in vertical jump performance after 5 days of recovery compared to 24 h post-training (Figure 5).
Figure 5
Means and effect sizes (d) of vertical jump height in the three time points (n = 15). Data are expressed as mean ± standard deviation
At the three studied time points (rest, 24 h after a training session, and following 5 days of post-training recovery), testosterone showed a moderate positive correlation with vertical jump height (Table 4).
Table 4
Correlation of testosterone concentration and vertical jump height
| Testosterone (ng/dl) | Jump1 (cm) | Jump2 (cm) | Jump3 (cm) |
|---|---|---|---|
| r | 0.632 | –0.633 | 0.699 |
| p | 0.011 | 0.011 | 0.004 |
| R2 | 0.399 | 0.400 | 0.488 |
The serum testosterone concentration exhibited a moderate positive correlation with the HF index in normalised units and the SD1/SD2 ratio. Conversely, it displayed a negative correlation with the LF index in normalised units, as presented in Table 5.
Table 5
Correlation of testosterone concentration and HRV indices
| Testosterone (ng/dl) | HF (nu) | LF (nu) | SD1/SD2 (ms) |
|---|---|---|---|
| r | 0.632 | –0.633 | 0.699 |
| p | 0.011 | 0.011 | 0.004 |
| R2 | 0.399 | 0.400 | 0.488 |
When the delta variation (Δ) of recovery (5 days – post 24 h) was calculated and analysed for the studied variables, a significant (p < 0.05) low to moderate correlation was found between HRC and VJ recovery (r = –0.69), as well as between HRC values at 5 days of recovery and 24 h post-training pain perception (r = 0.45). Additionally, a significant correlation was observed between VJ performance at 5 days and testosterone/cortisol ratio recovery (r = 0.58). Furthermore, the increase in HRC at 24 h post-training significantly correlated (p < 0.05) with the increase in pain perception at the same time point (r = 0.44). Collectively, these findings suggest that an increase in HRC, indicating a higher cardiovascular demand for the same workload, as well as trends of HRC returning to baseline following high-intensity training, reflecting physiological recovery, are linked to changes in other recovery-related variables.
Discussion
This study investigated the effectiveness of HRC during submaximal running as a tool for assessing and monitoring recovery following high-intensity acute training sessions. The main findings reveal that HRC is sensitive to changes in physical recovery status over a five-day period, emphasising its utility as a straightforward and cost-effective alternative to more complex laboratory methods, such as CPK and cortisol assessments, which often require substantial resources.
The significant reduction in HRC observed after the five-day recovery period corresponds with a decrease in both CPK levels and pain perception, as well as an improvement in vertical jump performance. These findings indicate a strong integration between cardiovascular, neuromuscular, and perceptual functions. As HRC reflects cardiac demand in response to physical stress, a lower HRC at the same exercise intensity may suggest that an athlete is well-recovered and potentially demonstrates an enhanced capacity for performance that day. The concurrent recovery of HRC and CPK on the fifth day post-intervention underscores the intricate relationship between muscle damage repair and cardiovascular efficiency [22].
The recovery of vertical jump performance, an essential marker of neuromuscular recovery, together with the decrease in CPK levels, supports the notion that, in our participants, a decrease in HRC was indicative of both reduced metabolic strain and improved neuromuscular function. This synergy between cardiovascular and neuromuscular recovery processes emphasises the multifaceted nature of athletic recovery and the usefulness of HRC.
Aerobic capacity, mechanical efficiency, and substrate availability are key factors influencing cardiac effort during exercise [23]. These variables may play a critical role in determining HRC, as the accumulation of metabolites leads to muscle fatigue and increased cardiac demand, which negatively affect endurance performance [24]. Consequently, HRC may be associated with both athletic recovery and improved performance. Therefore, the observed reduction in HRC following five days of recovery, together with recovered vertical jump performance and reduced CPK and pain perception, reflects muscular regeneration, enhanced mechanical efficiency, and clearance of metabolic byproducts. These physiological adaptations contribute to decreased cardiac workload, facilitating a lower HR during submaximal running.
Interestingly, while we did not observe substantial changes in testosterone and cortisol concentrations across the three time points, the stability of these hormones may relate to the training volume and conditioning level of the participants [25], rather than responding acutely. The relationship between testosterone and training responses remains complex; some studies indicate increases in testosterone/cortisol ratio during recovery phases [25], while others find negligible changes [26]. importantly, low testosterone levels can adversely affect muscle regeneration. in the present study, a single high-intensity exercise training session did not affect values of testosterone and cortisol in the following days of recovery.
Our analysis found a positive correlation between resting testosterone levels and the HF index of HRV, suggesting that testosterone positively influences autonomic nervous system modulation. This reinforces previous findings [27], which suggest that decreased testosterone levels may be linked to increased sympathetic nervous activity, further highlighting the interconnectedness of hormonal balance and recovery dynamics. Additionally, a positive correlation was observed between vertical jump performance following the recovery period and participants’ testosterone levels, emphasising the role of testosterone in neuro-muscular function and inflammation status, as previously demonstrated [28–30].
We acknowledge the small sample size as a limitation of this study. Therefore, we encourage future research involving diverse population groups to provide a more comprehensive understanding of HRC usefulness across different age groups and fitness levels.
Conclusions
HRC was demonstrated to be a practical and sensitive tool for assessing recovery after acute training, with reductions in HRC aligning with improvements in CPK levels, pain perception, and vertical jump performance after five days of recovery. The positive correlation between testosterone levels and vertical jump performance further suggests that hormonal balance plays a key role in recovery. Notably, studying HRC in populations like master athletes, who typically have lower testosterone levels, could provide valuable insights. Future research should explore HRC’s applicability across diverse groups and contexts.